HAL Id: hal-01107691
https://hal.archives-ouvertes.fr/hal-01107691
Submitted on 21 Jan 2015
HAL is a multi-disciplinary open access
archive for the deposit and dissemination of
sci-entific research documents, whether they are
pub-lished or not. The documents may come from
teaching and research institutions in France or
abroad, or from public or private research centers.
L’archive ouverte pluridisciplinaire HAL, est
destinée au dépôt et à la diffusion de documents
scientifiques de niveau recherche, publiés ou non,
émanant des établissements d’enseignement et de
recherche français ou étrangers, des laboratoires
publics ou privés.
Agnes Köhler, Jean Krivine, Jakob Vidmar
To cite this version:
Agnes Köhler, Jean Krivine, Jakob Vidmar. A Rule-Based Model of Base Excision Repair.
Com-putational Methods in Systems Biology, Nov 2014, Manchester, United Kingdom. pp.173 - 195,
�10.1007/978-3-319-12982-2_13�. �hal-01107691�
Agnes K¨ohler1, Jean Krivine2⋆, and Jakob Vidmar2 1
INRIA-Rocquencourt
Domaine de Voluceau - Rocquencourt B.P. 105 - 78153 Le Chesnay, France
2
Univ. Paris Diderot, Sorbonne Paris Cit´e, Laboratoire PPS, UMR 7126, F-75205 Paris, France
Abstract. There are ongoing debates in the DNA repair community on whether the coordination of DNA repair is achieved by means of direct protein-protein interactions or whether substrate specificity is sufficient to explain how DNA intermediates are channeled from one repair enzyme to the other. In order to address these questions we designed a model of the Base Excision Repair pathway in Kappa, a rule based formalism for modeling protein-protein and protein-DNA interactions. We use this model to shed light on the key role of the scaffolding protein XRCC1 in coordinating the repair process.
1
Introduction
A modern trend of Systems Biology sees high-throughput experiments being set
up, resulting in an inflation of the publication volume in Biology and medicine3.
As a consequence it has become impossible for a biologist, specialist of a certain system, to remain up-to date with all relevant information pertaining to her topic of interest. To counter for this problem, biologists make an intensive use
of review papers which are regularly published on a given system4.
As an alternative to classical reviews, which are static objects with a natural obsolescence, we propose to use rule-based modeling [1, 2] to designing formal updatable reviews that are at the same time executable [3, 4].
More specifically, this paper presents the first executable model of the Base Excision Repair (BER) pathway that includes protein-DNA interactions. The outline of the paper is as follows: in Section 2 we briefly present the BER sys-tem (reviewed for instance in Ref. [5, 6]), we discuss our tools and methods in Section 3 and we present some results in Section 4.
OH P P B.1 AP A B.2 C.1 C.2 D DNA mismatch Apurinic site
Gapped DNA Gapped DNA
(with clean ends) Nicked DNA (ligatable)
3' 5'
5' 3'
Damage step Enzymatic step Cytotoxic DNA intermediates OH DNA duplex
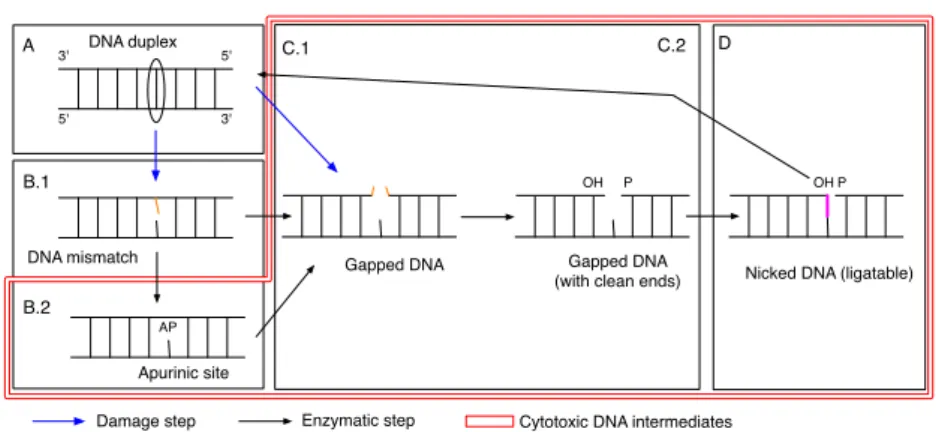
Fig. 1.Abstract Base Excision Repair pathway.
2
Base Excision Repair
Figure 1 gives a possible unfolding of the abstract Base Excision Repair (BER) pathway: Various types of damage (A) may modify a nucleotide (oxydation, deamination) and induce a mismatch in DNA (B.1) or a single strand break (C.1). Enzymes from the family of DNA Glycosylase may recognize mismatches and excise the modified base, creating an Apurinic (AP) site (B.2). Enzymes with AP endonuclease capacity may open DNA at the lesion locus, generating a single strand break. End cleaning enzymes may prepare the 3’ and 5’ moieties for the polymerase step (C.2). Eventually DNA ligases can seal the DNA backbone (D) to retrieve a well-formed DNA duplex.
This scenario corresponds to only one possible unfolding of BER and the story could diverge at various points: for instance a direct single strand break may induce the loss of more than one nucleotide. Also when the end cleaning enzymes fail to prepare a proper substrate, some polymerases may synthesize more than one new nucleotide and trigger an alternative long patch repair pathway.
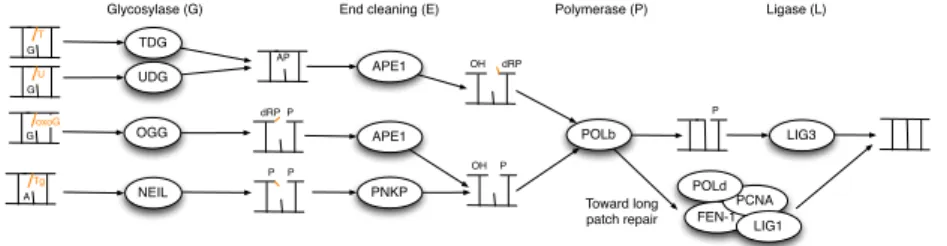
Furthermore this map is abstract as several enzymes may engage in the var-ious catalytic steps that are described. For instance the transition from (B.1) to (B.2) or directly (C.1) is realized by different glycosylases, the identity of which depends on the type of nucleotide modification that has occurred. Ten glycosylases have been found so far in higher eukaryotic cells, we modeled the activity of 4 of them and used UDG (for uracil excision in U/G mismatches) as
⋆This work has been partially supported by the French National Research Agency
(ANR), project ICEBERG
3
In 2000 about 500,000 papers were published in Biology and Medicine. In 2012 this number had escalated to 1,000,000 (source Pubmed.org).
4
There are 520 review papers mentioning Base Excision Repair in the title or abstract (source Pubmed.org)
default enzyme in our simulations. We give a more concrete description of the BER enzymes in Figure 2.
Glycosylase (G)
UDG
End cleaning (E)
OH dRP AP T G U G Tg A P P TDG NEIL APE1 PNKP P POLb Polymerase (P) LIG3 Ligase (L) OH P Toward long patch repair FEN-1
PCNA LIG1 OGG oxoG G dRP P APE1 POLd
Fig. 2.A more concrete view of BER.
Together, Figure 1 and Figure 2 give an almost complete view of BER and ODEs based models have been proposed to formalize this part [7, 8]. However they only reveal the catalytic steps that transform DNA, and do not take into account important proteins that have no direct enzymatic activity but are im-portant to coordinate the repair process. More imim-portantly, BER enzymes do not behave as typical enzymes that often have little affinity for their products. We will see that most enzymes of Fig. 2 have a non negligible affinity for vari-ous DNA intermediates, and this feature is probably critical for channeling DNA products to the next enzyme in the pathway, through protein or protein-DNA interactions [9].
This last description step is key to our modeling project, since (1) this is the step which is difficult to model as it entails a combinatorial explosion in the number of variables of the model, and (2) these complex interactions can give us insight into the coordination of the repair pathway i.e passing the baton between the different enzymes of Fig. 2.
Coordination is not so much an issue of efficiency, since high enzymatic turnover would probably yield a faster global repair rate. Figure 1 shows that the intermediate substrates (B.2), (C.1), (C.2) and (D) of the repair pathway are cytotoxic. In a nutshell, AP sites (a missing base), gapped and nicked DNA induce genomic instability and BER has probably evolved so as to prevent these substrates from being accessible to enzymes that may trigger apoptosis if such damage is detected (such as Topoisomerases).
The main protein that is believed to act as a coordinator of BER is the X-Ray Cross Complementing protein 1 (XRCC1). Although it has no known catalytic activity, this protein can bind to all BER enzymes that are downstream of the glycosylase. It is noteworthy that proteins interacting with XRCC1 are also those operating on the cytotoxic substrates. It is therefore assumed that XRCC1 acts as a scaffolding protein that coordinates BER, as well as a patch over the lesion to protect it from the environment.
XRCC1 POLB LIG3 APE1 PNKP TDG UDG
Towards long patch repair
5nM 65nM 40nM 1µM 110nM 57µM 18nM 1nM 6nM 293nM 230nM 48nM 200nM Normal DNA duplex
DNA Mismatch Apurinic/Apyrimidic site Gapped DNA (X=OH,P,PUA and Y=P,dRP)
Nicked DNA 5nM 5nM dR A T G G C 3' 5' C ... dR P P dR ... dR ... P dR P dR ... dR A T G G C 3' 5' U ... dR P P dR ... dR ... P dR P dR ... dR A T G G C 3' 5' ... dR P P dR ... dR ... P dR P dR ... dR A T G G C 3' 5' ... X Y dR ... dR ... P dR P dR ... dR A T G G C 3' 5' C ... dR P P dR ... dR ... P dR P dR ... OH dR A T G C 3' 5' C ... dR P G Y dR dR ... P dR P dR G dR P OH P P dR T A dR ... ... 1nM 100nM 230nM 23nM G G E E P L AP
Fig. 3.The contact map of the BER model.
We give Figure 3, the protein-protein and protein-DNA contact map that we inferred from the literature. The strength of the interaction is depicted here
through various line widths and the dissociation constant (Kd) is shown. Dotted
lines represent known interactions the Kd of which could not be found. This
map makes apparent that several proteins compete for the same family of sub-strates. For instance APE1 and POLβ tend to bind to gapped DNA. Since DNA substrates are complex polymers one cannot assume that binding to a partic-ular DNA substrate is exclusive of any other binding. Notably, it is assumed that XRCC1 can stay connected to gapped DNA throughout the whole repair process.
3
Methods
Data. We have assembled qualitative (mechanisms of action) and quantitative
(concentration, dissociation constant, catalytic rates) data from 59 papers
per-taining to BER or to its participants5. For lack of space we do not include the
complete references in the present paper but they are included in the model repository as an annotated bibtex file.
Quantitative data are particularly difficult to find. For testing the model un-der plausible conditions, we extracted BER protein copy numbers from Ref.[10]
5
We thank Dr. S. Mitra (Houston Methodist Hospital), Dr. D. M. Wilson III (National Institute on Ageing), Dr. S. H. Wilson (NIEHS, NIH) and Dr. K. Caldecott (Univ. Sussex), for direct discussions which directed us to relevant publications.
which evaluates protein concentration for HeLa cell extracts. Note that we ex-pect repair accuracy to be robust with resex-pect to variation of protein numbers, as the chromatin state might create local concentration effects on DNA [11].
Catalytic rates for enzymatic activities are easier to find although product inhibition (enzyme with a non negligible binding affinity for its product), which is typical of BER, complicates the interpretation of the rates which are often given in terms of steady state kinetics. More precisely, as can be seen in Fig. 3, most BER enzymes exhibit a scheme of the form:
E + S ↔KdES →kchem EP ↔Kd′ E + P
with a reasonably low K′
d. Experimental catalytic rates kcatare measures of the
production speed of P , which, in the above case, is slowed down by product
inhibition. Some experiments [12–14] give a measure of kchem for the above
scheme, but most paper will only give kcat (which underestimates the hidden
kchem). Whenever kchem is not available we assumed the scheme:
E + S ↔Kd ES →kcat E + P ↔Kd′ EP
which simply lets the enzyme rebind to its product according to the given K′
d when available.
Yet, dissociation constants for protein-protein and protein-DNA interactions are also complicated to find. Whenever facing unknown data, we used the rate of a similar interaction. For instance we assumed that all glycosylases have the same facilitated diffusion on DNA, using data published for hOGG1 [15].
Importantly, KaSim requires concrete on and off rates for complex formation. When only steady state dissociation constants are known, we used a default
kon (randomized in simulations) to deduce koff (Kd = koff/kon). Importantly,
complex formation occurring in a uni-molecular fashion are assumed to be fast
(kuni = 104s−1). Whenever the kinetic data was unknown for a given reaction,
we used a default kinetic rate k (taken from realistic values for the type of
reaction), and randomized it uniformly in the interval [k
10, 10 ∗ k]. The list of complete kinetic rates is provided in Supp. data A.2.
Rule-based modeling. The input language of KaSim simulator is Kappa [2],
a (rule-based) graph rewriting language, the syntax of which is recalled in Supp. Data A.1.
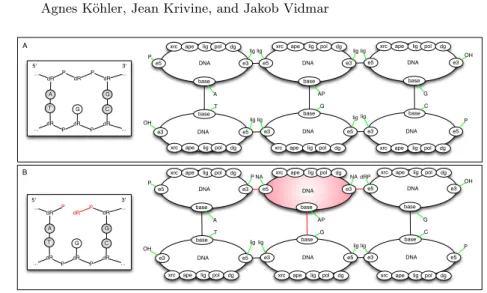
Figure 4 illustrates how DNA polymers are encoded in our model: (A) an apurinic -AP- site and (B) a one nucleotide gapped DNA. The ports on top of DNA nodes allows one to connect various BER enzymes. Internal states are mapped to the corresponding port via a green edge. There are a few key modeling features to notice. Our DNA nodes denote either physical DNA bases, or an empty slot on DNA. Hence a DNA node can either be part of the (physical) DNA backbone, as in the encoding of (A), or be a place holder for enzymes that recognize holes on DNA, as in the red part of the encoding of substrate (B). In the latter substrate, one may read from the Kappa encoding that the middle
DNA e3 e5
base xrc ape lig pol dg
DNA e3 e5 base DNA e3 e5 base DNA e3 e5 base DNA e3 e5 base DNA e3 e5 base
lig lig lig lig
lig lig lig lig P OH T A G AP C G OH P DNA e3 e5 base DNA e3 e5 base DNA e3 e5 base DNA e3 e5 base DNA e3 e5 base DNA e3 e5 base P NA NA dRP lig lig lig lig P OH T A G AP C G OH P A B
xrc ape lig pol dg xrc ape lig pol dg
xrc ape lig pol dg xrc ape lig pol dg
xrc ape lig pol dg
xrc ape lig pol dg xrc ape lig pol dg xrc ape lig pol dg
xrc ape lig pol dg xrc ape lig pol dg
xrc ape lig pol dg dR A T G G C 3' 5' ... dR P P dR ... dR ... dR P P dR ... dR A T G G C 3' 5' ... P dR dR ... dR ... P dR P dR ... P
Fig. 4.Two oligonucleotides in Kappa.
node is in fact a gap on DNA because it is no longer ligated to the 3’ and 5’ neighbors (internal state of the e3 and e5 ports set to NA). Notice that the e3 port of upper left DNA node of part (B) is set to P, indicating that the 3’ end of the gap bears a phosphate group (that can be for instance recognized by APE1).
Simulation. Simulations of the model were conducted on a dedicated HP server
(1.60GHz/4-cores) with 128 GB of RAM. Iterations of simulations under various parameters and randomization of kinetic rates are piloted by a python script (included in the model repository) which requires python 2.7 and simplejson.
KaSim3.5 is necessary to run simulations and is available on github6.
Unless specified otherwise, simulation results are obtained as the average of 16 simulations ran on a DNA substrate of 100,000 bp randomly generated accord-ing to the distribution: (0.6 : GC, 0.4 : AT). In addition to the DNA substrate, initial number of BER enzymes are 2200 UDG; 30,000 APE1; 3,000 POLβ; 400 LIG3 and 1200 XRCC1 (ratios are taken from Ref. [10] and normalized so that the lowest number of potentially modeled enzyme (TDG) is greater than 100). Simulations are run without any damage on DNA for 2 seconds (biological time unit) after which we induced 2% of cytosine deamination, generating U/G mis-matches on DNA. Simulations are conducted until complete repair is observed, in average after t ∼ 6 minutes (biological time). Efficiency of simulations is discussed in Supp. Data A.4.
Causality analysis. Causality analysis of Section 4 were performed by
en-abling KaSim’s causal tracking of the ligation rule, on simulations on a 25K
6
bp DNA substrate. From a single simulation, KaSim computed 189 causally or-dered traces (causal flows) leading to the ligation steps occurring between t=20s and t=80s (ligation activity is constant after 10s, data not shown). We then performed weak compression [16] that quotiented the number of causal flows to
122 (36% compression) incompressible scenarios7.
4
Results
A Kappa model of Base excision Repair including protein-DNA
inter-actions. We have assembled the first executable model of BER that incorporates
protein-protein and protein-DNA interactions as well as enzymatic activity on DNA substrates. The actual model contains the interaction rules for 4 glyco-sylases (UDG, TDG, NEIL and OGG1); the AP-endonuclease (APE1) and the end cleaning enzyme PNKP; the polymerase (POLβ) and the ligase (LIG3). The interactions with scaffold protein XRCC1 is also included. Various DNA substrates for initial conditions can be generated using a python script.
The complete model as well as python and json configuration files are
acces-sible as a github repository8 and can be tested under the requirements specified
in the Methods section.
Overall the version of the model we used in simulations contains 87 rules split into Kappa files of various size described in Supp. data A.3.
XRCC1 primarily impacts ligation efficiency. There are a large number
of possible in silico experiments one can try with our BER model. Since it is the first to incorporate protein-protein interactions, we naturally sought to study the role of the scaffolding protein XRCC1. As a first approach we ran a batch of simulations, under the conditions specified in the Methods section, with and
without XRCC1. The simulations are denoted hereafter x+ (with XRCC1) and
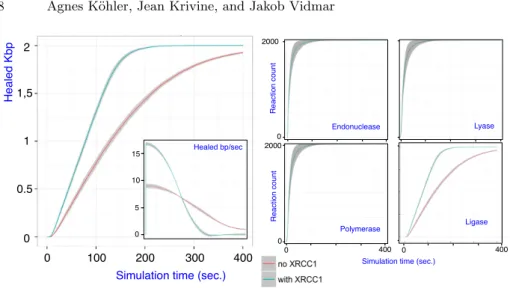
x− (without). Figure 5 shows the average plots for both x+ and x−. We first
observed that both series of simulations were able to process the totality of initial
damage (Fig. 5, left plot). However x− exhibited a significant decrease is repair
speed with respect to x+, with 10 healed base pairs per seconds (maximal speed)
vs. 17 healed base pairs per seconds (Fig. 5, left plot, small insert).
We then tried to narrow down the origin of that speed difference by de-composing the global repair into the 4 catalytic steps that follow the
gylcosy-lase reaction (Fig. 5, right). No significant difference between x− and x+ could
be observed for endonuclease (APE1), lyase and polymerase (POLβ) reactions. Therefore the only possible difference of total repair activity lies in the ligation step. These observations are consistent with the fact that XRCC1 is dispensable for complete repair in vitro [17] and that XRCC1 deficient cells are defective in processing nicked DNA intermediates [18].
7
Incompressible flows are partial ordering of simulation events with the property that all the events are (transitively) a cause of the final event (the observable) and no trace containing a strict subset of these events may still contain the observable.
8
0 0.5 1 1,5 2 0 100 200 300
Simulation time (sec.)
H e a le d Kb p 400 0 5 10 15 Healed bp/sec Endonuclease Lyase Polymerase 0 400 0 400
Simulation time (sec.)
R e a ct io n co u n t 2000 2000 R e a ct io n co u n t 0 0 Ligase
Fig. 5.(Left plot) Simulation efficiency with and without XRCC1, shadows indicate standard deviation. (Right plot) Efficiency of BER catalytic steps, with and without XRCC1.
Mechanistic insights into the transition from POLβ to LIG3. XRCC1
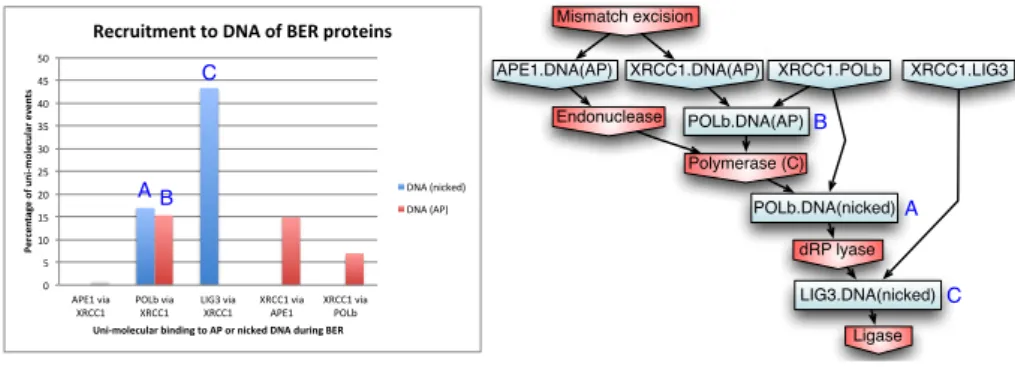
is commonly referred to as a scaffolding protein for BER enzymes. The intu-itive idea is that XRCC1 maintains APE1, POLβ, and LIG3 at the lesion site, throughout the whole repair process. As suggested by our simulations, the scaf-folding role of XRCC1 is unevenly distributed among its potential partners. In order to investigate whether BER enzymes are actually brought to DNA by XRCC1, we used KaSim’s causal tracking mode for the ligation step. To do so, we analyzed 122 (compressed) causal flows generated by a ligase event, produced under the conditions described in the Methods section. According to the sam-ple, approximately 80% of ligation events contained an action of XRCC1 in their causal history (data not shown). We therefore sought to analyze more in details what was the exact role of XRCC1 in the ligation pathways. The histogram of Fig. 6 indicates that nearly 45% of uni-molecular binding events occurring on DNA, that are in the causal past of a ligation event, correspond to the recruit-ment of LIG3 to the nicked DNA intermediate by XRCC1 (C). XRCC1 is also found recruiting POLβ to AP sites (B) and nicked DNA (A) in about 15% of the scenarios leading to ligation. Interestingly XRCC1 is recruited to DNA by APE1 (15%) and POLβ (7%) in a significant number of scenarios. The little impact of XRCC1 on the recruitment of APE1 (less than 1% of scenarios) to the lesion sites is likely due to the relatively low turnover rate of UDG coupled with the large amount of APE1 in the system which enable a smooth transition between UDG and APE1 over the AP substrate. A characteristic causal flow obtained from a simulation is given Fig. 6 (right): nodes correspond to rule applications and arrows represent causality between them. As a labeling convention, X.Y in-dicates a complex formation between proteins X and Y and rectangular nodes
XRCC1.POLb XRCC1.LIG3 Mismatch excision APE1.DNA(AP) XRCC1.DNA(AP) Endonuclease Polymerase (C) POLb.DNA(nicked) dRP lyase LIG3.DNA(nicked) Ligase POLb.DNA(AP) A B C 0" 5" 10" 15" 20" 25" 30" 35" 40" 45" 50" APE1"via" XRCC1" POLb"via" XRCC1" LIG3"via" XRCC1" XRCC1"via" APE1" XRCC1"via" POLb" Percen ta ge)o f)u n i.mo lecu la r)even ts) Uni.molecular)binding)to)AP)or)nicked)DNA)during)BER) Recruitment)to)DNA)of)BER)proteins) DNA"(nicked)" DNA"(AP)" B A C
Fig. 6.(Left) Analysis of causal 122 flows exhibiting the intervention of XRCC1 and leading to a ligation event. (Right) A example of causal flow containing POLβ and LIG3 binding events via XRCC1.
indicate uni-molecular reactions that occurred under the scaffolding of XRCC1. Red nodes correspond to the chemical steps of the pathway.
Overall, causality analysis confirms the key role of XRCC1 in securing the transition between the polymerase step and ligation.
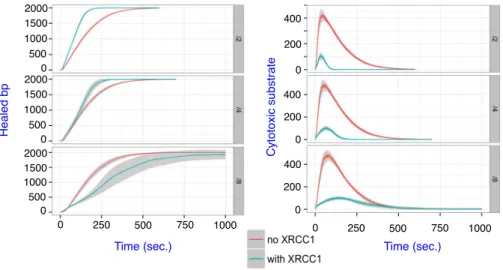
XRCC1 limits cytotoxicity BER. Since XRCC1 plays an active role in
passing the baton between POLβ’s products and LIG3’s substrate, we wondered whether this coordination impacts on the cytotoxicity of BER. To do so we
an-alyzed the amount of visible toxic DNA intermediates over time in x+ and x−.
A toxic substrate is understood here as either an AP site, a gapped DNA or a nicked DNA node that is not bound by any BER protein. Figure 7 shows the amount of total nicked DNA that is present in silico over the duration of BER
(Left plot). As expected, x+and x− produce approximatively the same amount
of nicked intermediates in the pre-steady state phase, since the ligation step is
rate limiting (kcat = 0.04s−1for LIG3 which is half the speed of the second
slow-est reaction, see Supp. Data A.2). However x+ has an apparent faster rate for
processing nicked DNA. Interestingly this results in a much higher cytotoxicity
of x− simulations (Fig. 7, right plot) which is almost entirely caused by
unpro-tected nicked DNA (data not shown). This is consistent with the experimentally observed sensitivity of XRCC1 mutant cells to induced DNA damage [11].
A tradeoff between accuracy and efficiency under varying amount of
POLβ. The nucleus is a very crowded medium and local chromatin state can
induce local concentration effects [11]. We thus investigated further the role of XRCC1 under decreasing amount of available POLβ (Figure 8). These exper-iments showed that when the system is moderately deprived of POLβ (up to 1/4 dilution of the default amount), XRCC1 contributes to maintaining a fast repair rate by holding LIG3 at lesion sites, waiting for the product of POLβ’s
0 100 200 300 100 200 300 C yt o to xi c su b st ra te s
Simulation time (sec.)
400 N icke d D N A (x1 0 0 0 ) 1,5 1 0,5 0 0 100 200 300 400
Simulation time (sec.)
Fig. 7.Nicked DNA intermediates (left) and cytotoxic substrates in the presence and absence of XRCC1.
reactions. Surprisingly, at higher dilutions of POLβ, the price of this coordina-tion becomes rate limiting for the overall repair speed. This is likely due to LIG3 being sequestered too long on AP sites in the absence of POLβ when ligatable substrates are elsewhere available. Importantly, under such extremal conditions XRCC1 still actively limits the amount of cytotoxic substrates (mainly in the form of nicked DNA) available to the environment.
This observations could imply that partial mutant cells (XRCC1−,POLβ−)
would have a global faster repair activity than simple (XRCC1+,POLβ−)
mu-tants, although with a very likely higher sensitivity to damage.
5
Discussion
A Kappa model of BER. We have collated a set of mechanisms of action
pertaining to BER, as a set of Kappa rules. It results in an executable model of DNA repair that can be used to test various hypothesis on DNA repair mecha-nisms. As an instance of such applications, we have investigated the impact of the scaffolding protein XRCC1 on repair activity. Consistent with experimental ob-servations, our model shows that complete repair can be achieved in the absence of XRCC1. Furthermore the model successfully predicts the impact XRCC1 on BER, the absence of which resulted in the accumulation of unprotected nicked DNA intermediates and an impaired repair speed in simulations. Beyond avail-able experiments, our model indicates that XRCC1 might be recruited by APE1 to the damage site. It would afterward proceed with the recruitment of POLβ and, to a higher degree, LIG3. Eventually we showed that XRCC1 contributes to the robustness of BER with respect to large variation of POLβ’s
concen-Healed bp C yt o to xi c su b st ra te
Time (sec.) Time (sec.)
0 500 1000 1500 2000 0 500 1000 1500 2000 0 500 1000 1500 2000 0 250 500 750 1000 0 250 500 750 1000 0 200 400 0 200 400 0 200 400
Fig. 8. Repair efficiency and cytotoxicity of simulations with increasing dilution of POLβ (/2, /4 and /8 with respect to default amount).
tration, preserving the repair efficiency up-to a certain dilution level (/4), and maintaining a low amount of cytotoxic substrate over time.
Towards a comprehensive model of BER. More studies on the dynamics of
the present model can be performed, beyond the scope of this paper. Also more biological facts need to be incorporated. Among them, the addition of PARP1, that plays an important role in an alternative way to recruit BER enzymes to the damaged site, seems to be a priority. We would also like to model the alternative long patch repair which occurs when BER is unable to produce a ligatable substrate. It will be particularly interesting to see how XRCC1 can regulate the switch between long patch and short patch BER, as experimental studies indicate.
Perspectives. Our stance is to take both qualitative and quantitative data
seriously and collate them into a comprehensive model. We believe this model can be used to raise challenges to the biologist community about missing infor-mation and also highlight key points where the DNA repair community agrees or disagrees. We also believe that a comprehensive model can be used to make predictions on possible experiments and help the biologists to explore the wet lab perturbation space in a rational manner.
References
1. Faeder, J.R., Blinov, M.L., Hlavacek, W.S.: Rule based modeling of biochemical networks. Complexity (2005) 22–41
2. Danos, V., Feret, J., Fontanta, W., Harmer, R., Krivine, J.: Rule based model-ing of biological signalmodel-ing. In Caires, L., Vasconcelos, V.T., eds.: Proceedmodel-ings of CONCUR 2007. Volume 4703 of LNCS., Springer (2007) 17–41
3. Danos, V., Feret, J., Fontana, W., Krivine, J.: Scalable simulation of cellular signaling networks. In: Proceedings of APLAS 2007. Volume 4807 of LNCS. (2007) 139–157
4. Sneddon, M.W., Faeder, J.R., Emonet, T.: Efficient modeling, simulation and coarse-graining of biological complexity with NFsim. Nature methods 8 (2011) 177–183
5. Hedge, M.L., Hazra, T.K., Mitra, S.: Early steps in the DNA base excision/single-strand interruption repair parthway in mammalian cells. Cell Research 18 (2008) 27–47
6. Kim, Y.J., III, D.M.W.: Overview of base excision repair biochemistry. Curr Mol Pharamacol 5 (2012) 3–13
7. Sokhansanj, B.A., Rodrigue, G.R., Fitch, J.P., III, D.M.W.: A quantitative model of human DNA base excision repair. i. mechanistic insights. Nucleic Acids Research 30(2002) 1817–25
8. Sokhansanj, B.A., III, D.M.W.: Estimating the effect of human base excision repair protein variants on the repair of oxidative DNA base damage. Cancer Epidemiol Biomarkers Prev 15 (2006) 1000–08
9. Prasad, R., Shock, D.D., Beard, W.A., Wilson, S.H.: Substrate channeling in mammalian base excsion repair pathways: Passing the baton. Journal of Biological Chemistry 285 (2010) 40479–88
10. Nagaraj, N., Wisniewski, J.R., Geiger, T., Cox, J., Kircher, M., Kelso, J., P¨a¨abo, S., Mann, M.: Deep proteome and transcription mapping of a human cancer cell line. Mol. Sys. Biol. 7 (2011)
11. Lan, L., Nakajima, S., Oohata, Y., Takao, M., Okano, S., Masutani, M., Wilson, S.H., Yasui, A.: In situ analysis of repair processes for oxidative DNA damage in mammalian cells. PNAS 101 (2004) 13738–43
12. Strauss, P.R., Beard, W.A., Patterson, T.A., Wilson, S.H.: Substrate Binding by Human Apurinic/Apyrimidinic Endonuclease Indicates a Briggs-Haldane Mecha-nism. Journal of Biological Chemistry 272 (1997) 1302–07
13. Maher, R.L., Bloom, L.B.: Pre-steady-state Kinetic Characterization of the AP Endonuclease Activity of Human AP Endonuclease. Journal of Biological Chem-istry 282 (2007) 30577
14. Fitzgerald, M.E., Drohat, A.C.: Coordinating the initial steps of base excision repair. Journal of Biological Chemistry 47 (2008) 32680
15. Blainey, P.C., can Oijen, A.M., Banerjee, A., Verdine, G.L., Xie, X.S.: A base-excision DNA-repair protein finds intrahelical lesion bases by fast sliding in contact with DNA. PNAS 103 (2006) 5752–57
16. Danos, V., Feret, J., Fontana, W., Harmer, R., Hayman, J., Krivine, J., Thompson-Walsh, C., Winskel, G.: Graphs, Rewriting and Pathway Reconstruction for Rule-Based Models. In: FSTTCS 2012, LIPIcs (2012)
17. Kubota, Y., Nash, R.A., Klungland, A., Sch¨ar, P., Barnes, D.E., Lindahl, T.: Re-constitution of DNA base excision-repair with purified human proteins: interaction between DNA polymerase β and the XRCC1 protein. The EMBO journal 15 (1996) 6662–70
18. Cappelli, E., Taylor, R., Cevasco, M., Abbondandolo, A., Caldecott, K.W., Frosina, G.: Involvement of XRCC1 and DNA ligase III gene products in DNA base excision repair. Journal of Biological Chemistry 272 (1997) 23970–75
Student paper statement: Agnes K¨ohler and Jakob Vidmar are Master students at the Master Parisien de Recherche en Informatique (Univ. Paris Diderot, ENS and Ecole Polytechnique) supervised by Jean Krivine. The paper was written by JK, assisted by AK and JV. The model was entirely assembled by AK and JV. AK (70%) and JV (30%) took care of the data collation and reviewed the biological background of BER. AK (20%) and JV (80%) did the encoding of biological facts in Kappa. JV designed the python scripts piloting the simulations and wrote the R scripts for generating the plots.
A
Supplementary Data
A.1 The Kappa Language
We adapt here the presentation of Kappa, given in KaSim’s manual9.
General remarks The Kappa File (KF) is the formal representation of a model.
We use KF to denote the union of the files that are given as input to KaSim (ar-gument -i). Each line of the KF is interpreted by KaSim as a declaration. If the line is ended by the escape character '\' the continuation of the declaration is parsed onto the next line. Declarations can be: agent signatures, rules, variables, initial conditions, perturbations and parameter configurations. The KF’s struc-ture is quite flexible and can be divided in any number of sub-files in which the order of declarations does not matter (to the exception of variable declarations). Comments can be used by inserting the marker # that tells KaSim to ignore the rest of the line.
Agent signature In Kappa there are two entities that can be used for
repre-senting biological elements: agents and tokens (we don’t consider token here). Agents are used to represent complex molecules that may bind to other molecules on specific sites.
In order to use agents in a model, one needs to declare them first. Agent signatures constitute a form of typing information about the agents that are used in the model. It contains information about the name and number of inter-action sites the agent has, and about their possible internal states. A signature is declared in the KF by the following line:
%agent: signature expression
according to the grammar given Table 1 where terminal symbol are denoted in (blue) typed font. Symbol Id can be any string generated by regular expression
[a − z A − Z][a − z A − Z 0 − 9 − +]∗. Terminal symbol ε stands for the empty
symbol.
For instance the line:
9
Table 1.Agent signature expression signature expression ::=Id(sig)
sig ::=Idinternal state list,sig | ε internal state list ::=~Idinternal state list | ε
%agent: A(x,y~u~p,z~0~1~2) # Signature of agent A
will declare an agent A with 3 (interaction) sites x,y and z with the site y possessing two internal states u and p (for instance for the unphosphorylated and phosphorylated forms of y) and the site z having possibly 3 states respectively 0, 1 and 2. Note that internal states values are treated as untyped symbols by
KaSim, so choosing a character or an integer as internal state is purely matter
of convention.
Rules Once agents are declared, one may add to the KF the rules that describe
their dynamics through time. A pure rule looks like: 'my rule' kappa expression → kappa expression @ rate
where 'my rule' can be any name that will refer to the subsequent rule that can be decomposed into a left hand side (LHS) and a right hand side (RHS) kappa expressions together with a kinetic rate expression . One may also declare a bi-directional rule using the convention:
'bi-rule' kappa expression ↔ kappa expression @ rate+,rate−
Note that the above declaration corresponds to writing, in addition of 'my-rule', a backward rule named 'my rule op' which swaps left hand side and right hand side, and with rate rate−.
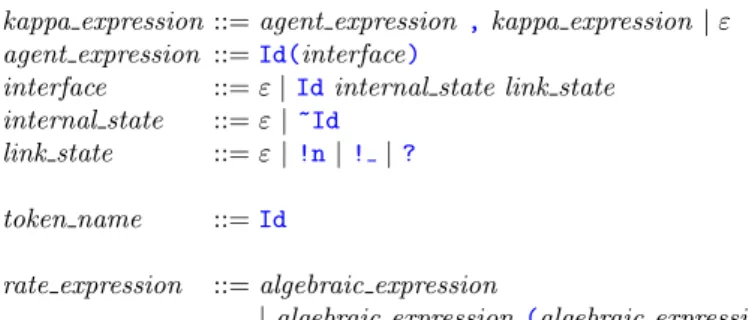
Kappa and rate expressions are generated by the grammar given in Table 2.
Table 2.Kappa expressions
kappa expression ::= agent expression ,kappa expression | ε agent expression ::=Id(interface)
interface ::= ε |Idinternal state link state internal state ::= ε |~Id
link state ::= ε |!n|! |?
token name ::=Id
rate expression ::= algebraic expression
Table 3.Algebraic expressions algebraic expression ::=x ∈ R|variable
| algebraic expressionbinary opalgebraic expression |unary op (algebraic expression)
Simple rules With the signature of A defined in the previous section, the line
'A dimerization' A(x),A(y~p)→ A(x!1),A(y~p!1) @ γ
denotes a dimerization rule between two instances of agent A provided the second is phosphorylated (say that is here the meaning of p) on site y. Note that the bond between both As is denoted by the identifier !1 which uses an arbitrary integer (!0 would denote the same bond). In Kappa, a bond may connect exactly 2 sites so any occurrence of a bond identifier !n has to be paired with exactly one other sibling in the expression. Note also the fact that site z of A is not mentioned in the expression which means that it has no influence on the triggering of this rule. This is the don’t care don’t write convention (DCDW) that plays a key role in resisting combinatorial explosion when writing models.
Adding and deleting agents Sticking with A’s signature, the rule
'budding A' A(z) → A(z!1),A(x!1) @ γ
indicates that an agent A free on site z, no matter what its internal state is, may beget a new copy of A bound to it via site x. Note that in the RHS, agent A’ s interface is not completely described. Following the DCDW convention,
KaSimwill then assume that the sites that are not mentioned are created in the
default state, i.e they appear free of any bond and their internal state (if any) is the first of the list shown in the signature (here state u for y and 0 for z).
Importantly, KaSim respects the longest prefix convention to determine which agent in the RHS stems from an agent in the LHS. In a word, from a rule of the form a1, . . . , an → b1, . . . , bk, with ais and bjs being agents, one computes the biggest indices i ≤ n such that the agents a1, . . . , ai are pairwise consistent with b1, . . . , bi, i.e the ajs and bjs have the same name and the same number of sites.
In which case we say that the for all j ≤ i, aj is preserved by the transition and
for all j > i, aj is deleted by the transition and bj is created by the transition. This convention allows us to write a deletion rule as:
'deleting A' A(x!1),A(z!1) → A(x) @ γ
which will remove the A agent in the mixture that will match the second occur-rence of A in this rule.
Side effects It may happen that the application of a rule has some side effects
on agents that are not mentioned explicitly in the rule. Consider for instance the previous rule:
'deleting A'A(x!1),A(z!1) → A(x) @ γ
The A in the graph that is matched to the second occurrence of A in the LHS will be deleted by the rule. As a consequence all its sites will disappear together with the bonds that were pointing to them. For instance, when applied to the graph
G =A(x!1,y~p,z~2),A(x!2,y~u,z~0!1),C(t!2)
the above rule will result in a new graph G′= A(x!1,y~p,z~2),C(t) where the
site t of C is now free as side effect.
Wildcard symbols for link state ? (for bound or not), ! (for bound to some-one), may also induce side effects when they are not preserved in the RHS of a rule, as in
'Disconnect A' A(x! )→ A(x) @ γ
or
'Force bind A' A(x?)→ A(x!1),C(t!1) @ γ
Rates As said earlier, Kappa rules are equipped with kinetic rate(s). A rate is a
real number, or an algebraic expression evaluated as such, called the individual-based or stochastic rate constant, it is the rate at which the corresponding rule
is applied per instance of the rule. Its dimension is the inverse of a time [T−1].
The stochastic rate is related to the concentration-based rate constant k of the rule of interest by the following relation:
k = γ(A V )(a−1) (1)
where V is the volume where the model is considered, A = 6.022 · 1023 is
Avo-gadro’ s number, a ≥ 0 is the arity of the rule (i.e 2 for a bimolecular rule). In a modeling context, the constant k is typically expressed using molars
M := moles l−1 (or variants thereof such as µM , nM ), and seconds or minutes.
If we choose molars and seconds, k’ s unit is M1−as−1, as follows from the
relation above.
Concentration-based rates are usually favored for measurements and/or de-terministic models, so it is useful to know how to convert them into individual-based ones used by KaSim.
A.2 The Kinetic rates of the BER model
Complex formation rates. The contact map illustrated Fig. 3 is derived from
the papers the references of which are listed in Table 4. Italic fonts denote qual-itative studies. Question marks denote postulated interactions without explicit references.
Table 4.Protein-DNA and protein-XRCC1 interactions. (†) Private conversation with Dr. S. H. Wilson (NIH).
Protein DNA duplex Mismatch AP site Gaped DNA Nicked DNA XRCC1
XRCC1 [1] ? [2] [1] [1] [1] APE1 [3], [4], [5] [5] (†) [6] UDG [7] [7] [7] TDG [8] [8] [8] PNKP [9] [10] POLβ [11] (†) [12] LIG3 [13] ? [14]
Catalytic rates. As pointed out in Section 3, the catalytic rate of an enzyme,
kcat, is usually given in terms of steady state kinetics, i.e following the scheme:
E + S ↔ ES →∗
kcat E + P
But as we pointed out, in the presence of non negligible product inhibition, enzymatic activity is better accounted for using the scheme:
E + S ↔ ES →kchem EP ↔ E + P
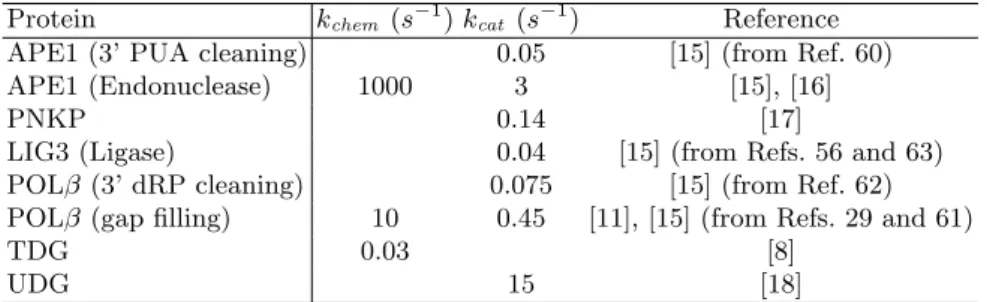
Table 5 gives the catalytic rates and the reference paper(s) that were used in
our model. Both kcat and kchem are given when available.
Table 5.Catalytic rates used in the model. The notation [15] (from Ref X) indicates that the number comes from reference X of paper [15].
Protein kchem(s− 1
) kcat (s− 1
) Reference APE1 (3’ PUA cleaning) 0.05 [15] (from Ref. 60) APE1 (Endonuclease) 1000 3 [15], [16]
PNKP 0.14 [17]
LIG3 (Ligase) 0.04 [15] (from Refs. 56 and 63) POLβ (3’ dRP cleaning) 0.075 [15] (from Ref. 62) POLβ (gap filling) 10 0.45 [11], [15] (from Refs. 29 and 61)
TDG 0.03 [8]
UDG 15 [18]
Default rates. When no quantitative data is known, we used “realistic” default
rates that are randomized at each simulation from the intervals presented in the table below:
process interval rate
general bi-molecular binding [107− 109] M−1s−1
general uni-molecular binding [10 − 104] s−1
A.3 Main rules of the BER model
The rules of the model essentially implement the catalytic activities reported in Fig. 2 as well as the interactions depicted in Fig. 3 using the encoding of DNA shown Fig. 4.
We used the module sanity.ka to detect invariant violation during the elab-oration of the model. We included this file in the model repository because it can be used to test further invariants. The idea is to write rules of the form I → I + Err () where I is the an invariant violation (for instance an invalid DNA polymer) and Err() is an “error” protein. We can then use the causality analysis features of KaSim to have an explanation on how Err() (and hence the invariant) was created.
Table 6. Kappa files of the model. The notation (+x) indicates additional rules not used in simulations.
File name rules # binding and catalytic activity
DG.ka 13 (+7) Glycosylase activities for UDG, TDG, NEIL and OGG1 APE1.ka 11 AP, gaped and nicked DNA; pho’diesterase; endonuclease POLb.ka 17 (+4) gaped and nicked DNA; dRP lyase; polymerase
PNKP.ka 3 gaped DNA; phosphatase
XRCC1.ka29 (+2) XRCC1 (in xrcc dimer.ka), APE1, POLb, PNKP, LIG3 and DNA LIG3.ka 8 gaped and nicked DNA ; ligase
sliding.ka 2 (+1) facilitated diffusion on DNA (approx. in alter sliding.ka) damage.ka 3 deamination and direct single strand break
sanity.ka (+9) sanity check
DNA Glycosylase. For the simulations presented in the present paper, we
focused on the UDG glycosylase the behavior of which is similar to TDG, the other mono-functional glycosylase of the pathway (although rates differ greatly, TDG being having a very slow chemical step, followed by a strong product binding).
The rules pertaining to glycosylases interactions are given in the DG.ka and
sliding.kafiles of the model repository. We describe below the main ones, and we
give their graphical description in Fig. 9.
Glycosylased are assumed to use facilitated diffusion on DNA (i.e. a random walk on DNA) to find mismatches at a rate that exceeds what can be achieved by mere random binding after diffusion in the nucleus (see for instance [15]).
Facilitated diffusion can be simply modeled by a rule that enables the glyco-sylase to ”jump” to the next base 3’ or 5’ to its current position:
’slide 3’ DG(dbd!1, cat), DNA(dg!1,e3!2), DNA(dg , e5!2) -> \
DG(dbd!1, cat), DNA(dg , e3!2), DNA(dg!1,e5!2) @ ’DG_DNA_slide’ ’slide 5’ DG(dbd!1, cat), DNA(dg , e3!2), DNA(dg!1,e5!2) -> \
DNA e3 lig dg DG dbd cat DNA e5 lig dg DNA e3 lig dg DG dbd cat DNA e5 lig dg DNA e3 dg DG dbd cat e5 lig lig base U DNA e3 dg DG dbd cat e5 lig lig base U DNA e3 dg DG dbd cat e5 lig lig base U DNA e3 dg DG dbd cat e5 lig lig base AP
Fig. 9.Main DNA Glycosylase rules.
Note that sliding is no longer possible when the cat port (representing the catalytic pocket of the DG) is bound (to a mismatch), as a consequence of the rule:
’UDG anchors DNA mismatch’ \
DNA(e3~lig?, base~U?, dg!1, e5~lig?), DG(dbd!1, cat, type~U) -> \ DNA(e3~lig?, base~U?, dg!1, e5~lig?), DG(dbd, cat!1, type~U) \ @ ’DG_DNA_anchors’
Once anchored on the mismatch, the DG flip the faulty base into its catalytic pocket for excision:
’UDG mismatch excision’ \
DG(cat!1, type~U), DNA(e3~lig!_, dg!1, base~U?, e5~lig!_) -> \ DG(cat!1, type~U), DNA(e3~lig!_, dg!1, base~AP?, e5~lig!_ ) \ @ ’UDG_excision’
An important point of the above rule is that the DNA node is still ligated to the 3’ and 5’ neighboring base pairs after the nucleotide excision. This is a key difference with bi-functional glycosylases such as OGG that perform both excision and endonuclease in the same step (not included in simulations):
’OGG mismatch excision’ \
DG(dbd!1, cat, type~OGG), DNA(e5~lig!0), \
DNA(e3~lig!0,dg!1,base~oxoG?,e5~lig!2),DNA(e3~lig!2) -> \ DG(dbd, cat!1, type~OGG), DNA(e5~PUA!0), \
DNA(e3~NA!0, dg!1,base~AP?, e5~NA!2 ),DNA(e3~P!2) \ @ ’OGG_excision’
Notice also that in both cases the DG remains bound to its product.
APE1 endonuclease. We present here the main rule pertaining to APE1
APE1
DNA DNA DNA e3 e5 e3
base
e5 lig lig lig
AP pol APE1 dbd DNA DNA DNA e3 e5 e3 base e5 OH NA NA AP pol dbd lig dRP
Fig. 10.APE1’s endonuclease.
Whenever APE1 is bound to DNA and encounters an AP site, it may incise DNA 5’ of the damage. The resulting gaped site has a 3’ OH and a 5’dRP residues:
’APE1 5-endonuclease’ \
APE1(dbd!1), DNA(e3~lig!0), \
DNA(e5~lig!0, base~AP?, ape!1, e3~lig!2), DNA(e5~lig!2) -> \ APE1(dbd), DNA(e3~OH !0), \
DNA(e5~NA!0, base~AP?, ape, e3~NA!2), DNA(e5~dRP!2) \ @ ’APE1_incision’
POLβ gap filling. The main rules of POLβ concern its gap filling activity.
There are actually four variants of the rule presented below (see Fig. 11 for the graphical representation), one for each different nucleotide insertion.
DNA DNA DNA e3 e5 e3 base base OH NA NA AP pol T POLb dbd DNA DNA DNA e3 e5 e3 base base lig lig OH A pol T POLb dbd
Fig. 11.Polymerase step: insertion of nucleotide with an adenine base.
’POLb polymerase A on gap’ \ POLb(dbd!1), DNA(e3~OH !0), \
POLb(dbd ), DNA(e3~lig!0), \
DNA(e5~lig!0, pol , base~A !2, e3~OH!_), DNA(base~T!2) \ @ ’POLb_polymerase’
On uni-molecular binding rules. A fundamental assumption of the model
is that uni-molecular binding events are fast. The underlying hypothesis is that steric constraints favor complex formation. This enables XRCC1 to reinforce
the product inhibition following the scheme presented Fig. 12 where kunary is
the uni-molecular binding rate. With a relatively weak affinity with enzyme A,
DNA xrc XRCC1 dbd s a xrc A dbd DNA xrc XRCC1 dbd s a xrc A dbd DNA xrc XRCC1 dbd s a xrc A dbd substrate substrate product DNA xrc XRCC1 dbd s a xrc A dbd product DNA xrc XRCC1 dbd s a xrc A dbd substrate k_unary k_unary k_unary k_off[ns] k_off[s] k_off[ns] k_cat
Fig. 12.XRCC1 stabilization (kunary>> koff[ns] > koff[s]).
and an equally moderate affinity with DNA (both have a strong koff[ns] - for
non specific), XRCC1 is able to stabilize efficiently A on both its substrate and product, although A has little affinity for its product (koff[ns] > koff[s]).
A.4 Simulation efficiency
The efficiency of an in silico experiment with respect to a wet lab experiment is usually measured in terms of time and money consumption. It is interesting to check, for a given model, how long it takes (in CPU seconds) to simulate one (biological world) second of the real system. Fig. 13 shows the evolution of the efficiency of one simulation running with the parameters specified in the Methods section.
A good measure of the efficiency of a simulation at time t can be given by eff (t) def= dCPUtime(t)
dt . As can be seen in Fig. 13, eff (t) has three distinguished
phases during which it becomes quasi-linear. The three phases correspond to the pre-steady state (eff (t) ∼ 15 CPU seconds for 1 bio second) and steady
0 1000 2000 3000 4000 5000 6000 7000 0 200 400 600 800 1000 CPU seconds
Bio. time (sec.)
Simulation efficiency
14.71
7.3
1.1
Steady state BER
Fig. 13. A global picture of the CPU cost of a BER simulation. The derivative at distinguished points are given (pre-steady state, steady state and post BER).
state of BER (eff (t) ∼ 7 CPU seconds for 1 bio second) and the phase at which no more repair is conducted (eff (t) ∼ 1 CPU seconds for 1 bio second).
Importantly in silico BER efficiency varies quite a lot as different simulations are run with randomized dissociation constants, though they still exhibit the same distinct phases (data not shown).
References listed in Supp. Data A.2
1. Rajam S. Mani et al., Biophysical characterization of Human XRCC1 and its binding to damaged and undamaged DNA. Biochemistry, 43:16505-14, 2004. 2. Zhanna K. Nazarkina et al., XRCC1 interactions with base excision repair DNA
intermediates. DNA repair, 5:254-264, 2007.
3. David M. Wilson III et al., Abasic site binding by the human apurinic endonu-clease, Ape, and determination of the DNA contact sites. Nucleic Acids Research, 25(5):933-39, 1997.
4. Robyn L. Maher and Linda B. Bloom, Pre-steady-state Kinetic Characterization of the AP Endonuclease Activity of Human AP Endonuclease. J. Biol. Chem., 282(42):30577, 2007.
5. Phyllis R. Strauss et al., Substrate Binding by Human Apurinic/Apyrimidinic En-donuclease Indicates a Briggs-Haldane Mechanism. J. Biol. Chem., 272(2):1302-07, 1997.
6. Antonio E. Vidal et al., XRCC1 coordinates the initial and late stages of DNA aba-sic site repair through protein-protein interactions. EMBO, 20(22):6530-39, 2001. 7. Sudip S. Parikh et al., Base excision repair initiation revealed by crystal
struc-tures and binding kinetics of human uracil-DNA glycosylase with DNA. EMBO, 17(17):5214-26, 1998.
8. Michael T. Morgan et al., Stochiometry and affinity for the thymine DNA glycosy-lase binding to specific and non specific DNA. Nucleic Acids Research, 39(6):2319-29, 2011.
9. Michael Weinfeld et al., Tidying up loose ends: the role of polynucleotide ki-nase/phosphatase in DNA strand break repair. Trends Biochem. Sci., 36(5):262-271, 2011.
10. Ammar A. E. Ali et al., Specific recognition of a multiply phosphorylated motif in the DNA repair scaffold XRCC1 by the FHA domain of human PNK. Nucleic Acids Research, 37(5):1701-12, 2009.
11. Brian J. Vande Berg et al., DNA Structure and Aspartate 276 Influence Nucleotide Binding to Human DNA Polymerase β. J. Biol. Chem., 276(5):3408-16, 2001. 12. Matthew J. Cuneo and Robert E. London, Oxidation state of the XRCC1
N-terminal domain regulates DNA polymerase β binding affinity. PNAS, 107(15):6805-10, 2010.
13. John B. Leppard et al., Physical and Functional Interaction between DNA Ligase III and Poly(ADP-Ribose) Polymerase 1 in DNA Single-Strand Break Repair. Mol. Cell. Biol., 23(16):5919-27, 2003.
14. Keith W. Caldecott et al., An Interaction between the mammalian DNA repair protein XRCC1 and DNA ligase III. Mol. Cell. Biol., 14(1):68-76, 1994.
15. Bahrad A. Sokhansanj et al., A quantitative model of human DNA base excision repair. I. Mechanistic insights. Nucleic Acids Research, 20(8):1817-25, 2002. 16. Daniel C. Carey and Phyllis R. Strauss, Human Apurinic/Apyrimidic Endonuclease
is processive. Biochem., 38:16553-60, 1999.
17. U. Das and S. Shuman, Mechanism of RNA 2’,3’-cyclic phosphate end healing by T4 polynucleotide kinase–phosphatase. Nucleic Acids Research, 41(1):355-65, 2012.
18. Yu Lin Jiang and James T. Stivers, Reconstructing the Substrate for Uracil DNA Glycosylase: Tracking the Transmission of Binding Energy in Catalysis. Biochem., 40:7710-19, 2001.