ENVIRONMENTAL BIOTECHNOLOGY
Performance and microbial community composition
dynamics of aerobic granular sludge from sequencing batch
bubble column reactors operated at 20 °C, 30 °C, and 35 °C
Sirous Ebrahimi&Sébastien Gabus&
Emmanuelle Rohrbach-Brandt&Maryam Hosseini&
Pierre Rossi&Julien Maillard&Christof Holliger
Received: 4 March 2010 / Revised: 12 April 2010 / Accepted: 13 April 2010 / Published online: 12 May 2010 # Springer-Verlag 2010
Abstract Two bubble column sequencing batch reactors fed with an artificial wastewater were operated at 20 °C, 30 °C, and 35 °C. In a first stage, stable granules were obtained at 20 °C, whereas fluffy structures were observed at 30 °C. Molecular analysis revealed high abundance of the operation-al taxonomic unit 208 (OTU 208) affiliating with filamentous bacteria Leptothrix spp. at 30 °C, an OTU much less abundant at 20 °C. The granular sludge obtained at 20 °C was used for the second stage during which one reactor was maintained at 20 °C and the second operated at 30 °C and
35 °C after prior gradual increase of temperature. Aerobic granular sludge with similar physical properties developed in both reactors but it had different nutrient elimination performances and microbial communities. At 20 °C, acetate was consumed during anaerobic feeding, and biological phosphorous removal was observed when Rhodocyclaceae-affiliating OTU 214 was present. At 30 °C and 35 °C, acetate was mainly consumed during aeration and phosphorous removal was insignificant. OTU 214 was almost absent but the Gammaproteobacteria-affiliating OTU 239 was more abundant than at 20 °C. Aerobic granular sludge at all temperatures contained abundantly the OTUs 224 and 289 affiliating with Sphingomonadaceae indicating that this bacterial family played an important role in maintaining stable granular structures.
Keywords Wastewater treatment . Nutrient removal . Biological dephosphatation . Aerobic granular sludge
Introduction
Aerobic granular sludge-based reactors represent an attrac-tive alternaattrac-tive to conventional activated sludge systems due to their small footprint and low excess sludge
production (de Bruin et al. 2004). The sludge developed
in such systems has high biomass concentration, good settling properties, high chemical oxygen demand (COD) removal efficiency, and high phosphorus removal capacity
(de Kreuk et al.2005a). In addition, and depending on bulk
oxygen concentration and granule size, simultaneous nitrification–denitrification can occur in granules (Beun
et al.2001; Mosquera-Corral et al.2005). Aerobic granular
sludge has mainly been developed in sequencing batch
Electronic supplementary material The online version of this article (doi:10.1007/s00253-010-2621-4) contains supplementary material, which is available to authorized users.
S. Ebrahimi
:
S. Gabus:
E. Rohrbach-Brandt:
M. Hosseini:
P. Rossi:
J. Maillard:
C. HolligerEcole Polytechnique Fédérale de Lausanne (EPFL), Laboratory for Environmental Biotechnology, Lausanne, Switzerland
C. Holliger (*) EPFL ENAC IIE LBE, Station 6,
1015 Lausanne, Switzerland e-mail: [email protected] Present Address:
S. Ebrahimi
:
M. HosseiniDepartment of Chemical Engineering, Sahand University of Technology, Tabriz, Iran
Present Address: P. Rossi
EPFL ENAC IIE CEL, Station 2,
reactor (SBR) systems, some using airlift or bubble column reactors. Several laboratory scale studies have been carried out to identify the most important factors influencing both the aerobic granular sludge formation and the catalyzed conversion processes. The state of the art of this novel aerobic wastewater treatment technology has been
pre-sented in different recent reviews (Liu and Tay 2004; de
Kreuk et al.2007).
The presence of slow-growing microorganisms such as polyphosphate and glycogen accumulating organisms (PAO and GAO, respectively) is apparently a key factor in order to get dense and stable aerobic granules (de Kreuk and van
Loosdrecht2004). These organisms have been selected in
an aerobic granular sludge SBR by application of a feast/ famine regime. Characterization of these aerobic granules using fluorescence in situ hybridization techniques has shown the presence of PAO and nitrifiers which was in agreement with the microbial processes occurring in the
reactors (de Kreuk et al. 2005a; Wilen et al. 2008). One
study on granules of a reactor treating a wastewater containing tert-butyl alcohol showed a stable microbial community composition during a period of 4 weeks and showed the presence of mainly Proteobacteria (Tay et al.
2005). The characterization of the microbial community of
highly filamentous granules using DGGE showed that the biomass was dominated by filamentous bacteria, Zoogloea
ramigera, and fungi (Williams and Reyes2006).
In traditional enhanced biological phosphorus removal (EBPR) systems, numerous studies have been carried out to investigate the microbial communities of the activated sludge. Polyphosphate accumulating Rhodocyclus-affiliated bacteria that belong to Betaproteobacteria have been identified as major population responsible for biological
phosphorous removal (Hesselmann et al. 1999; Crocetti
et al.2000). In the EBPR process, PAO can be outcompeted
by GAO leading to deterioration of the performance of the
system (Filipe et al.2001; Saunders et al.2003). Members
of the GAO guild identified in activated sludge belong to Alpha- as well as Gammaproteobacteria (Crocetti et al.
2002; Meyer et al. 2006). Temperature has been shown to
be a key factor influencing PAO–GAO competition (Whang
and Park2002; Panswad et al.2003; Oehmen et al. 2004;
Whang and Park 2006; Lopez-Vazquez et al. 2007). In
general, it can be concluded from these studies that activities of the biological phosphorus removal process deteriorates at temperatures higher than 20 °C and GAO become the dominant microorganisms. As temperature increases to 35 °C, both PAO and GAO disappear and ordinary heterotrophic organisms become predominant
(Panswad et al.2003).
In most studies on aerobic granular sludge, SBRs (GS-SBR) have been operated at ambient temperature, e.g., 20–25 °C
(Morgenroth et al.1997; de Kreuk and van Loosdrecht2004;
Whang and Park 2006) or lower (de Kreuk et al. 2005b).
Thermophilic granular sludge has also been produced at
temperatures as high as 55 °C (Zitomer et al. 2007).
Regarding the proposed importance of both PAO and GAO in the formation, stability, and density of aerobic granules, investigation of the temperature effect (from 20 °C to 35 °C) was the main purpose of the present study. The performance and stability of the granular sludge obtained at different temperatures was investigated and compared with the structure and composition of the microbial communities present in the different granules.
Materials and methods Reactor setup and operation
The reactor setup and operation was very similar to the one
used by de Kreuk and van Loosdrecht (2004). Two
double-walled bubble column sequencing batch reactors (BC-SBR) with an internal diameter of 6.15 cm were used (working volume 2.6 L). The two BC-SBRs were inoculated with 300 mL of activated sludge from the Thunersee wastewater treatment plant (Thun, Switzerland), a plant that removes N and P biologically. Air was introduced via a fine bubble
aerator at the bottom of the reactor at a rate of 4 L min−1
and there was no oxygen control. During the first-stage experiment, temperature was controlled at 30 °C in reactor A and at 20 °C in reactor B. In the second-stage experiment, temperature of reactor B was maintained at 20 °C. Reactor A was operated first at 25 °C during 12 days, then for 9 days at 28 °C, for 48 days at 30 °C, and finally for 34 days at 35 °C. The pH was measured online and maintained at 7.0±0.2 by dosing 1 M NaOH or 1 M HCl. Hydraulic retention time and substrate load were 6 h
and 1.55 kg COD m−3 day−1, respectively. The reactors
were operated in successive cycles of 3 h divided in 60 min slow feeding from the bottom of the reactor under anaerobic conditions, 110 min aeration, 5 min settling (to keep only
particles settling faster than 6 m h−1in the reactor), and 5 min
effluent discharge. The reactors were fed with the same
medium as the one used by de Kreuk et al. (2005a). It was
prepared as two stock solutions that were mixed with tap water prior to feeding. Solution A contained sodium acetate
(63 mM), MgSO4·7H2O (3.6 mM) and KCl (4.8 mM).
Solution B contained NH4Cl (35.4 mM), K2HPO4(4.2 mM),
KH2PO4(2.1 mM), and 10 mL L−1trace element solution.
The trace element stock solution contained: EDTA
342.2 mmol L−1, ZnSO4·7H2O 15.3 mmol L−1, CaCl2·2H2O
111.3 mmol L−1, MnCl2·4H2O 51.1 mmol L−1, FeSO4·7H2O
35.9 mmol L−1, Na2Mo7O24·2H2O 2.7 mmol L−1,
CuSO4·5H2O 12.6 mmol L−1, and CoCl2·6H2O 13.5 mmol
reactor by peristaltic pumps together with 1,050 mL of tap water.
Granules characterization and chemical analysis
Morphology of the granules, dry weight and ash content of the granules, total organic carbon, COD, acetate, and biomass concentration in the bulk liquid were measured
as described by Beun et al. (2002). Characterization of the
morphology of the granules (particle diameter, aspect ratio, and shape factor) was restricted to particles with a surface
>0.05 mm2. Density of the biomass was determined as
described by Beun et al. (2002). NH4+, NO2− and NO3−,
and PO34− concentrations in the bulk liquid were
deter-mined spectrophotometrically with standard test kits (MERCK, Ammonium test 14752, Nitrate test 09713, Nitrite test 14776, Phosphate test 14848). The sludge
volume index (SVI8) was determined by reading the height
of the settled bed in the reactor after 8 min settling and calculated from the settled bed volume and the dry weight in the reactor. Conversion rates and removal efficiencies were calculated as described by Mosquera-Corral et al.
(2005). Conversion rates were averaged from at least two
cycle measurements, and removal efficiencies were deter-mined as an average from a stable period of at least 3 weeks in each experimental stage. The stage during which both nutrient consumption and sludge bed height were stable was considered as steady state. To determine P content of granules, sludge sample were digested with a standard kit using potassium persulfate (MERCK, crack test 1.14687),
and PO34− concentration of the supernatant recovered by
high speed centrifugation was determined. Dry weight concentration in the effluent was measured after centrifu-gation of the entire effluent of the reactor and drying the pellet at 105 °C for 24 h.
Sludge sample collection
Bulk solution reactor samples of a volume of 15 mL were collected at least once a week by a 50-mL syringe at two different heights of the bubble column. Granules were then disaggregated using a pestle and mortar. The samples were then centrifuged for 20 min at 3,500×g. Supernatant was removed and pellet stored at minus 20 °C.
DNA extraction and PCR amplification
Total community DNA was extracted from about 500 µL of pellet material using the MoBio Power soil extraction kit (MoBio, Solana beach, CA, USA). Amplification of the 16S rRNA genes was performed with universal primers for the domain bacteria: 8-F (5′-GAGTTTGATCMTGGCT
CAG-3′) and 518R (5′-ATTACCGCGGCTGCTGG-3′) for
both T-RFLP and clone library. PCR was carried out using 5 ng of DNA in a final volume of 50 µl. The cycle profiles used were initial denaturation for 4 min and 30 s at 95 °C, denaturation for 30 s at 95 °C, primer annealing at 56 °C for 45 s, and elongation for 1 min at 72 °C; the number of cycles was 25. Triplicate reactions were pooled and DNA concentrated and cleaned using a Microcon-PCR purifica-tion kit (Millipore, Billerica, MA, USA). For each sample, DNA concentration was adjusted to 100 ng final concen-tration prior to further use.
Cloning of 16S rRNA genes
Clone libraries of 16S rRNA gene pools were obtained by cloning purified PCR products into the pGEM-T Easy vector system (Promega). Transformants were selected with standard blue–white screening on LB plates according to the manu-facturer’s instructions. Plasmid DNA was extracted and purified with the E.Z.N.A. Plasmid Miniprep Kit I (PeqLab). The purified plasmids were sequenced using primer T7 and the ABI V3.1 BigDye terminator cycle sequencing ready reaction kit (Applied Biosystems) on an ABI3100 automated capillary DNA sequencer. Sequence analysis was performed with the DNAStar package and compared to the GenBank
database using BLAST (Maidak et al.1996; Altschul et al.
1997). Potential chimeric sequences as detected by the RDP
Chimera Check program were discarded and sequences were classified using other tools available on the RDP web site (http://rdp.cme.msu.edu/index.jsp).
T-RFLP analysis
PCR products were generated with a combination of HEX-labeled 8F and unlabelled 518R primers according to the above mentioned conditions. Purified PCR products from each DNA sample were quantified (NanoDrop, ND-1000 Spectrophotometer) and aliquots of 50 ng were digested with 1 unit of the restriction enzyme HaeIII (Promega) at
37 °C for 4 h. Digested samples (1 μL) was mixed with
8.5 μL of HiDi formamid (ABI) and 0.5 μL of
GS500-ROX standard (ABI). Samples were denatured by heating to 95 °C for 2 min followed by cooling on ice for 5 min. The denatured samples were loaded onto an ABI3100 capillary DNA sequencer equipped with 50 cm long capillaries and POP 6 electrophoresis matrix according to the manufacturer’s instructions. The resulting datasets were analyzed with Genescan (ABI). Each digested sample was run in triplicate, and the resulting composite profiles (percentage of contribution of all peak areas) were aligned
semi-manually using Treeflap (http://www.sci.monash.edu.
au/wsc/staff/walsh/treeflap.xls). Terminal restriction frag-ments (T-RFs) among replicates that differed by less than 0.5 bp were considered identical and assigned to the
averaged size. A baseline was set to nine times the background noise (ten relative fluorescent units in peak height), and all T-RFs below this limit were discarded. Likewise, all T-RFs showing a relative contribution (in terms of peak area) smaller than 0.3% (relative to the whole profile) were discarded. Numerical treatment and analysis of the data were
carried out with R (http://www.r-project.org/index.html) and
the Vegan library. The Ruzicka dissimilarity is defined on the basis of the Jaccard similarity (Legendre and Legendre
1998), which does not consider the double absence of a band
as a resemblance between two profiles. Ranging from 0 (identical profiles) to 1 (very different profiles with no band in common), it takes into account the relative intensity of all T-RFs within the whole fingerprinting patterns. All clone sequences shown herein have been deposited in the GenBank database under accession numbers GU727739 to GU727811.
Results
In this study, the effect of temperature on granule formation, nutrient removal performances, and microbial community composition was studied in two stages. The first stage was stopped after 67 days of reactor operation due to the low quality of the aerobic granular sludge obtained at 30 °C. The second stage was started with the granular sludge from the first stage BC-SBR operated at 20 °C. Higher mesophilic temperatures were reached by a stepwise increase of temperature giving the microbial
community of the 20 °C–sludge time to adapt to higher
temperatures. In the following, the granular sludge proper-ties, the nutrient removal performances, and the microbial community structures are described for the two stages and the different operation temperatures.
Granular sludge properties First-stage experiment
Two BC-SBRs were started under identical operation conditions except temperature, one was operated at 30 °C (reactor A), the other at 20 °C (reactor B). The settling time was fixed at 15 min for the first 2 days allowing particles
with a settling velocity >2 m h−1 to be retained in the
reactor. It was reduced to 10 min for days 3–5, to 7 min for
days 6–7, to 5 min for days 8–13, and finally to 3 min from
day 14 onward. The settling time was again increased to 5 min from day 38 onward due to too large loss of biomass through the effluent.
First granules were observed already after a few days of operation and 3 weeks after start-up of reactor B, an important amount of granules could be observed. Biomass was a mixture
of smooth and fluffy granules. On day 36, dry weight in the
reactor already reached 3 gVSSL−1and fluffy particles totally
disappeared. After 64 days of operation, dry weight in the
reactor was 4 gVSS L−1and a SVI8 of 85 mL gTSS−1 was
measured. The density of the granules was about 47 gVSS
Lbiomass−1. The average diameter of the granules was 1.3 mm, and the color was slightly orange.
One week after start-up of Reactor A, a mixture of smooth and fluffy granules was also observed. The fluffy granules led to partial washout of the biomass, and the reactor had to be cleaned regularly to avoid excessive bacterial wall growth. Fluffy granules progressively dis-appeared from the system and the biomass was composed of a mixture of smooth granules and irregular floccular structures. The color of the granules was white. From day 8 to day 43, the dry weight increased slowly from 0.2 to
0.75 gVSSL−1but decreased again to reach 0.42 gVSSL−1on
day 64. In the same time period from days 43 to 64, the
SVI8decreased from 365 to 153 mL gTSS−1, the density of
the granules increased from 13.2 to 42.6 gVSS Lbiomass−1,
and the solid retention time increased from 2.5 to 5 days. Despite the improved sludge properties and the observation of a complete acetate removal, the amount of biomass present in the reactor was dramatically low. Therefore, the operation of both reactors was stopped on day 67.
Second-stage experiment
The second-stage experiment was performed using the granules developed in reactor B operated at 20 °C. The sludge bed was divided in two and used as seed for the start-up of the second stage. Reactor B was again operated at 20 °C whereas reactor A was set at 25 °C as initial temperature. After 12 days of operation, the temperature was increased to 28 °C for 9 days, to 30 °C for 48 days, and finally, to 35 °C for 34 days.
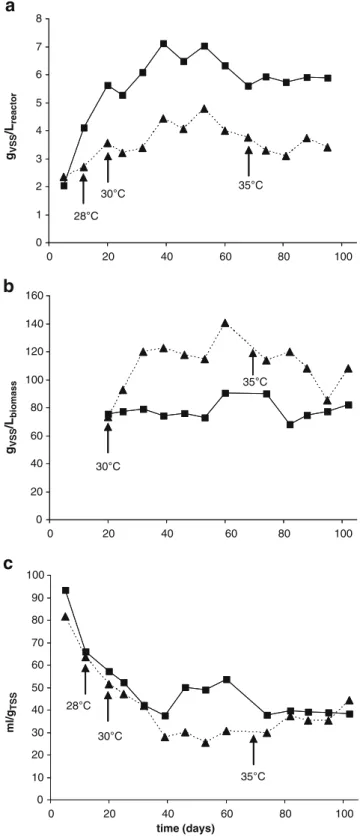
After 40 days of operation at 20 °C in reactor B, the granular sludge bed reached a steady state volume of
0.87 L, and the sludge had a SVI8of about 38 mL gTSS−1
and a density of 75 gVSS Lbiomass−1 (Fig. 1). In reactor A
with stepwise increase of temperature, steady state was
reached in about the same time period of 40 days. The SVI8
of 27 mL gTSS−1at 30 °C was significantly lower than the
one observed at 20 °C but increased again at 35 °C to
35 mL gTSS−1.The granular sludge bed was much smaller at
higher temperatures with a volume 0.35 L. However, the density of the granules was higher at 30 °C and 35 °C than
at 20 °C (120 gVSS Lbiomass−1 and 108 gVSS Lbiomass−1,
respectively). Suspended solid concentration at 30 °C was about half of the value observed at 20 °C (4.8 versus
8.6 gTSSL−1) and the sludge had a much lower ash content
of 7% compared to 32% at 20 °C. At 35 °C, suspended
solid concentration slightly decreased to 3.6 gVSSL−1, and
The morphology properties of the granules were only slightly different at different temperatures. The average diameter of the granules was 0.92 mm at 20 °C, while it decreased to 0.76 and 0.74 mm at 30 °C and 35 °C, respectively. A similar particle size distribution was observed for the three different temperatures. In all cases, the measured diameter of 99% of the granules was below 3 mm. Approximately 80% of the granules were rather small with a diameter <1 mm. At 35 °C, part of the biomass was constituted of small well-settling particles which were not taken into account in this calculation due to their small size (<0.1 mm).
At 20 °C, the estimated sludge residence time was fluctuating between 25 and 50 days, whereas at 30 °C and 35 °C, it was quite constant with values of 20 and 15 days, respectively. The measured effluent biomass concentration
was in the range of 0.07 to 0.14 gTSSL−1, regardless of the
operation temperature.
Nutrient removal performances First-stage experiment
Based on influent and effluent measurements, COD was always completely removed from the artificial wastewater. No significant nitrification and almost no phosphate removal were observed. Cycle profile measurements showed that acetate was consumed only to a small extent (18–25%) during the anaerobic feeding period in both reactors. No phosphorous release was measured during this period either. Acetate was rapidly consumed during the first 20 min of the aeration period, and during the entire aerobic phase, some ammonium and phosphate were removed, probably due to assimilation into biomass.
Second-stage experiment
Similar to the first-stage experiment, COD was present as acetate was completely removed during a cycle. However, at 20 °C, the consumption during the anaerobic and aerobic periods started to change after approximately 3 weeks of operation with acetate being consumed already during the anaerobic feeding period. At the same time, phosphate was released. During the aerobic cycle period the remaining acetate was consumed and overall significant amounts of phosphate were removed. This biological phosphorous removal steadily increased until weeks 6 to 7 when it leveled off and remained constant with an average
phosphate removal rate of 63% (Table 1). From this time
point on nearly all acetate was consumed during the
anaerobic period (Fig.2a). The ratio between the moles of
phosphorous released, and the moles of carbon taken up
were of 0.31 P-mol C-mol−1. Interestingly, the ash content
0 20 40 60 80 100 0 20 80 28°C 30°C 0 1 2 3 4 5 6 7 8 0 20 40 60 80 100 120 140 160 0 20 40 60 80 100 0 10 20 30 40 50 60 70 80 90 100 40 60 100 30°C 35°C 35°C 28°C 30°C 35°C time (days) ml/g TSS gVSS /L reactor gVSS /Lbiomass
b
c
a
Fig. 1 Properties of the granules of the reactor operated at 20 °C (filled square with connecting line) and the stepwise temperature increase reactor (filled triangle with dashed connecting line) during the secondary stage experiment: dry weight (a), density of the granules (b), and sludge volume index SVI8(c)
of the sludge started to increase from week 3 onward and reached rather high values of 35% of TSS after more than 3 months of operation. Surprisingly and despite operating the reactor for more than 160 days, no nitrification was observed and the little ammonium removed was probably
only due to assimilation by biomass formation (Fig.2b).
Reactor A that was first operated at 25 °C for 12 days followed by an operation at 28 °C for 9 days before being operated at 30 °C showed quite different nutrient removal performances. Acetate was consumed at most for about 60% during the anaerobic period, the remaining acetate being quickly consumed during the first 15 min of the
aeration period (Fig. 2c). Phosphorus removal was low
(8%; Fig.2c) and the ash content of the sludge remained
low at 6–7% in average. Nitrification on the contrary started to occur after 3 weeks of operation and reached up to 85%
under quasi-steady state conditions (Table 1). The major
product was nitrite but also some nitrate was produced
(Fig.2d).
At 35 °C nitrification remained similar to 30 °C (Table1
and Fig. 2f). About 25% of the acetate was consumed
during the anaerobic phase, and phosphate removal was
nearly absent (Fig.2e). Similar to the operation temperature
of 30 °C, the remaining acetate was quickly consumed during the first 15 min of the aeration period.
Evolution of microbial communities First-stage experiment
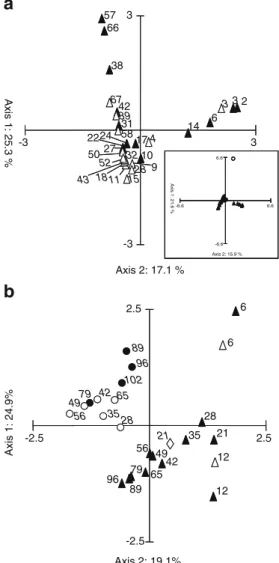
The T-RFLP profile of the microbial community after 2 days of the start-up of the reactor was already dramatically different from the inoculation sludge
(Fig.3a, insert). The evolution of the microbial community
structure was very similar for both reactor operation temperatures until day 28. After the first 4 weeks of operation, the microbial community structure of reactor B continued to evolve whereas the one of reactor A remained rather stable
(Fig.3a). At 20 °C, the Shannon diversity index increased
from 0.42 on day 2 (2.05 for inoculum sludge) to 1.92 on day 66.
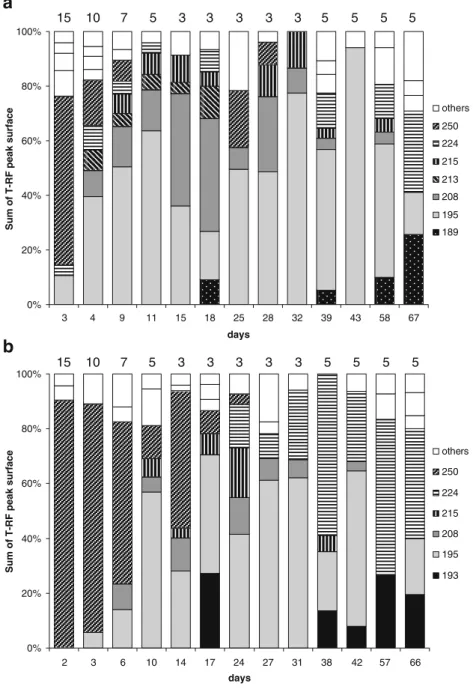
In order to get indications on the predominant opera-tional taxonomic units (OTU) present, the OTUs whose peaks exceeded 3% of the total T-RF peak surface were
analyzed in more detail (Fig.4). These OTUs accounted for
92.0±4.9% and 90.3±5.1% of the total T-RF peak area in the case of the 30 °C and 20 °C reactor, respectively. After normalization to 100%, seven OTUs accounted for 83.8± 8.1% in the 30 °C reactor and six OTUs for 85.8±7.1% in the 20 °C reactor, respectively. Five of these predominant OTUs were found in both reactors and their T-RFs had a length of 195, 208, 215, 224, and 250 nucleotides. The
unspecified OTUs summarized under “others” (Fig. 4)
include OTUs that were only observed with an abundance of >3% up to three times randomly during reactor operation.
OTU 250 was predominant short after reactor start-up, stayed predominant at 20 °C during the first 2 weeks but lost predominance rapidly at 30 °C. OTU 195 became predominant in both reactors with a certain time lag at 20 °C. Abundance of OTU 195 fluctuated during reactor operation but this OTU accounted in many samples for at least 50% of
the total peak area. OTU 208 was quite abundant (8.2–35.6%)
during the first 4 weeks at 30 °C but was much less abundant at 20 °C (5.4–12.1%). OTU 224 on the other hand became abundant from day 24 on at 20 °C and accounted for 21.2% to 48.0% of total peak area during the last 4 weeks of reactor operation and was much less abundant at 30 °C.
Second-stage experiment
The microbial communities evolved rather similar in reactor B operated at 20 °C and reactor A operated first at 25 °C
(Fig. 3b). However, when increasing the temperature to
28 °C for a short period (9 days) and in the following to 30 °C for a longer period (48 days), the composition of reactor A microbial community shifted away from reactor B samples expressing clearly different community structures at higher temperatures. After an additional increase to 35 °C, the rather stable community structure obtained at 30 °C evolved again. The Ruzicka distance for samples collected at the same day but at different temperatures was 0.5 between samples at 20 °C and 28 °C, 0.7 between samples at 20 °C and 30 °C, and 0.8 between samples collected at 20 °C and 35 °C, respectively, confirming that the dissimilarities between the different microbial communities increased with increasing temperature.
The Shannon diversity index was approximately 1.8 for all samples of reactor B as well as for the samples of reactor A with an operation temperature of up to 30 °C. The diversity started to decrease after temperature increase to 35 °C with a final diversity index of only about 1.0. These trends were also confirmed with the Ruzicka and Jaccard distances calculated for all samples in relation to their
Table 1 Phosphorus and nitrogen removal efficiencies during the second-stage experiment
20 °C 30 °C 35 °C
P-removal efficiency (%) 63 8 0
Nitrification efficiency (%) 0 85 88
Nitrogen removed per cycle (%) NA 39 20 The values presented are the average of several analyses performed at different weeks
preceding sample. After initially high values around 0.8, they dropped and fluctuated between 0.2 and 0.4 at 20 °C as well as up to 30 °C. They increased rapidly to 0.65 after temperature increased to 35 °C.
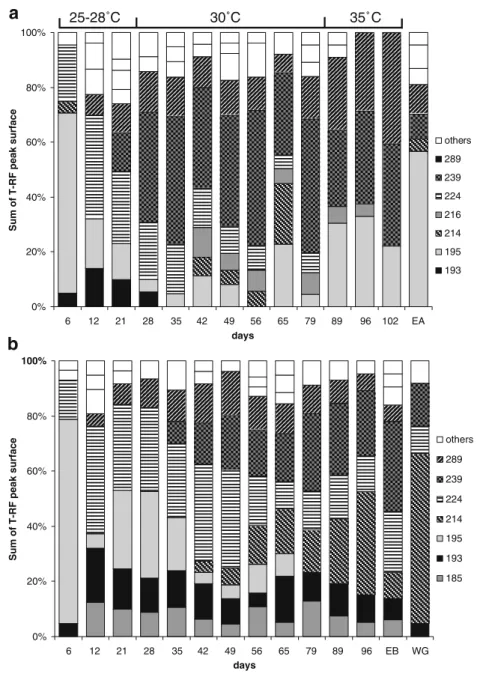
The predominant OTUs were also analyzed in the
second-stage experiment (Fig. 5). These OTUs accounted
for 71.9±5.7% and 76.0±4.1% of the total T-RF peak surface in the case of increasing operation temperature reactor and the 20 °C reactor, respectively. After normal-ization to 100%, seven OTUs accounted for 85.4±9.5% and
90.3±4.3% in the two reactors, respectively. Six of these seven OTUs with a T-RF length of 193, 195, 214, 224, 239, and 289 nucleotides were found in both reactors. OTU 216 was only observed in reactor A, whereas OTU 185 was exclusively found in the communities of reactor B. The latter started to be present in reactor B after approximately 2 weeks of operation, accounted for 6.6±2.3% of the total peak area, and was never observed in reactor A. OTU 193 was present in both reactors, accounted for 9.5±3.2% of total peak area of reactor B community and disappeared
Fig. 2 Typical concentration patterns of acetate (filled square), PO43−-P
(filled triangles), NH4+-N (filled circle), NO3−-N (filled diamond), and
NO2−-N (inverted filled triangle) in millimolar in a cycle during the
second-stage experiment. a and b 20 °C. c and d 30 °C. e and f 35 °C.
The open symbols on the y-axis indicate the concentrations after anaerobic feeding at the start of the aeration period if no process would have influenced these compounds during feeding
rapidly in reactor A when operated at 30 °C. OTU 195 was predominant short after start-up in both reactors (approxi-mately 50% of total peak area). It decreased in reactor B and was absent after day 65. In reactor A, this OTU was almost always present and became predominant again at 35 °C (approximately 20% of total peak area).
OTU 214 appeared in both reactors after 6 weeks of operation (day 42), gained importance in reactor B finally accounting for 28% of the total peak area, and disappeared
in reactor A after increase of the temperature from 30 °C to 35 °C. OTU 224 accounted in reactor B for 18.9±8.5% of the total peak surface with decreasing trend from week 7 to the end of the experiment. In reactor A, OTU 224 was predominant after 2 weeks of operation (approximately 28%) but the peak surface decreased constantly being absent during the last 2 weeks of operation. OTU 239 was predominant in reactor A from week 4 onward with a peak surface of 26.7±5.4%. This OTU appeared somewhat later in reactor B but accounted at the end for 18.6±1.4% of the total peak area. Whereas OTU 289 was constantly present in the reactor B community with an average peak area of 7.8±2.7%, it was present in reactor A at similar abundances of 8.4±2.0% up to 30 °C. OTU 289 became predominant at 35 °C with peak areas of 20.4±2.7%.
Identification of predominant OTUs
The identification of predominant OTUs was realized through cloning and sequencing of partial 16S rRNA gene sequences. Cloned PCR products were first analyzed by T-RFLP, and clones showing a T-RF identified as predom-inant in the electropherograms were sequenced and ana-lyzed. Between 2 and 14 clones were analyzed for each OTU, only for OTUs 215 and 216, there was only one
clone available (Table 2). For five OTUs (185, 195, 224,
239, 250), the identification was not straightforward, possibly indicating that the OTU was composed of more than one population. The presence of two populations in one OTU was however only observed in three cases, e.g., for OTU 185 in reactor A of the first-stage experiment, for OTU 195 in reactor B of the first-stage experiment, and for OTU 250 in reactor B. In other two cases, one population was either only detected in one of the two reactors operated in parallel or only during one stage of the two experimen-tation periods.
Most of the obtained sequences affiliated with clones and bacteria which have been isolated themselves from wastewater treatment systems, either laboratory or full scale installations, and often also from microbial communities performing EBPR or at least undergoing anaerobic–aerobic cycles. A striking feature was that almost all OTUs were affiliated with the phylum Proteobacteria. Members of bacterial guilds normally encountered in EBPR such as PAO and GAO were identified within different OTUs. Putative GAO were identified within OTU 185 and 239, putative PAO within OTU 214. Both GAO and PAO were mainly detected in the second-stage experiment, with the exception of one clone with a T-RF of 185 nucleotides that has been isolated from a first-stage sludge sample from reactor A. The clone that fell within OTU 216 affiliated with isolate Is32 that has been identified as a strain of the aerobic ammonium-oxidizing genus Nitrosomonas.
Axis 2: 15.9 % 6.6 6.6 Axis 2: 17.1 % Axis 1: 25.3 % 2 3 6 10 14 17 22 27 24 31 38 42 57 66 3 4 9 11 15 18 28 32 39 43 50 52 58 67 -3 3 -3 3 Axis 1: 21.6 % -6.6 -6.6 -2.5 Axis 2: 19.1% Axis 1: 24.9% 6 12 21 28 35 42 49 56 65 79 89 96 102 6 12 21 28 35 42 49 56 65 79 89 96 2.5 -2.5 2.5
b
a
Fig. 3 Correspondence analysis (CA) of microbial communities present in the two BC-SBRs. The points represent the bacterial community structure according to T-RFLP analysis. a First-stage experiment with two reactors operated at constant temperatures; closed triangles, 20 °C reactor; open triangles, 30 °C reactor; and insert, CA of all samples (closed triangles) plus the inoculum (open circle). b Second-stage experiment with one reactor operated at 20 °C and the other at increasing temperature; closed triangles, 20 °C reactor; open triangles, 25 °C; open diamond, 28 °C; open circles, 30 °C; and closed circles, 35 °C. The numbers beside the points indicate the day of sampling, the italic ones in a for the samples of the first stage 30 °C reactor and in b for the second-stage reactor operated at increasing temperature
Discussion
The major goal of this study was to evaluate the influence of temperature ranging from 20 °C to 35 °C on the formation and stability, on nutrient removal, and on the microbial community composition of aerobic granular sludge. With the inoculum sludge used, start-up at 30 °C and obtaining stable aerobic granular sludge failed. The observed fluffy granule structure and the presence of filamentous bacteria as shown by molecular analysis indicated that at an initial temperature of 30 °C these bacterial populations had a selective advantage over populations promoting the formation of smooth fast-settling granules and hindered the formation of stable
aerobic granular sludge. It was only possible to obtain stable aerobic granular sludge at 30 °C and 35 °C when aerobic granular sludge cultivated in a BC-SBR operated at 20 °C was used as seed sludge and temperature was stepwise increased. A similar observation has been made in a study investigating the feasibility of aerobic granular sludge technology at low temperatures (de Kreuk et al. 2005b). Start-up at 8 °C has failed whereas lowering temperature after a start-up at 20 °C succeeded in an operational system at 8 °C.
The properties of the granular sludge obtained at 20 °C, 30 °C, and 35 °C were quite similar and comparable with sludge properties reported in previous studies. Granules had a similar diameter as the ones obtained in a sequencing 0% 20% 40% 60% 80% 100% 3 11 15 18 25 28 32 39 43 58 67 days
Sum of T-RF peak surface
others 250 224 215 213 208 195 189 0% 20% 40% 60% 80% 100% 2 6 10 14 17 24 27 31 38 42 57 66 days
Sum of T-RF peak surface
others 250 224 215 208 195 193 15 10 7 5 3 3 3 3 3 5 5 5 5 15 10 7 5 3 3 3 3 3 5 5 5 5 9 4 3
a
b
Fig. 4 Relative abundance ofdifferent OTUs detected in granular sludge samples taken after different times of operation during the first-stage experiment according to T-RFLP analysis. a BC-SBR where the temperature was maintained at 30 °C. b BC-SBR where the temperature was kept constant at 20 °C. Only those OTUs that accounted at least once for >3.0% of the total peak surface are represented, and the whole was normalized to 100% ignoring the peak sur-face of the minor OTUs. In the category“others” are summa-rized OTUs that did not have a clear pattern and were detected only one to three times in the samples analyzed. Indicated on top of each bar is the duration of the sedimentation phase in minutes
batch airlift reactor with slow anaerobic feeding (de Kreuk
et al.2005a) but was smaller than the granule diameter of
sludge obtained with aerobic pulse feeding (Beun et al.
2002). Biomass concentration in the reactor and SVI8were
also comparable with the values reported for a sequencing
airlift reactor (de Kreuk et al. 2005a) indicating that the
reactor configuration has no major influence on these
sludge properties. The density of 75 gVSS Lbiomass−1 of
20 °C–sludge was in the same range as the sludge density
reported by others (Beun et al. 2002; de Kreuk et al.
2005a). Interestingly, the 30 °C– and 35 °C–sludge of this
study was almost twice as dense (120 gVSS Lbiomass−1) as
20 °C–sludge. The start-up time of 3 weeks necessary to
obtain granular sludge was rather long compared with a sequencing batch airlift reactor with aerobic pulse feeding
(Beun et al. 2002) but was very similar with sequencing
reactors operated with slow anaerobic feeding independent whether it was an airlift or bubble column reactor (de Kreuk
and van Loosdrecht2004; de Kreuk et al.2005b).
Although the inoculation sludge was taken from a WWTP performing biological nitrogen as well as phospho-rous removal, the time needed until EBPR was observed was very long. No significant phosphorous removal other than assimilation by biomass formation was observed during the first-stage experiment, and EBPR only was significant after additional 6 weeks of operation of the second-stage reactors. Acclimatization of activated sludge
to alternating anaerobic–aerobic conditions resulting in
enrichment of PAO has been shown to require 40–100 days
(Kortstee et al. 1994) and start-up failures and process
0% 20% 40% 60% 80% 100% 6 12 21 28 35 42 49 56 65 79 89 96 6 12 21 28 35 42 49 56 65 79 89 96 102 EA days
Sum of T-RF peak surface
others 289 239 224 216 214 195 193 0% 20% 40% 60% 80% 100% EB WG days
Sum of T-RF peak surface
others 289 239 224 214 195 193 185 25-28˚C 30˚C 35˚C
a
b
Fig. 5 Relative abundance ofdifferent OTUs detected in granular sludge samples taken after different times of operation during the second-stage experi-ment according to T-RFLP analysis. a BC-SBR where the temperature was stepwise in-creased. b BC-SBR where the temperature was kept constant at 20 °C. The inoculum for both reactors was aerobic granular sludge obtained during the first-stage experiment with a BC-SBR operated at 20 °C. Only those OTUs that accounted at least once for >3.0% of the total peak surface are represented, and the whole was normalized to 100% ignoring the peak sur-face of the minor OTUs. In the category“others” are summa-rized OTUs that did not have a clear pattern and were detected only one to three times in the samples analyzed. EA and EB represents the analysis of efflu-ent biomass at day 96. WG represents the analysis of white granules that were separated from the rest by visual screening and selection
T able 2 Phylogenetic analysis of clones isolated from the SB-BCRs operated at dif ferent temperatures for up to 96 days OTU 2 Present from day X to day Y b Af filiation c Closest relatifve Accession number Identity (%) Physiological properties or system isolated from No. of clones d First-stage reactor Second-stage reactor First-stage reactor Second-stage Reactor AB A B ABA B 185 12 –96 C: Gammapr oteobacteria clone A1-41 AM180057 97 N-and P-removal system 1 1 2 G: Ochr obactrum Ochr obactrum anthr opi CP000759 100 Aerobic heterotrophe 1 1 193 38 –67 6– 28 6– 96 G: Dechlor omonas clone PHOS-HE23 AF314420 99 P-removal ecosystem 3 195 3– 67 3– 67 6– 96 6– 65 G: Zoogloea clone LPB19 AF527582 99 P-removal SBR system 2 1 3 4 G: Escherichia/Shigella Bacterium HPC775 A Y838362 98 Activated biomass 3 208 4– 58 6– 42 O: Burkholderiales clone L18 AB087576 98 Bulking sludge 1 1 213 4– 18 F: Comamonadaceae clone nsc041 A Y491594 99 W astewater bioreactor 1 1 214 42 –65 42 –96 F: Rhodocyclaceae clone UWMH_4 EF565147 99 P-removal system 3 5 215 9– 58 10 –38 G: Dechlor omonas clone DF A W -041 A Y823964 100 Denitrifying microbial community 1 216 42 –96 G: Nitr osomonas isolate Is32 AJ621027 97 Ammonia-oxidizing bacterium 1 224 3– 67 24 –67 6– 79 6– 96 G: Novosphingobium isolate MG37 AJ746094 100 Aerobic heterotrophe 6 F: Hyphomonadaceae clone HP1B26 AF502221 99 P-removal system 1 239 21 –96 35 –96 C: Gammapr oteobacteria clone Cont82 A Y651306 99 P-removal system 6 C: Gammapr oteobacteria clone SBRL1_8 A Y098896 99 P-removal system 7 250 3– 28 2– 24 G: Chryseobacterium clone HP1B06 AF502204 99 P-removal system 1 1 1 1 G: Acinetobacter clone HI-O4 DQ205305 100 Aerobic heterotrophe 2 3 3 289 12 –96 12 –96 F: Sphingomonadaceae isolate EP A 505 U37341 100 P AH-degrading bacterium 1 2 1 The first-stage experiment was run for 67 days, reactor A at 3 0 °C and reactor B at 2 0 °C. The second-stage experiment was run for 96 days, reactor A for 12 d ays at 25 °C, then for 9 days at 28 ° C, for 48 days at 30 °C, and finally for 34 days at 35 °C; reactor B was run for 96 days at 20 °C a One OTU (opera tional taxonom ic unit) comprises all popu lations prod ucing a terminal restriction fragme nt w ith a spec ific length b The OTUs were detecte d as O TUs accou nting for >3% of total peak surface within this period (see also Figs. 4 and 5 ) cClassifica tion by the Classifier tool of RDP ( http://rdp.cme.msu.ed u/classifier/classifier .jsp ) indic ating the taxo nimic unit classified with a con fidence threshold of 80% ; C class, O orde r, F fam ily , G genus d Slud ge sam ples taken at dif fer ent time point s during ope ration were chosen for cloning and sequen cing and clon es w ere first tested for the prod uction of a terminal restriction fragme nt w ith a specific leng th in T -RFLP analysis
breakdowns have been reported (Cech and Hartman1993;
Satoh et al. 1994; Bond et al. 1998). However, the
inoculum sludge used here has already been acclimatized and therefore, only the rigorous change of conditions such as the artificial wastewater with very reduced composition complexity and the mode of operation, SBR versus traditional activated sludge process, might explain the failure of rapid establishment of all nutrient removal properties of the inoculum sludge in the aerobic granular sludge. Besides EBPR, also nitrification was observed only in a later stage of the second-stage experiment, and this was, even more surprisingly, only at 30 °C. Similar long periods for establishment of biological nitrogen and phosphorous removal have been reported earlier despite the use of well-adapted activated sludge (de Kreuk et al. 2005a). Biological phosphorous removal has reached 95% removal efficiency after 65 days of reactor operation and significant nitrification, initially inhibited by the addition of allylthiourea for 52 days, has been observed only about 100 days after stopping addition of allylthiourea.
Nutrient removal performances were quite different at the different temperatures investigated. EBPR followed the same trends as observed in other studies comparing different
treatment temperatures (Erdal et al. 2003; Panswad et al.
2003; Whang and Park 2006; Lopez-Vazquez et al. 2007).
These studies have shown that at 20 °C and below, PAO were predominant and thus able outcompeting GAO that deteriorate the desired nutrient elimination process. At 30 °C, EBPR was less effective due to competitive advantages of GAO at this mesophilic temperature. In the present study, EBPR was very inefficient at 30 °C with only 8% phosphorous removal and even completely absent at 35 °C. The detailed analysis of the composition and the dynamics of the microbial communities present in the two experimental stages clearly showed that many of the different phenomena observed concerning granule forma-tion and nutrient removal were probably due to the presence of specific predominant OTUs. Shortly after start-up, the remaining sludge was dominated by OTU 250 composed of mainly Acinetobacter-affiliated popula-tions and to lesser extends by Chryseobacterium-affiliated
populations (Fig.4, Table2). After a few more days where
sedimentation time was reduced from 15 to 5 min, the biomass was mainly containing OTU 195 in both reactors, an OTU that was also composed of at least two populations, a betaproteobacterial Zoogloea-affiliated population and one that affiliated with a gammaproteobacterial clone isolated from activated biomass. Zoogloea spp. are known to be typically encountered in activated sludge flocs gluing together the different organisms present in these microbial
flocs (Rosselló-Mora et al. 1995). The predominance of
OTU 195 fluctuated but remained quite important at 30 °C and lost predominance at 20 °C.
Besides OTU 195, other OTUs such as OTU 208, OTU 215, and OTU 224 appeared in the sludge of the first-stage experiment selected by short sedimentation periods of only 3 to 5 min. At 30 °C where fluffy granules were observed, the microbial community contained significant parts of OTU 208 whose clones affiliated with clones that have been identified as Sphaerotilus spp. and Leptothrix spp., both filamentous bacteria observed in bulking sludge
(Martins et al. 2004). OTU 208 was also observed at 20 °C
but was much less abundant. Poor long-term stability of aerobic granules has been reviewed recently and growth of filamentous bacteria due to increase of temperature has been identified as one of the causes of this undesired phenomenon
(Liu and Liu2006).
OTU 224 containing mainly Sphingomonadaceae-affiliated populations became quite abundant at 20 °C when the sludge biomass was composed primarily of smooth granules (>24 days of operation). This OTU was only periodically observed at 30 °C and was much less abundant. In addition to OTU 224, OTU 193 affiliated with the genus Dechloromonas became an important OTU in the smooth granular sludge biomass at 20 °C. The granular sludge biomass that developed at 20 °C and that had similar characteristics as granular sludge described in other studies did not contain obvious PAO and GAO that should normally be enriched by the operation mode applied and that have been proposed as a mean for improving aerobic granular sludge stability (de
Kreuk and van Loosdrecht2004).
The composition of the granular sludge after 1 week of operation in the second stage was quite similar at 20 °C and 25 °C and comparable with the inoculum sludge taken from the first stage 20 °C reactor. The main difference with the inoculum sludge was that the Zoogloea-affiliated OTU 195 was again the predominant one after this short period of reactor start-up. This OTU reduced in abundance and disappeared at 20 °C but became an abundant OTU in reactor A when operated at 35 °C. The two Shingomonada-ceae-affiliated OTUs 224 and 289 were observed in both reactors but exhibited different dynamics. OTU 224 was always present abundantly at 20 °C but abundance decreased at higher temperatures in reactor A. OTU 289 was a minor OTU at 20 °C but became a predominant one at 35 °C. It seems, however, that overall such Sphingomonadaceae-affiliated OTUs had an important function in granular structure and stability. Although all clones representing these OTUs affiliated with Alphaproteobacteria, they were not closely related with putative GAO of the same phylum
(Meyer et al.2006). This does however not exclude that the
Sphingomonadaceae-affiliated clones observed here do not have a GAO-like metabolism.
Two different OTUs, OTU 185 and OTU 239, represent putative GAO belonging to the class Gammaproteobacteria
phos-phatis” (Crocetti et al.2002). OTU 185 was only observed at 20 °C, whereas OTU 239 was present at all temperatures. The latter became a very predominant OTU at 30 °C and 35 °C which is in accordance with previous findings that higher temperatures allow GAO to outcompete PAO (Erdal
et al. 2003; Panswad et al. 2003; Whang and Park 2006;
Lopez-Vazquez et al.2007).
OTU 214 that contained mainly the
Rhodocyclaceae-affiliated PAO, tentatively named “Candidatus
Accumuli-bacter phosphatis” (Hesselmann et al.1999), was observed
from week 6 onward when also EBPR activity started to be observed at 20 °C and 30 °C. It became a quite abundant OTU at 20 °C which is in agreement with the increasing EBPR activity observed in this reactor. The same OTU disappeared at 35 °C where no EBPR activity was observed anymore. Similar agreement between reactor performance and the corresponding OTU present in the sludge sample was observed for nitrification activity. OTU 216 that was a Nitrosomonas-affiliated OTU was only observed at 30 °C and 35 °C but not at 20 °C where no nitrification occurred. The goal of the molecular study of the microbial community composition and dynamics was to characterize the diversity of predominant OTUs and the composition of the latter. The composition of the sludge microbial communities was not very complex, possibly as a response of the use of a low-complexity artificial wastewater. However, all clone sequences obtained affiliated with clones or isolates that have been obtained from activated sludge or SBR wastewater treatment systems. Quite frequently, they have even been obtained from systems performing EBPR and/or nitrogen removal. Since these clones and isolates have been obtained from sludge flocs, it can be concluded that reactor operation resulting in aerobic granular sludge formation is not selecting specific bacteria forming these structures but is forming microbial granules composed of the same bacteria that form flocs under other conditions. The 20 °C reactor of the first-stage experiment showed in addition that it may not be a prerequisite to contain GAO or PAO in order to get smooth and stable aerobic granules.
Acknowledgments The authors thank Marc Deront and Jean-Pierre Kradolfer for the excellent technical assistance in the reactor construction and operation, respectively.
References
Altschul SF, Madden TL, Schäffer AA, Zhang J, Zhang Z, Miller W, Lipman DJ (1997) Gapped BLAST and PSI-BLAST: a new generation of protein database search programs. Nucleic Acids Res 25:3389–3402
Beun JJ, Heijnen JJ, van Loosdrecht MCM (2001) N-Removal in a granular sludge sequencing batch airlift reactor. Biotechnol Bioeng 75:82–92
Beun JJ, van Loosdrecht MCM, Heijnen JJ (2002) Aerobic granula-tion in a sequencing batch airlift reactor. Water Res 36:702–712 Bond PL, Keller J, Blackall LL (1998) Characterisation of enhanced biological phosphorous removal activated sludges with dissimilar phosphorous removal performances. Water Sci Technol 37:567–571 Cech J, Hartman P (1993) Competition between polyphosphate and polysaccharide accumulating bacteria in enhanced biological phosphate removal systems. Water Res 27:1219–1225
Crocetti GR, Hugenholtz P, Bond PL, Schuler A, Keller J, Jenkins D, Blackall LL (2000) Identification of polyphosphate-accumulating organisms and design of 16S rRNA-directed probes for their detection and quantitation. Appl Environ Microbiol 66:1175–1182 Crocetti GR, Banfield JF, Keller J, Bond PL, Blackall LL (2002)
Glycogen-accumulating organisms in laboratory-scale and full-scale wastewater treatment processes. Microbiol 148:3353–3364 de Bruin LMM, de Kreuk MK, van der Roest HFR, Uijterlinde C, van Loosdrecht MCM (2004) Aerobic granular sludge technology: an alternative to activated sludge? Water Sci Technol 49:1–7 de Kreuk MK, van Loosdrecht MCM (2004) Selection of slow
growing organisms as a means for improving aerobic granular sludge stability. Water Sci Technol 49:9–17
de Kreuk MK, Heijnen JJ, van Loosdrecht MCM (2005a) Simulta-neous COD, nitrogen, and phosphate removal by aerobic granular sludge. Biotechnol Bioeng 90:761–769
de Kreuk MK, Pronk M, van Loosdrecht MCM (2005b) Formation of aerobic granules and conversion processes in an aerobic granular sludge reactor at moderate and low temperatures. Water Res 39:4476–4484
de Kreuk MK, Kishida N, van Loosdrecht MCM (2007) Aerobic granular sludge—state of the art. Water Sci Technol 55:75–81 Erdal UG, Erdal ZK, Randall CW (2003) The competition between
PAOs (phosphorus accumulating organisms) and GAOs (glyco-gen accumulating organisms) in EBPR (enhanced biological phosphorus removal) systems at different temperatures and the effects on system performance. Water Sci Technol 47:1–8 Filipe CDM, Daigger GT, Grady CPL (2001) pH as a key factor in the
competition between glycogen-accumulating organisms and phosphorus-accumulating organisms. Water Environ Res 73:223–232
Hesselmann RPX, Werlen C, Hahn D, van der Meer JR, Zehnder AJB (1999) Enrichment, phylogenetic analysis and detection of a bacterium that performs enhanced biological phosphate removal in activated sludge. Syst Appl Microbiol 22:454–465
Kortstee GJ, Appeldoorn KJ, Bonting CF, van Niel EW, van Veen HW (1994) Biology of polyphosphate-accumulating bacteria involved in enhanced biological phosphorous removal. FEMS Microbiol Rev 15:137–153
Legendre P, Legendre L (1998) Numerical ecology, 2nd English edition edn. Elsevier, Amsterdam
Liu Y, Liu QS (2006) Causes and control of filamentous growth in aerobic granular sludge sequencing batch reactors. Biotechnol Adv 24:115–127
Liu Y, Tay J-H (2004) State of the art of biogranulation technology for wastewater treatment. Biotechnol Adv 22:533–563
Lopez-Vazquez CM, Song YI, Hooijmans CM, Brdjanovic D, Moussa MS, Gijzen HJ, van Loosdrecht MMC (2007) Short-term temperature effects on the anaerobic metabolism of glycogen accumulating organisms. Biotechnol Bioeng 97:483–495 Maidak BL, Olsen GJ, Larsen N, Overbeek R, McCaughey MJ,
Woese CR (1996) The Ribosomal Database Project (RDP). Nucleic Acids Res 24:82–85
Martins AMP, Pagilla K, Heijnen JJ, van Loosdrecht MCM (2004) Filamentous bulking sludge—a critical review. Water Res 38:793–817
Meyer RL, Saunders AM, Blackall LL (2006) Putative glycogen-accumulating organisms belonging to the Alphaproteobacteria
identified through rRNA-based stable isotope probing. Microbiol 152:419–429
Morgenroth E, Sherden T, van Loosdrecht MCM, Heijnen JJ, Wilderer PA (1997) Aerobic granular sludge in a sequencing batch reactor. Water Res 31:3191–3194
Mosquera-Corral A, de Kreuk MK, Heijnen JJ, van Loosdrecht MCM (2005) Effects of oxygen concentration on N-removal in an aerobic granular sludge reactor. Water Res 39:2676–2686 Oehmen A, Yuan Z, Blackall LL, Keller J (2004) Short-term effects of
carbon source on the competition of polyphosphate accumulating organisms and glycogen accumulating organisms. Water Sci Technol 50:139–144
Panswad T, Doungchai A, Anotai J (2003) Temperature effect on microbial community of enhanced biological phosphorus remov-al system. Water Res 37:409–415
Rosselló-Mora RA, Wagner M, Amann R, Schleifer KH (1995) The abundance of Zoogloea ramigera in sewage treatment plants. Appl Environ Microbiol 61:702–707
Satoh H, Mino T, Matsuo T (1994) Deterioration of enhanced biological phosphorous removal by the domination of micro-organisms without polyphosphate accumulation. Water Sci Technol 30:203–211
Saunders AM, Oehmen A, Blackall LL, Yuan Z, Keller J (2003) The effect of GAOs (glycogen accumulating organisms) on anaerobic
carbon requirements in full-scale Australian EBPR (enhanced biological phosphorus removal) plants. Water Sci Technol 47:37–43 Tay STL, Zhuang WQ, Tay JH (2005) Start-up, microbial community analysis and formation of aerobic granules in a tert-butyl alcohol degrading sequencing batch reactor. Environ Sci Technol 39:5774–5780
Whang LM, Park JK (2002) Competition between polyphosphate- and glycogen-accumulating organisms in biological phosphorus removal systems—effect of temperature. Water Sci Technol 46:191–194
Whang LM, Park JK (2006) Competition between polyphosphate- and glycogen-accumulating organisms in enhanced-biological-phosphorus-removal systems: effect of temperature and sludge age. Water Environ Res 78:4–11
Wilen B-M, Onuki M, Hermansson M, Lumley D, Mino T (2008) Microbial community structure in activated sludge floc analysed by fluorescence in situ hybridization and its relation to floc stability. Water Res 42:2300–2308
Williams JC, Reyes FLD (2006) Microbial community structure of activated sludge during aerobic granulation in an annular gap bioreactor. Water Sci Technol 54:139–146
Zitomer DH, Duran M, Albert R, Guven E (2007) Thermophilic aerobic granular biomass for enhanced settleability. Water Res 41:819–825