HAL Id: hal-03169567
https://hal.archives-ouvertes.fr/hal-03169567
Submitted on 15 Mar 2021
HAL is a multi-disciplinary open access
archive for the deposit and dissemination of
sci-entific research documents, whether they are
pub-lished or not. The documents may come from
teaching and research institutions in France or
abroad, or from public or private research centers.
L’archive ouverte pluridisciplinaire HAL, est
destinée au dépôt et à la diffusion de documents
scientifiques de niveau recherche, publiés ou non,
émanant des établissements d’enseignement et de
recherche français ou étrangers, des laboratoires
publics ou privés.
Distributed under a Creative Commons Attribution| 4.0 International License
map in other regions of the chickpea genome
Kaliamoorthy Sivasakthi, Mahendar Thudi, Murugesan Tharanya, Sandip
Kale, Jana Kholová, Mahamat Halime, Deepa Jaganathan, Rekha Baddam,
Thiyagarajan Thirunalasundari, Pooran Gaur, et al.
To cite this version:
Kaliamoorthy Sivasakthi, Mahendar Thudi, Murugesan Tharanya, Sandip Kale, Jana Kholová, et al..
Plant vigour QTLs co-map with an earlier reported QTL hotspot for drought tolerance while water
saving QTLs map in other regions of the chickpea genome. BMC Plant Biology, 2018, 18, pp.29.
�10.1186/s12870-018-1245-1�. �hal-03169567�
R E S E A R C H A R T I C L E
Open Access
Plant vigour QTLs co-map with an earlier
reported QTL hotspot for drought tolerance
while water saving QTLs map in other
regions of the chickpea genome
Kaliamoorthy Sivasakthi
1,2, Mahendar Thudi
1, Murugesan Tharanya
1,2, Sandip M. Kale
1, Jana Kholová
1,
Mahamat Hissene Halime
1, Deepa Jaganathan
1, Rekha Baddam
1, Thiyagarajan Thirunalasundari
2, Pooran M. Gaur
1,
Rajeev K. Varshney
1and Vincent Vadez
1,3*Abstract
Background: Terminal drought stress leads to substantial annual yield losses in chickpea (Cicer arietinum L.). Adaptation to water limitation is a matter of matching water supply to water demand by the crop. Therefore, harnessing the genetics of traits contributing to plant water use, i.e. transpiration rate and canopy development dynamics, is important to design crop ideotypes suited to a varying range of water limited environments. With an aim of identifying genomic regions for plant vigour (growth and canopy size) and canopy conductance traits, 232 recombinant inbred lines derived from a cross between ICC 4958 and ICC 1882, were phenotyped at vegetative stage under well-watered conditions using a high throughput phenotyping platform (LeasyScan).
Results: Twenty one major quantitative trait loci (M-QTLs) were identified for plant vigour and canopy conductance traits using an ultra-high density bin map. Plant vigour traits had 13 M-QTLs on CaLG04, with favourable alleles from high vigour parent ICC 4958. Most of them co-mapped with a previously fine mapped major drought tolerance“QTL-hotspot” region on CaLG04. One M-QTL was found for canopy conductance on CaLG03 with the ultra-high density bin map. Comparative analysis of the QTLs found across different density genetic maps revealed that QTL size reduced considerably and % of phenotypic variation increased as marker density increased.
Conclusion: Earlier reported drought tolerance hotspot is a vigour locus. The fact that canopy conductance traits, i. e. the other important determinant of plant water use, mapped on CaLG03 provides an opportunity to manipulate these loci to tailor recombinants having low/high transpiration rate and plant vigour, fitted to specific drought stress scenarios in chickpea.
Keywords: Phenotyping, Plant vigour, Transpiration rate, Quantitative trait loci (QTL),“QTL-hotspot”, Drought stress Background
Chickpea (Cicer arietinum L.), the second most import-ant grain legume crops in the world [1], is widely culti-vated on residual soil moisture in the arid and semi-arid agricultural systems of the world. Terminal water deficit
is one of the major constraints limiting the chickpea crop productivity [2] and has been reported to cause yield losses upto 50% in chickpea [3].
Deeper and more profuse rooting has been hypothe-sized to be the major factor contributing to yield in-crease under water limited environments in chickpea, where the assumption was made that these root traits would increase water extraction [4–8]. However it was also shown that chickpea genotypes with deeper and more profuse rooting did not extract more water from the soil profile [9]. Rather, tolerant chickpea genotypes
* Correspondence:v.vadez@cgiar.org
1International Crops Research Institute for the Semi-Arid Tropics (ICRISAT),
Greater Hyderabad, Telangana, India
3Institut de Recherche pour le Developpement (IRD), Université de
Montpellier– UMR DIADE, 911 Avenue Agropolis, BP 64501, 34394 Montpellier cedex 5, France
Full list of author information is available at the end of the article
© The Author(s). 2018 Open Access This article is distributed under the terms of the Creative Commons Attribution 4.0 International License (http://creativecommons.org/licenses/by/4.0/), which permits unrestricted use, distribution, and reproduction in any medium, provided you give appropriate credit to the original author(s) and the source, provide a link to the Creative Commons license, and indicate if changes were made. The Creative Commons Public Domain Dedication waiver (http://creativecommons.org/publicdomain/zero/1.0/) applies to the data made available in this article, unless otherwise stated.
turned out to be those able to somewhat limit water use at vegetative stage and making more water available for the grain filling period [9, 10]. Similar results have been reported in other crops (e.g. in pearl millet [11], in sor-ghum [12]). Therefore, the central hypothesis of the present study is that, given the limited seasonal water budget, any trait allowing water conservation during vege-tative growth (e.g. canopy conductivity, canopy size and development) extends the duration of water extraction during pod filling and so increases productivity of chick-pea crop under terminal water stress [9–11,13–15].
In chickpea, the availability of large scale genomic re-sources has paved the way to dissect the mechanisms underlying various stresses adaptations [16,17]. A recent mapping study in chickpea reported a genomic region on CaLG04 referred as a“QTL hotspot” that harbours several drought tolerance traits including rooting depth [18]. Introgression of this region into elite variety JG 11 im-proved yield under drought [19]. This reported“QTL hot-spot” region (spanning ~ 29 cM) was originally associated with seven SSR markers [20]. Further, this “QTL-hotspot” region was refined to~ 14 cM, with additional 49 SNP markers, [20] using genotyping-by-sequencing (GBS). Skim sequencing (with bin used as markers, based on re-combination break points) approach then allowed to fine map this region to ~ 300 Kb [21]. An intriguing feature of the preliminary steps of this research was also the map-ping of a major QTL for shoot weight on CaLG04, which co-mapped with a QTLs for root traits (depth and length density), from a study where these traits were assessed in PVC tubes [22]. Interestingly, the percentage of pheno-typic variation explained by this QTL was more for the shoot dry weight than for the root traits, suggesting that this QTL region was a QTL for vigour, but this hypothesis was not followed further.
In chickpea, the studies of physiological traits allowing water conservation (e.g. canopy conductivity, canopy size & development; [9,10]) are very scarce, partially because an accurate assessment of leaf area is a rate limiting step. Recognizing this obstacle, a high throughput phenotyp-ing platform was developed to measure canopy develop-ment traits [23]. The high throughput platform was used to phenotype the RIL population (ICC 4958 × ICC 1882), from which the “QTL-hotspot” was reported, for plant vigour traits (leaf area, plant height, rate of leaf area in-crease) and water saving traits (conductance), as a mean to re-investigate the map location of these traits with regards to the QTL hotspot earlier identified [18].
Therefore, the overall objective of this study was: i) to assess the phenotypic variation in traits involved in the control of plant water use either from canopy develop-ment or canopy conductance, and explore their func-tional associations in a RIL mapping population previously used for mapping the “drought tolerance
QTL” (ICC 4958 × ICC 1882), ii) to map these drought adaptive traits and assess their interactions, iii) to con-duct comparative mapping study using differently satu-rated genetic maps.
Results
Based on trait functionality, these were clustered (Clus-tering analysis) and grouped into two major clusters: (i) a cluster of plant vigour traits [Plant vigour score (VIG), 3D-leaf area (3D-L), projected leaf area (PL), plant height (PH), 3D-leaf area growth rate (3D-LG), projected leaf area growth rate (PLG), plant height growth rate (PHG), shoot dry weight (SDW), leaf area index (LAI), specific leaf weight (SLW) and specific leaf area (SLA)]; and (ii) a cluster of traits related to canopy conductance [Transpiration (T), evapotranspiration (eT), transpiration rate (TR), evapotranspiration rate (eTR) and the resid-uals between 3D and projected leaf area (R-3D/PLA, a trait that was interpreted to represent the canopy struc-ture)] (Table1; Additional file1).
Phenotypic analysis Plant vigour related traits
Summary statistics The two parental genotypes (ICC 4958 and ICC 1882), as well as RILs, showed significant differences in plant vigour traits in both years (Table 2). For example, 3D-Leaf area (3D-L) was among those show-ing the largest variation, i.e. a 5-fold range variation in both years (Fig. 1a& Table2). Continuous variation and normal frequency distribution were found for plant vigour traits (Additional file2A, B, C &D). Additional file3A & B showed 3D-leaf area & plant height development dy-namics of parental lines. The high vigour parent ICC 4958 had faster leaf area and plant height development (canopy development) than low vigour parent ICC 1882.
According to Rabinson et al. [24], heritability (h2%) is classified as low (0-30%), moderate (30-60%) and high (> 60%). Most of the plant vigour related traits hadh2% in the range of 60- 90% (e.g. PH, 3DL, 3D-LG, SLW and SDW; Table 2). Among these, plant height (PH) and 3DL showed highest heritability [PH (87.5 and 88%) and 3DL (76 and 89%) in 2014 and 2015 respectively].
Canopy conductance traits
Summary statistics The two parental genotypes (ICC 4958 and ICC 1882) and RILs (progenies) showed sig-nificant difference for all canopy conductance traits (T, TR, eT, eTR & R-3D/PLA) in both years (2014-2015; Table 2). For example, T was one among those showing the largest phenotypic variation, i.e. a 5-fold range vari-ation in both years (Table 2). In addition, TR also showed 2-fold range of variation (Fig. 1b). Continuous
variation and normal frequency distribution was found for all traits (Additional file 2 E, F, G & H -data not shown for R-3D/PLA). Transpiration and 3D-leaf area were tightly correlated (r2= 0.68) until the LAI reached a value of 1 (25 DAS). Thereafter, this relationship became much weaker (r2= 0.22) when the plants reached an LAI between 1 and 2 (38 DAS; see Fig. 2 a & b). At this stage, TR became much more closely related to T (r2= 0.92), whereas this relationship was weaker (r2= 0.62) when the LAI was less than 1 (25 DAS; see Fig. 2 c & d). Hence it was interpreted that at a low LAI, leaf area was the main driver of T. By contrast, at a high LAI, TR was the main driver of T. Since the average VPD during the transpiration measurement was high (3.76 kPa), this was interpreted to be caused by TR differences under high VPD.
Most of the canopy conductance traits had low to medium (25 to 68%) heritability (e.g. TR, eT, eTR and
R-3D/PLA), except T (high h2 range; 62 and 70% in 2014 and 2015 respectively) (Table2).
Trait correlation and their relationships
Simple Pearson correlation analysis Phenotypic cor-relation coefficients of ICC 4958 x ICC 1882 population are presented in Additional file 4. As expected there were strong relationships within both groups of traits, but also between traits across groups. As expected, 3DL, LAI and SDW (plant vigour traits) were positively corre-lated with T and eT (canopy conductance traits), whereas 3DL, PL, LAI and SLA were negatively correlated with TR (see Additional file 4). Interestingly, most plant vigour traits were negatively correlated with R-3D/PLA (Canopy structure). By contrast, R-3D/PLA was posi-tively correlated with TR and eTR. A significant correl-ation was observed among plant vigour traits. For example, plant vigour score (VIG) was significantly
Table 1 Summary on traits phenotyped using high throughput plant phenotyping platform (LeasyScan). Summary include trait name, trait code, trait type, year of phenotyping, replication, and measurement methods
No. of traits
Trait name Trait code
Trait type Year of phenotyping
Replication Measurement method 1 Plant vigour VIG Plant vigour Nov-Dec-2015 4 Visual eye scoring 2 Projected Leaf area (cm2) PL Plant vigour Nov-Dec-2014 &
2015
3 & 4 LeasyScan-Plant eye camera 3 Projected Leaf area growth rate
(cm2day− 1)
PLG Plant vigour Nov-Dec-2014 & 2015
3 & 4 LeasyScan data derived 4 3-Dimentional (3D) Leaf area (mm2) 3DL Plant vigour Nov-Dec-2014 &
2015
3 & 4 LeasyScan-Plant eye camera 5 3-Dimentional (3D) Leaf area growth
rate (mm2)
3DLG Plant vigour Nov-Dec-2014 & 2015
3 & 4 LeasyScan data derived 6 Leaf area index LAI Plant vigour Nov-Dec-2014 &
2015
3 & 4 LeasyScan data derived 7 Shoot dry weight (g) SDW Plant vigour Nov-Dec-2014 &
2015
3 & 4 LeasyScan & gravimetric data derived
8 Specific leaf area (g mm2) SLA Plant vigour Nov-Dec-2014 & 2015
3 & 4 LeasyScan & gravimetric data derived
9 Specific leaf weight (mg mm2) SLW Plant vigour Nov-Dec-2014 &
2015
3 & 4 LeasyScan & gravimetric data derived
10 Residuals from 3-D & projected Leaf area
(cm2) R-3D/PLA Canopy structure Nov-Dec-2014 &2015 3 & 4 LeasyScan data derived
11 Plant height (cm) PH Plant vigour Nov-Dec-2014 & 2015
3 & 4 LeasyScan-Plant eye camera 12 Plant height growth rate (cm day−1) PHG Plant vigour Nov-Dec-2014 &
2015
3 & 4 LeasyScan data derived 13 Evapotranspiration (g) eT Canopy
conductance
Nov-Dec-2014 & 2015
3 & 4 Gravimetric pot weighing 14 Evapotranspiration rate (mg mm2day
−1) eTR Canopyconductance Nov-Dec-2014 &2015 3 & 4 Gravimetric & LeasyScan-dataderived
15 Transpiration (g) T Canopy conductance
Nov-Dec-2014 & 2015
3 & 4 Gravimetric data derived 16 Transpiration rate (g cm2day−1) TR Canopy
conductance
Nov-Dec-2014 & 2015
3 & 4 Gravimetric & LeasyScan-data derived
correlated with PH (0.73, P = 0.0001), PHG (0.62, P = 0.0001), 3DL (0.46, P = 0.0001), LAI (0.47, P = 0.0001), SDW (0.44, P = 0.0001) (Additional file4). In addition, a significant correlation was observed among canopy con-ductance traits. For example, TR was well correlated with eT (0.63, P = 0.0001), eTR (0.61, P = 0.0001) and T (0.44, P = 0.0001) (Additional file4).
Principal component analysis (PCA) A principal com-ponent analysis was used to identify the relationships be-tween parameters, and group these in a more comprehensive manner. Three principal components
(PC) explained 62% of the total variation observed among the RIL population, using BLUPs phenotypic data across years (Additional files5 and 6). PC1 (34%) had a strong positive loading from SLA and a strong negative loading from 3DL (Additional file 6), which agrees well with the strong negative correlations between these traits (Additional file4). PC2 (17%) had a strong positive loading from PL and 3DL (plant vigour traits), whereas most canopy conductance traits had a strong negative loading. This also agreed well with the strong negative correlations between plant vigour (PL and 3DL) and canopy conductance (TR and eTR) traits (Additional file
Table 2 ANOVA results for the 16 traits phenotyped using high throughput plant phenotyping platform (LeasyScan). F represents probability; SE represents the standard error; LSD represents least significant difference and h2represents the heritability values
Parents Progenies
Trait No. Traits code Year ICC 4958 ICC 1882 Significance LSD Variation in RILs Grand mean Significance S.E LSD h2(%)
1 VIG 2015 5 2.0 0.01 1.0 2.0 - 5.00 3.718 <.001 0.50 0.97 73 2 3DL 2014 46,497 25,389 0.01 16,147 14,237 -71,290 35,549.7 <.001 5575.00 10,956 76 2 3DL 2015 54,684 33,353 0.01 19,884 14,292 - 68,103 40,299 <.001 6285.00 12,339.5 89 3 3DG 2014 3079 2031 0.05 674 1207 - 4461 2397 <.001 311.80 612.7 72 3 3DG 2015 2298 1774 0.05 407 310.5 - 4487 2146 <.001 328.00 643 85 4 PL 2014 435 252 0.01 127 175 - 561 323 <.001 34.50 68.4 50 4 PL 2015 515 354 0.01 174 260 - 649.3 447 <.001 43.50 85.3 70 5 PLG 2014 68 38 0.01 27 −0.079 - 6.7 2.191 <.001 0.73 1.42 37 5 PLG 2015 19 13 0.01 7.4 4.14 - 43.15 18.43 <.001 4.80 9.4 41 6 PH 2014 110 76 0.01 29 54 - 150 96.87 <.001 4.41 8.66 96 6 PH 2015 126 72 0.01 26 47.41 - 198.3 102.7 <.001 9.20 18.1 88 7 PHG 2014 3.1 1.47 0.05 1.2 12.15 - 99.45 57.96 <.001 11.40 22.4 62 7 PHG 2015 2.1 0.97 0.01 1.1 −6.12 - 4.30 1.45 <.001 0.58 1.14 57 8 LAI 2014 0.60 0.42 0.05 0.1 0.18 - 0.79 0.383 <.001 0.0566 0.1113 59 8 LAI 2015 1.21 0.79 0.01 0.4 0.5882 - 1.399 0.988 <.001 0.11 0.21 45 9 R-3D/PLA 2014 0.19 −8.18 ns 22 −95.54 −0.401 <.001 8.16 16.04 68 9 R-3D/PLA 2015 44 68 0.05 17 −26.4 - 160.6 62.54 <.001 16.55 32.53 51 10 SDW 2014 20 12.9 0.01 6.2 8.66 - 28.97 15.78 <.001 1.21 2.38 86 10 SDW 2015 18 11.3 0.01 4.5 6.523 - 25.09 14.24 <.001 2.60 5.12 60 11 SLA 2014 4651 3975 0.05 628 1403 - 9774 4221 <.001 951.80 1870.4 66 11 SLA 2015 3287 2559 0.01 369 543.7 - 7116 2471 <.001 622.00 1222.3 64 12 SLW 2014 0.21 0.25 0.05 0.04 0.102 - 0.7126 0.2616 <.001 0.06 0.12 70 12 SLW 2015 0.73 0.33 0.01 0.25 0.1525 - 1.549 0.4849 <.001 1.22 0.24 72 13 Et 2014 37 24 0.05 4.89 13.92 - 37 22.01 <.001 2.65 5.208 65 13 eT 2015 74.46 58.46 0.01 10.44 39.83 - 108 73.21 <.001 7.9 15.6 53 14 eTR 2014 0.537 1.156 0.01 0.267 0.306 - 1.532 0.771 <.001 0.119 0.233 25 14 eTR 2015 1.278 3.00 0.01 0.539 0.918 - 3.473 1.611 <.001 0.264 0.519 25 15 T 2014 20.33 13.00 0.01 3.069 5.074 - 34.42 16.84 <.001 3.11 6.12 62 15 T 2015 50.26 34 0.01 6.75 17.13 - 88.78 52.28 <.001 6.63 13.02 70 16 TR 2014 0.00047 0.00090 0.01 0.00031 0.000289 - 0.00089 0.00058 0.004 0.000083 0.000163 41 16 TR 2015 0.00046 0.00086 0.01 0.00021 0.00034 - 0.00189 0.00111 <.001 0.000167 0.000328 57
4). PC3 (13%) had a strong positive loading from VIG, PH, PHG, SLA and T, whereas growth rate traits (3D-LG. PLG), canopy structure (R-3D/PLA) and SLW had strong negative loading (Additional file 6). This agreed well with the strong negative correlations between most of the plant vigour and canopy structure (R-3D/PLA) traits (Additional file4).
Genomic analysis Plant vigour traits
QTL analysis for single locus Plant vigour related traits mapped predominantly on CaLG04. One M-QTL [LOD 36.7 & PVE 53%] for VIG was identified in CaLG04
within the reported refined “QTL-hotspot” region (~ 300 Kb; Additional file 7). For 3DL, three M-QTLs were identified, all (LOD 6-10 & PVE 11-18%) being found in both years within the earlier reported refined “QTL-hot-spot” region with the favourable allele from ICC 4958 (Additional file 7). For PL, three QTLs were identified within the“QTL-hotspot”, with the favourable allele from ICC 4958 (Additional file 7). Among these, one was a M-QTL (LOD 6 & PVE 11%) and the remaining two were minor QTLs with PVE 8-9% (Additional file7). For LAI, one M-QTL (LOD 6 & PVE 11%) was identified within the“QTL-hotspot” with the favourable allele from ICC 4958 (Additional file 7). Two minor QTLs were identified in CaLG04 (2 QTLs) (Additional file 7). For
b
a
Fig. 1 Range of variation for plant vigour and canopy conductance related traits from LeasyScan. Range of variation in a) 3D-Leaf area (mm− 2) and b) transpiration rate (TR; mg H2O mm− 2min− 1) in 232 RILs and parents (ICC 4958 & ICC 1882) at 28 DAS under well watered conditions
SDW, one M-QTL (LOD 9 & PVE 18%) was found with favourable allele from ICC 4958 within the “QTL-hot-spot” (Additional file7), and one minor QTL was identi-fied in CaLG04 (Additional file 7). For PH, three M-QTLs (LOD 20-22 & PVE 34-39%) were identified in CaLG04 within the“QTL-hotspot” with favourable allele from ICC 4958, and one minor QTL was identified in CaLG04 (Additional file 7). For PHG, three M-QTLs (LOD 7-14 & PVE 13-23%) were found in CaLG04 within the “QTL-hotspot” with favourable allele from ICC 4958, and one minor QTL was identified in CaLG04 (Additional file 7). For SLA, three minor QTL were found in CaLG04 (PVE 4-8%; Additional file 7). Few major and minor QTLs from other CaLGs of plant vigour related traits were presented in Additional file7. Interaction QTL analysis for multiple loci Plant vigour and canopy conductance related traits, epistatic QTL (E-QTLs) interactions were analyzed using genotype matrix mapping (GMM). In this section, only selected strongest epistatic QTL (E-QTLs) interactions and high F values with RILs number higher than 10 are discussed (Additional file 8). Additional E-QTLs interactions (Lower F values and RIL number and PVE %) for plant vigour and canopy con-ductance related traits were found and are shown in Add-itional file9. Many E-QTLs interactions were identified for plant vigour traits (VIG, 3D-L, PL, PH, 3D-LG, PLG, PHG,
SDW, LAI, SLW and SLA) and these are listed in Additional file8.
Single locus region explained from − 23% to 17% of the phenotypic variation (Additional file 8). For most of the plant vigour traits, the favourable allele was contributed by the high vigour parent ICC 4958, for instance a single locus QTL [13.5% by LG04, 68.09 (AA)] increased PH by 13.5%. Two loci interactions explained from− 23% to 15% of the phenotypic variations (Additional file 8). For instance, two loci interactions [LG07, 63.45 (AA) + LG04, 68.09 (AA)] in-creased PH by 15% with favourable alleles from ICC 4958. By contrast, two loci interactions [LG04, 99.17 (BB) + LG04, 68.09 (BB)] strongly decreased PHG by − 25% with favourable allele from ICC 1882 (Additional file 8). Three loci interactions explained from− 25% to 17% of the pheno-typic variation (Additional file8). For instance, three loci in-teractions [LG04, 68.09 (AA) + LG03, 13.00 (AA) + LG03, 3.08 (AA)] increased PH by 17% with favourable allele from high vigour parent ICC 4958. By contrast, three loci interac-tions [LG08, 51.27 (−) + LG06, 91.97 (BB) + LG04, 24.82 (BB)] increased SLA by 10% with favourable allele from low vigour parent ICC 1882 (Additional file8and Fig.3).
Canopy conductance traits
QTL analysis for single locus For TR, one M-QTL (LOD 5 & PVE 10%) was identified in CaLG03
a
c
b
d
Fig. 2 Relationship between plant vigour (3D-L) and canopy conductance related traits (T &TR) from LeasyScan. a represents the relationship between transpiration and 3D-leaf area at 25 DAS (Leaf area index > 1). b represents the relationship between transpiration and 3D-leaf area at 38 DAS (Leaf area index = 1). c represents the relationship between transpiration and transpiration rate at 25 DAS (Leaf area index > 1). The (d) repre-sents the relationship between transpiration and transpiration rate at 38 DAS (Leaf area index = 1)
(Additional file7), and four minor QTL were distributed on CaLG01 (2 QTLs and PVE 5%), CaLG02 (1 QTL and PVE 5%), CaLG07 (1 QTL and PVE 5%; Additional file 7). For eTR, one M-QTL (LOD 6 & PVE 11%) was iden-tified on CaLG04 with favourable allele from ICC 1882. This QTL was located just outside the“QTL hotspot” re-gion (Additional file 7). Along with this, four minor QTL were distributed on CaLG04 (2 QTLs & PVE 5-8%) CaLG03 (1 QTL & PVE 5-8%) and CaLG07 (1 QTL & PVE 5%; see Additional file7). For T, three minor QTLs were identified, two of these explaining 8-9% phenotypic variation on CaLG04 (“QTL-hotspot” region) with favourable allele from ICC 4958. Another one QTL for T was present in CaLG05 (PVE 5%) with favourable al-lele from ICC 1882 (Additional file 7). For eTR, four minor QTLs were distributed on CaLG04 (2 QTLs & PVE 6-7%), CaLG05 (1 QTL & PVE 5%) and CaLG06 (1 QTL & PVE 5%; Additional file7).
Interaction QTL analysis for multiple loci E-QTLs in-teractions identified for canopy conductance (T, TR, eT, eTR & R-3D/PLA) are listed in Additional file8. Single locus region explained 2.2% to 20% of the phenotypic variation (Additional file 8). For instance, single locus
[LG07, 39.00 (BB)] increased R-3D/PLA by 20% with the favourable allele from ICC 1882. Two loci interactions explained from− 43% to 8% of the phenotypic variations (Additional file 8). For instance, two loci interactions [LG07, 37.57 (AA) + LG04, 68.09 (AA)] decreased R-3D/ PLA by 43% with favourable allele from ICC 4958. By contrast, two loci interactions [LG07, 12.46 (BB) + LG06, 56.51 (BB)] increased TR by 3.25% with favourable al-leles from ICC 1882. Three loci interactions explained from 4% to 31% of the phenotypic variations (Add-itional file 8). For instance, three loci interactions [LG04, 39.08 (BB) + LG03, 09.09 (BB) + LG01, 16.65 (BB)] increased R-3D/PLA (canopy structure) by 31% with favourable alleles from ICC 1882 (Additional file 8 and Fig. 3). Similarly, a three loci interactions (LG06, 12.48 (BB) + LG04, 44.46 (BB) + LG01, 25.00 (BB)] increased TR by 6.5% with all favourable alleles from ICC 1882 (Additional file 8 and Fig. 3).
Co-localization of plant vigour and drought tolerance related traits
Map position of plant vigour traits reported here was compared to map position of roots and drought toler-ance traits reported earlier [18, 20, 21]. With the low
Fig. 3 QTL interactions of plant vigour and canopy conductance related traits using genotype matrix mapping analysis. Solid lines represent the positive allele from high vigour parent ICC 4958 and dashed lines represents positive allele from low vigour parent ICC 1882. The fine dotted line from specific linkage group (LG) does not distinguish any parents
density marker map, plant vigour traits co-localized with several root traits [eg. root length density, root dry weight/total plant dry weight ratio); see [18] from the previously reported “QTL-hotspot” region (Fig. 4-I-A, B & C; Additional file10).
Similarly, mapping with high density markers data (GBS) showed that plant vigour traits (VIG, 3DL, PL, PH, PHG, LAI and SDW) co-localized with previously identified drought tolerance related traits [roots traits (RLD, RSA, RTR), morphological traits (SDW, PHT, PBS), phenological traits (DF, DM), yield related traits (100 SDW, BM, HI, POD, SPD, YLD) and drought indices (DSI, DTI)] (see, [20]) on CaLG04, which gave also a refined“QTL hotspot” region (Fig.4-II-A, B&C; Additional file11).
Further co-mapping work was done with the ultra-high density bin marker data (skim sequencing ap-proach). Here, plant vigour related traits (VIG, 3DL, PL, PH, PHG, LAI, SDW) co-localized with previously iden-tified drought tolerance related traits [RLD, RTR%, SDW, PHT, DM, POD, 100SDW, HI and DC; see, [21]] on CaLG04 within the“QTL- hotspot” region (Additional file7; Fig.4-III-A, B & C).
Bin-map “QTL-hotspot” region a & b PH, PHG &VIG had several M-QTLs (LOD 6-37 and PVE 11-53%), and these were identified in the fine mapped “QTL-hotspot”-“a” region (0.23 cM) on CaLG04. In the same region, PHT, POD, 100-SDW, RLD and DC traits were previ-ously mapped by Kale et al. [21]. Similarly, 3DL, LAI and SDW had several M-QTLs (LOD 5-10 and PVE 11-18%) that were mapped in another“QTL-hotspot”-“b” re-gion (0.22 cM). In the same rere-gion, RTR and SDW traits were previously mapped [21].
Asserting QTL location and size in different genetic maps
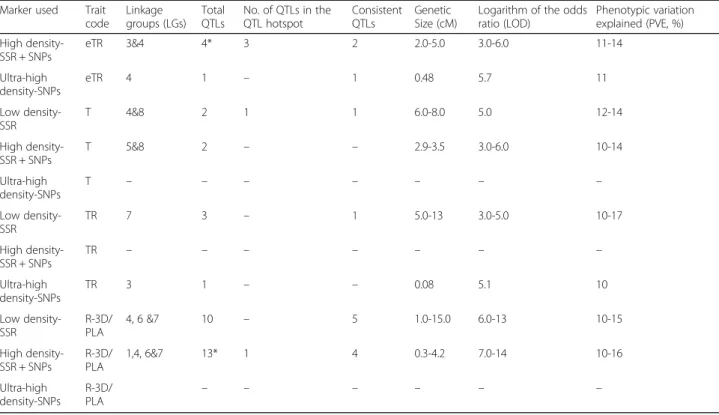
Different density genetic maps showed QTLs for plant vigour traits on CaLG04 and co-located with the “QTL-hotspot” region. Their size within the “QTL- “QTL-hotspot” re-gion using the low density (29 cM size), high density (~ 15 cM size) and ultra-high density maps (“QTL-hotspot” a & b (see more details on [21]) together ~300Kb size) on CaLG04 is discussed in this section.
For plant vigour related traits (VIG, 3DL, PL, PH, PHG, LAI, SDW), 28 and 32 M-QTLs were mapped on the low and high density maps, and their size ranged from 1 cM to 8.0 cM on the low density map and 0.8 cM to 5.6 cM on the high density map. For the same traits, the 15 M-QTLs that were mapped using the ultra-high density marker map (Table 3) had a size ran-ging from 0.14 cM to 0.15 cM. For instance, Fig. 5-I, II, III, IV-A, B&C showed plant vigour traits (VIG, 3DL, PH and SDW) in three different genetic maps. It showed that gradually LOD and PVE increased with marker density and simultaneously QTL size decreased, being
fine-tuned down to 300Kb with the ultra- high density marker map. More details on major and minor QTLs for plant vigour in different density genetic maps are pre-sented in Additional files 7, 10and 11. In addition, low density genetic map along with plant vigour traits QTLs position are shown in Additional file12A.
For canopy conductance traits (TR, eTR, T, eT and R-3D/PLA), several QTLs were identified on different link-age groups (CaLG01, LG03, LG04, LG05, LG06, LG07 & LG08) across the genome. A total of 18 and 20 M-QTLs were mapped on different LGs using low and high dens-ity maps, respectively (see more details in Add-itional files10and11). The QTL size ranged from 1 cM to 15.0 cM size in low density map and high density ranged from 0.3 cM to 5.0 cM size (Table 3). Two M-QTLs were mapped on CaLG03 (TR) and just outside the CaLG04“QTL-hotspot” region (eTR) using ultra-high density map. The QTL size ranged from 0.08 cM (TR) to 0.48 cM (eTR) size (Table 3). For TR, three M-QTLs with 5-13 cM were identified on CaLG07 using low density marker (Table 3). In the high density marker, no M-QTL was detected for TR. But, six minor QTLs were identified on CaLG03 (2QTLs; 4.9-5.1 cM), CaLG07 (1QTL; 2.0 cM), CaLG06 (1QTL; 10.3 cM) and CaLG04 (2.3-11.9 cM; Additional file11). On the ultra-high dens-ity map, one M-QTL for TR was mapped on CaLG03 (0.08 cM). For TR, mapping position varied between low and ultra-high density markers. This might be most of the similar alleles between CaLG03 and CaLG07 (Table 3). Similarly for R-3D/PLA (canopy structure), 10 M-QTLs were identified on different linkage groups [CaLG04 (7 M-QTLs; 1.0-8.0 cM), CaLG06 (2 M-QTLs; 11-15 cM) & CaLG07 (1 M-QTL; 2.0 cM)] using low density markers (Table 3 & see more details in Add-itional file 10). For high density markers, 13 M-QTLs were identified on different linkage groups [CaLG04 (7 M-QTLs; 0.3-1.3 cM), CaLG06 (2 M-QTLs; 2.6-4.2 cM), CaLG07 (2 M-QTLs; 2.4-2.6 cM) and CaLG01 (2 M-QTLs; 4.1-4.2 cM)] (Table 3& see more details in Additional file11). There was no QTL was detected with the ultra-high density markers map (Table3). More de-tails of canopy conductance traits major and minor QTLs in different density genetic maps are presented in Additional files 7, 10 and 11. In addition, low density genetic map along with canopy conductance traits QTLs position is shown in Additional file12B, C & D.
Discussion
The summary of the main results is as follows: i) Genetic variation of 16 phenotypic traits revealed two clusters of plant vigour and canopy conductance traits and their as-sociation was clarified with PCA analysis and correl-ation. ii) Using the ultra-high density map, M-QTLs for plant vigour traits predominantly mapped on CaLG04
and these co-mapped with a previously refined “QTL-hotspot” region (~300Kb) for drought tolerance traits. Canopy conductance traits were mapped in CaLG03 (TR) and CaLG04 (eTR). iii) The refined “QTL-hotspot” region (Bin-Map) was further sub-divided into a “QTL-hotspot- a” and “QTL-“QTL-hotspot- b” regions. While both “QTL-hotspot” sub-regions co-mapped with previous study [21], the phenotyping data at a lower level of plant organization gathered here led us to interpret that re-gion ‘a’ (139.22Kb or 0.23 cM) could be a locus for branching and tissue/organ expansive processes while region‘b’ (153.36Kb or 0.22 cM) could be interpreted as a locus for physiological processes related to biomass ac-cumulation. iv) As marker density increased QTL num-ber and size decreased (~ 29 cM to 0.22 cM); and LOD and PVE (%) increased for most of the QTLs. v) Most of plant vigour traits had alleles from high vigour parent ICC 4958 whereas in the case of canopy conductance traits (eTR and TR) the favourable alleles were contrib-uted by the low vigour parent ICC 1882. vi) Plant vigour traits mapped mostly on CaLG04 whereas canopy con-ductance traits mapped on CaLG03, providing an oppor-tunity to manipulate these loci to tailor recombinants having lower transpiration rate and high plant vigour de-sirable for water limited environments.
Phenotyping at different level of plant organization
The vigour traits (3DL, PL, SDW, PH, and 3D-LG) were tightly linked to plant water use traits. These traits were reported to be linked to crop biomass production and then crop yield [25,26]. The co-localization study clearly demonstrated the close relationship between traits from the present study at a lower level of plant organization (eg. 3D-Leaf area, growth rate) and the agronomic traits (eg.shoot biomass, harvest index) studied previously by Varshney et al. [18]. Canopy development traits had also a clear effect on crop production [25]. Although pheno-typing of traits at a lower level of plant organization is usually laborious and time-consuming process, it was fa-cilitated by the use of a high throughput phenotyping platform (LeasyScan). Most of the plant vigour traits had high heritabilities, making them suitable for breeding ap-plications. The high vigour parent ICC 4958 had higher biomass and water use (absolute T) than the low vigour
parent ICC 1882. By contrast, the high vigour parent had lower transpiration rate (TR; g of water transpired per unit of leaf area) than low vigour parent. Hence, the cause for such response in water-use was the difference in leaf area (vigour/canopy development). The effect of such combination, having high vigour and lower TR would be then of high value to test across time and geo-graphical scale using crop simulation analysis. Crop simulation modelling of water saving traits (eg. limited transpiration rate) has indeed shown a clear yield advan-tage under terminal drought stress conditions (Soybean-[27], Maize-[28] and Sorghum-[15]).
Co-localization of plant vigour traits and previously identified drought tolerance traits in different genetic maps
Early plant vigour is an important trait for water limited environments. It may contribute to shading of the soil surface, thereby reducing evaporation of water from the soil and leaving more water available for the crop [25, 29, 30]. In the present study, most of the plant vigour traits had several M-QTLs on CaLG04 and co-mapped with the earlier reported fine mapped“QTL hotspot” re-gion [18, 20, 21] with QTLs for root traits. The alleles for these vigour traits were contributed by high vigour parent ICC 4958. Here is a first detailed study reporting the co-mapping of plant vigour traits with root and so-called drought tolerance traits. This is also a confirm-ation of the earlier observconfirm-ations that shoot dry weight and root length density QTL co-mapping in preliminary results [22]. This result, therefore, suggests that the drought tolerance reported earlier to be associated with that QTL in the hotspot region (241 Low density SSR marker-[18]; 1007-High density GBS markers-[20] and Ultra-high density Bin maps-[21]) would actually be conferred by plant vigour aspects. Such result was also predicted by a crop simulation study [31] that concluded that in the short duration environments where chickpea cultivation is now mostly cultivated, a high plant vigour associated with faster rooting would be necessary to reach the water available deep in the soil profile. Simi-larly, in recent pearl millet mapping studies [32, 33] it was reported that plant vigour traits also co-localized with agronomic traits related to terminal drought
(See figure on previous page.)
Fig. 4 QTL co-localization of plant vigour and drought tolerance related traits using different density markers. Comparison of genomic region with harboring QTLs for various plant vigour and canopy conductance related traits (present study) and drought tolerance traits using 241 SSR-low density marker (Varshney et al. 2014), 1007 SSR + SNP high density marker (Jaganathan et al. 2015) and 1557-SNPs Ultra-high density marker (Kale et al. 2015) identified on CaLG04. The graph 4-I-A, 4-II-A & 4-III-A represent the QTLs identified for various plant vigour and canopy conductance related traits. The graph 4-I-B represent CaLG04 of consensus genetic map; 4-II-B represent CaLG04 of the fine genetic map (Genotype by sequence, GBS approach) and 4-III-B represent CaLG04 of fine bin map (Skim sequencing approach). The graph 4-I-C, 4-II-C & 4-III-C represent QTLs identified for various drought tolerance traits from previous studies. Common QTL regions for both plant vigour and canopy conductance (Present study) and drought tolerance related traits (Varshney et al. 2014; Jaganathan et al. 2015 and Kale et al. 2015) were highlighted in red/pink
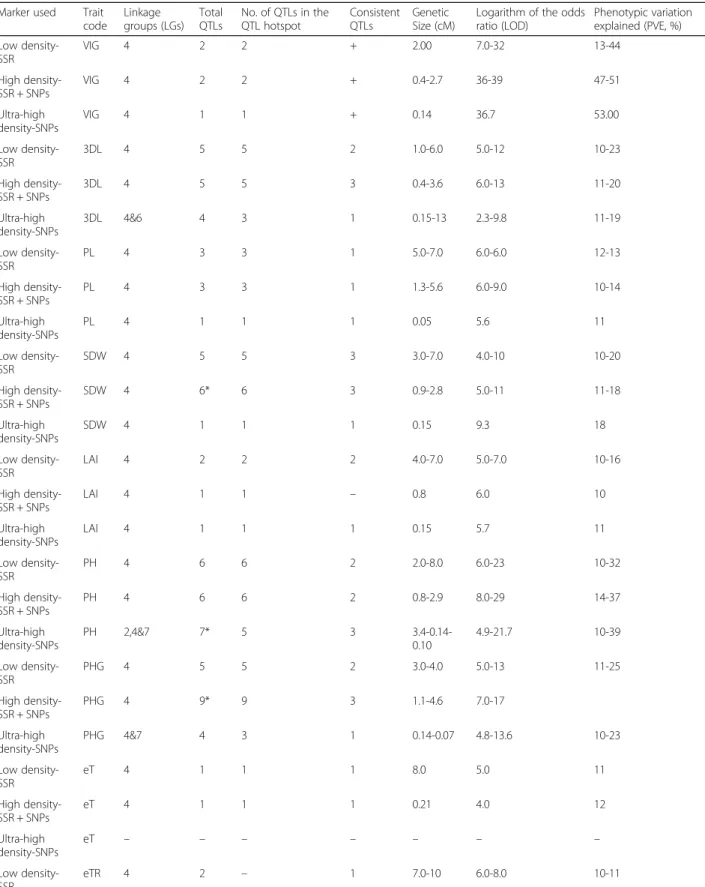
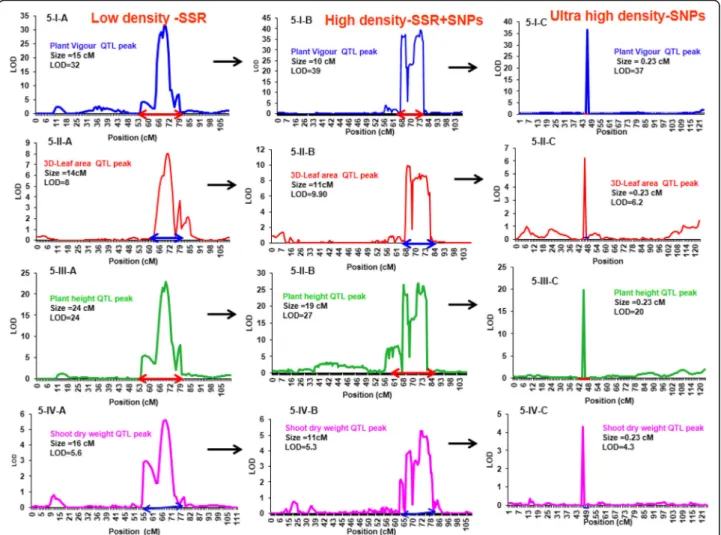
Table 3 Summary of Major-QTLs (M-QTLs) for plant vigour and canopy conductance related traits using different genetic map. Low density (241 SSR marker-Varshney et al. 2014); high density (1007 SSR + SNP marker- Jaganathan et al. 2015) and ultra-high density (1557 SNP markers- Kale et al. 2015) markers were used for identification of QTLs. The trait on only measured at 2015 indicates (+) and newly identified additional QTLs with high density markers were indicated by (*). Details of traits code were mentioned in Table1
Marker used Trait code Linkage groups (LGs) Total QTLs No. of QTLs in the QTL hotspot Consistent QTLs Genetic Size (cM)
Logarithm of the odds ratio (LOD) Phenotypic variation explained (PVE, %) Low density-SSR VIG 4 2 2 + 2.00 7.0-32 13-44 High density-SSR + SNPs VIG 4 2 2 + 0.4-2.7 36-39 47-51 Ultra-high density-SNPs VIG 4 1 1 + 0.14 36.7 53.00 Low density-SSR 3DL 4 5 5 2 1.0-6.0 5.0-12 10-23 High density-SSR + SNPs 3DL 4 5 5 3 0.4-3.6 6.0-13 11-20 Ultra-high density-SNPs 3DL 4&6 4 3 1 0.15-13 2.3-9.8 11-19 Low density-SSR PL 4 3 3 1 5.0-7.0 6.0-6.0 12-13 High density-SSR + SNPs PL 4 3 3 1 1.3-5.6 6.0-9.0 10-14 Ultra-high density-SNPs PL 4 1 1 1 0.05 5.6 11 Low density-SSR SDW 4 5 5 3 3.0-7.0 4.0-10 10-20 High density-SSR + SNPs SDW 4 6* 6 3 0.9-2.8 5.0-11 11-18 Ultra-high density-SNPs SDW 4 1 1 1 0.15 9.3 18 Low density-SSR LAI 4 2 2 2 4.0-7.0 5.0-7.0 10-16 High density-SSR + SNPs LAI 4 1 1 – 0.8 6.0 10 Ultra-high density-SNPs LAI 4 1 1 1 0.15 5.7 11 Low density-SSR PH 4 6 6 2 2.0-8.0 6.0-23 10-32 High density-SSR + SNPs PH 4 6 6 2 0.8-2.9 8.0-29 14-37 Ultra-high density-SNPs PH 2,4&7 7* 5 3 3.4-0.14-0.10 4.9-21.7 10-39 Low density-SSR PHG 4 5 5 2 3.0-4.0 5.0-13 11-25 High density-SSR + SNPs PHG 4 9* 9 3 1.1-4.6 7.0-17 Ultra-high density-SNPs PHG 4&7 4 3 1 0.14-0.07 4.8-13.6 10-23 Low density-SSR eT 4 1 1 1 8.0 5.0 11 High density-SSR + SNPs eT 4 1 1 1 0.21 4.0 12 Ultra-high density-SNPs eT – – – – – – – Low density-SSR eTR 4 2 – 1 7.0-10 6.0-8.0 10-11
tolerance [34]; drought index of stover yield, grain yield, biomass yield and harvest index [35–37]. Similarly, an-other study in a high- resolution cross (HRC) population of pearl millet showed that plant vigour traits (3D-leaf area, plant growth rate, plant height) measured from LeasyScan co-localized with yield traits measured in the field under different water stress treatments (Tharanya et al-unpublished data. The present study suggests that high root length density obtained earlier [18] could be more easily proxied by vigour traits at the canopy level, which would then ease the phenotyping of that particu-lar trait. Overall, plant vigour traits might lead to high biomass, which would then link to higher yield potential. Therefore, the genotypes that have alleles from ICC 4958 would be beneficial for water limited conditions.
Binmap QTL hotspot region
With the ultra-high density marker, the refined QTL-hotspot was sub-divided into two sub-regions “QTL-hotspot”-“a” & “QTL-hotspot”-“b”. Our interpretation, on the basis of the phenotyping at a lower level of plant organization done in the present study, is that these two regions could control two domains of physiological processes. “QTL-hotspot”-“a” region, which had QTL for traits related to vigour and growth rate (PH and VIG), could be interpreted as a region
coding for branching and expansive processes. We in-terpret the possible effect on the branching from the two fairly opposite phenotypes of the parents of the population used here, i.e. highly branched ICC 1882 with low height versus less branched but taller ICC 4958. More work would be needed to decipher in more details the possible interaction between height and branching. The interpretation of the expansive processes comes from recent genetic work on regions controlling leaf expansion in maize [38], and where vigour could simply be consequences of differences in the expansive processes leading to larger organ sizes and quicker development. Interestingly, this region ‘a’ was earlier reported to harbour QTL for pod number per plant, 100-seed weight and plant height [21], al-though a finer analysis of the plant processes possibly involved was not done. It was particularly interesting to see that this region led to seed size differences, which then raises the question whether seed size is not itself controlled by expansive processes at the time of embryo development and seed formation. “QTL-hot-spot”-“b” region could then simply be a locus control-ling physiological processes involved in biomass accumulation, which was corroborated by the QTLs found here for 3DL, LAI and SDW, or for biomass traits SDW and RTR traits in Kale et al. [21].
Table 3 Summary of Major-QTLs (M-QTLs) for plant vigour and canopy conductance related traits using different genetic map. Low density (241 SSR marker-Varshney et al. 2014); high density (1007 SSR + SNP marker- Jaganathan et al. 2015) and ultra-high density (1557 SNP markers- Kale et al. 2015) markers were used for identification of QTLs. The trait on only measured at 2015 indicates (+) and newly identified additional QTLs with high density markers were indicated by (*). Details of traits code were mentioned in Table1(Continued)
Marker used Trait code Linkage groups (LGs) Total QTLs No. of QTLs in the QTL hotspot Consistent QTLs Genetic Size (cM)
Logarithm of the odds ratio (LOD) Phenotypic variation explained (PVE, %) High density-SSR + SNPs eTR 3&4 4* 3 2 2.0-5.0 3.0-6.0 11-14 Ultra-high density-SNPs eTR 4 1 – 1 0.48 5.7 11 Low density-SSR T 4&8 2 1 1 6.0-8.0 5.0 12-14 High density-SSR + SNPs T 5&8 2 – – 2.9-3.5 3.0-6.0 10-14 Ultra-high density-SNPs T – – – – – – – Low density-SSR TR 7 3 – 1 5.0-13 3.0-5.0 10-17 High density-SSR + SNPs TR – – – – – – – Ultra-high density-SNPs TR 3 1 – – 0.08 5.1 10 Low density-SSR R-3D/ PLA 4, 6 &7 10 – 5 1.0-15.0 6.0-13 10-15 High density-SSR + SNPs R-3D/ PLA 1,4, 6&7 13* 1 4 0.3-4.2 7.0-14 10-16 Ultra-high density-SNPs R-3D/ PLA – – – – – –
Twelve candidate genes were reported from this fine mapped“QTL hotspot” region (see, [21]) stating that most of the genes were involved in abiotic stress tolerance. The same genes were also reported to be associated with plant growth and development related functions (e.g. genes of serine threonine-protein kinases, E3 ubiquitin ligases, Leucine-rich repeat extension (LRXs), Protein IQ domain and Vicilin 47 K and Cotyledon vascular pattern (CVP2) genes that were reported to be associated with drought stress adaptation by Kale et al., [21] were also reported to be associated with plant growth and development related process [39–48]. These reports additionally suggest that earlier reported “QTL-hotspot” region to be associated more likely with vigour related traits.
Ideotyping of plant vigour and canopy conductance genomic regions
An ideal ideotype for water limited environment would be the one having higher plant vigour (the proxy for
higher biomass and yield) potential with restriction of transpiration under high VPD conditions. These combi-nations would achieve higher water use efficiency, even-tually soil moisture conservation, and then ultimately lead to crop production success. The plant vigour traits were mapped on CaLG04 and the canopy conductance (eg. TR) traits were present on CaLG03. These two gen-omic regions contributed more than 75% QTLs for plant water use (vigour and conductance) traits. Therefore, CaLG04 (plant vigour) and CaLG03 (canopy conduct-ance) provide an opportunity to manipulate these loci to tailor recombinants having alleles with lower transpir-ation rate along with high plant vigour. This ideotype might be useful in enhancing the water stress adaptation in chickpea. Similar kind of ideotyping was recom-mended in pearl millet [32, 33]. Recent modelling re-ports on sorghum [15] showed that alteration of leaf area (plant vigour components) and transpiration rate increased grain yield under severe stress conditions. This
Fig. 5 Comparison of M-QTL size for plant vigour related traits using different density markers. Evaluation of M-QTL size performed by using dif-ferent density markers [A) 241-SSR-Low density marker (Varshney et al. 2014), 1007-SSR + SNPs-high density marker (Jaganathan et al. 2015) and C) 1557-SNPs-Ultra high density (Kale et al. 2015)] on derived mapping population ICC 4958 x ICC 1882. Figure5-I represent plant vigour QTL peak; 5-II represent 3D-leaf area peak; 5-III represent plant height QTL peak and 5-IV represent shoot dry weight QTL peak
study suggests that plant vigour and transpiration rate trait assessed in the current study might also have an ef-fect on crop production success in specific target environments.
Conclusion
The present study has shown that a previously identified “QTL hotspot” region on LG04 of chickpea and harbour-ing QTL for root traits and so-called terminal drought tol-erance in chickpea was a vigor locus, with favourable alleles from high vigour parent ICC 4958. Our phenotypic analysis at a lower level of plant organization led us to in-terpret that this locus may be divided into two sub-regions, one coding for expansive processes and one for biomass accumulation. Another genomic region on CaLG03 harboured QTL for canopy conductance traits (e.g. TR). Plant vigour and canopy conductance traits were somewhat negatively related but being mapped on differ-ent chromosome provides an opportunity to manipulate these loci to tailor recombinants having lower transpir-ation rate and high plant vigour which would be useful en-hancing the drought adaptation in chickpea. In addition, potential genomic region on CaLG04 with simple vigour traits (e.g vigour score) could be used for breeding pro-grams through marker assisted backcross (MAB) to devo-lep improved variety. Enrichment of the marker density reduced QTL size and increased in LOD and PVE% for all plant vigour and canopy conductance traits.
Methods
Plant material
The genetic material was a set of 232 recombinant inbred lines from a population derived by single seed descent method from the cross between ICC 4958 and ICC 1882 and advanced to F10+ generation [18]. Genotype ICC 4958 is a drought tolerant breeding line developed by Jawaharlal Nehru Krishi Vishwa Vidyalaya, Jabalpur, and Madhya Pradesh, India. It has a large root system, early vigour is early to reach 50% of flowering (608 cumulative degrees) and maturity (1650 cumulative degrees). The ICC 1882 landrace was collected in India and added to the ICRISAT’s genebank in 1973. It has a small root sys-tem, late vigour, is later to reach 50% of flowering (779 cu-mulative degrees) and maturity (1806 cucu-mulative degrees) compared to ICC 4958 [8, 18, 49]. These two parental lines were contrasting for root traits and plant vigour i.e. were used for mapping population development. Add-itional detail account on parental lines and mapping popu-lation are provided in Varshney et al. [18].
Crop Phenotyping Plant growth conditions
Phenotyping was performed from November to Decem-ber 2014 & 2015 in the LeasyScan facility [23]. Plants
were sown during the post-rainy chickpea sowing win-dow (November). Plants were grown in 27 cm diameter plastic pots filled initially with 9 kg of dry black soil (Vertisol) collected from ICRISAT farm. Each experi-mental unit in the LeasyScan platform was composed of 2 pots, each containing 4 healthy plants. These experi-mental units being of 65 × 40 cm, i.e. approximately 0.25 m2, the sowing density was 32 plant m− 2, which is equivalent to the sowing density in the field. In other words, phenotyping was done on a crop canopy that had close similarities with a field situation. Sowing was done with 6-8 seeds per pot and seedlings were thinned to maintain four homogeneous seedlings per pot at 12 days after sowing (DAS). Fertilizers were provided with single super phosphate (SSP) as basal dose at the rate of 0.3 g/ kg of soil. The experimental design was an Alpha lattice with 4 replications and 24 blocks of 10 genotypes in each replication to avoid geographical variations. Plants were maintained under well water conditions the throughout experiment. During the crop grown period, 11/35.8 °C minimum and maximum temperature and 17.2/93.2% relative humidity were observed.
Phenotypic traits evaluated
Sixteen phenotypic traits were measured and categorized into three groups: (i) Canopy traits (measured by Lea-syScan) (ii) Transpiration traits (measured by gravimet-ric balance system) and (iii) Biomass traits.
i) Canopy traits LeasyScan PlantEye®
scanners measured canopy development related traits [3DLeaf area (3D-L), projected leaf area (PL) and plant height (PH)] on the hourly basis during crop growth periods. Using these traits, plant growth rate related traits [3D-Leaf area growth rate (3D-LG), projected leaf area growth rate (PLG), plant height growth rate (PHG)] were calculated. Plant growth rate (3DLG, PLG, PHG) was calculated based on the average difference in respective leaf area and plant height between consecutive days during the expo-nential growth phase. The leaf area index (LAI) was esti-mated as the projected leaf area PL divided by the area of the pots in the sector. Plant vigour score was estimated by visual eye basis, on a scale from 1 (low vigour) to 5 (high vigour) at 20 DAS after sowing, all four replications being scored by one person eye visual score. Similar protocal was reported in other crop species such as wheat [50] and maize [51]. Residual (canopy structure) was calculated by using 3D-leaf area and projected leaf area.
ii) Transpiration traits Transpiration (evapotranspir-ation (eT)) was measured by a gravimetric method (see [32]). The pots were watered abundantly and drained overnight to attain field capacity. An extra 20 pots without plants were also brought to field capacity and were
there to evaluate soil evaporation. Following day, plants were manually weighed (Model FCB 24 K0.2B, KERN & Sohn GmbH, Baligen, Germany.). All four replications were weighed between 6 and 7 am (Initial weight; average VPD~ 0.8 kPa). Pots were weighed again late afternoon between 3 and 4 pm (final weight; average VPD ~ 3.76 kPa), following the same sequence of pot weighing as in the morning. Evapo-transpiration was calculated by the difference between initial and final pot weight. Further, plant transpir-ation (T) was estimated by subtracting an estimate of soil evaporation (pot without plant soil evaporation). Briefly, it was assumed that soil evaporation in planted pot would be maximum with zero plant cover, and would be zero at a leaf area index of 2.
Therefore, the projected leaf area was used to infer a LAI. Briefly,
LAI = PL/area of the pots in the sector.
At the time of eT measurements and transpiration values were estimated from this correction. While this may have induced some error, we made the assumption the method would be correct for genotypic comparison and QTL ana-lysis. Transpiration rate (TR) and evapotranspiration rate (eTR) were calculated by transpiration and evapotranspir-ation divided by 3D-leaf area and time [52].
iii) Biomass traits At the end of the experiment (can-opy covered maximum in the pot; 35 DAS), shoot sam-ples were harvested and over dried at 65 °C for 48 h. Further, shoot dry weights (SDW) were weighed using gravimetric balance (KERN 3Kg) method. Specific leaf area (SLA) was estimated by leaf area divided by shoot dry weight. Specific leaf weight (SLW) was estimated by 1/SLA (inverse of SLA).
QTL analysis- single locus
QTL analysis was conducted independently using three genetic maps developed earlier [18,20,21] and phenotyp-ing data generated in this study. QTL Cartographer version 2.5, composite interval mapping (CIM) method was employed [53]. For ultra-high density bin markers, inclusive composite interval mapping-Additive mapping (ICIM-ADD) method was used for identification of QTLs using IciMapping software (v3.2; [54]). LOD threshold was set by using 1000 permutation and p value ≤0.05. Constructed linkage map was visualized using Mapchart 2.2 [55] soft-ware. When the PVE (phenotypic variation explained) was above 10%, QTLs were considered major QTLs (M-QTLs) and PVE below 10% were minor QTLs.
Interactions QTL analysis-multi-loci
The QTL interactions influencing the traits were identified using Genotype Matrix Mapping software (GMM; v. 2.1; [56], http://www.kazusa.or.jp/GMM). Using GMM, two
and three loci interactions were tested. GMM analysis showed interactions between loci and different linkage groups of plant vigour and canopy conductance related traits. The current study identified allelic interactions that contributed to either a positive (increase) or negative (de-crease) effect on the phenotypic value of the trait. In most cases, single locus QTL identified using GMM analysis were similar to those identified with CIM analysis, even though two approaches use different algorithms. In the fol-lowing text, symbols“AA”, “BB” and “stand for alleles origi-nated from the high vigour parent (AA; ICC 4958) and low vigour parent (BB; ICC 1882)” and not distinguished from any parent (−), respectively.
Statistical analysis
To find the phenotypic variations and their significance in the population, ANOVA was performed for all observed pa-rameters individually using GENSTAT 14.0 (VSN Inter-national Ltd., Hemel Hempstead, UK). Similarly, to find the phenotypic variations and their significance in parental lines were analyzed with statistical program package CoStat ver-sion 6.204 (Cohort Software, Monterey, CA, USA). One-way ANOVA was carried out to test for genotypic difference between the genotypes. Means were compared using Tukey-Kramer test and Least Significant Difference (atP ≤ 0.05). Normal histograms with frequency distribution ana-lysis for phenotypic traits were done using SPSS 16 desktop version (IBM, SPSS Statistical software). Principal compo-nent analysis (PCA) was used to visualize the relationships between traits in a multidimensional space using R software (version 2.11.1). To find the trait correlation of all pheno-typic traits, simple Pearson correlation was performed using R software (version 2.11.1). For QTL and PCA analysis, Best Linear Unbiased Predictors (BLUPs) data were estimated by using GENSTAT 14.0 were used. The clustering analysis was performed by PCA loadings using R software (version 2.11.1). Genotypic and residuals mean square components were obtained from ANOVA through GENSTAT 14.0, which was used to calculate the broad sense heritability (h2). The broad-sense heritability (h2) was calculated as h2
=σ 2G/ (σ2
G +σ2E) [31,32], whereσ2G is the genetic vari-ance andσ2E is the error variance.
Additional files
Additional file 1:Cluster dendrogram analysis for collected phenotypic traits. Cluster analysis performed by major principal components using R-package. Two clusters (1 and 2) were shown on plant vigour traits and canopy conductance traits. (PPTX 55 kb)
Additional file 2:Frequency distribution of plant vigour and canopy conductance related traits. Frequency distribution of plant vigour (A, B, C & D) and canopy conductance (E, F, G & H) related traits in chickpea mapping population (ICC 4958 x ICC 1882) showing normal distribution. A, B, C & D represent the plant vigour, plant height, 3D-leaf area and shoot dry weight (Plant vigour related traits) and E,
F, G & H represent transpiration rate, evapotranspiration rate, transpiration and evapotranspiration (Canopy conductance related traits). P1 and P2 represent the ICC 4958 and ICC 1882). (PPTX 220 kb)
Additional file 3:Growth dynamics of canopy development in contrasting parental lines. Growth dynamics of A) 3-leaf area and B) plant height in contrasting parental lines [High vigour parent (ICC 4958) and low vigour parent (ICC 1882) at vegetative stage calculated on the basis of thermal time (228-806 degree days for A and 114-806 degree days for B). (PPTX 181 kb)
Additional file 4:Trait correlation analysis for the plant vigour and canopy conductance related traits. All the traits were evaluated under high throughput plant phenotyping platform (LeasyScan). (XLSX 10 kb)
Additional file 5:Graphical representation of principal component analysis (PCA) for plant vigour and canopy conductance related traits. The plant vigour and canopy conductance traits vectors are represented by red arrows. The numbers represent recombinant inbred lines numbers (RIL numbers) and its position represents the particular trait loadings with respect to PC1 and PC2. BLUPs data across years were used for PCA analysis. (PPTX 117 kb)
Additional file 6Details on principal component analysis (PCA) for plant vigour and canopy conductance traits. (XLSX 10 kb)
Additional file 7:Summary of QTLs for plant vigour and canopy conductance related traits using ultra-high density map. The QTLs were identified using ICIM (QTL IciMapping) software on ICC 4958 × ICC 1882 derived mapping population. (XLSX 12 kb)
Additional file 8:Selected E-QTL interactions for plant vigour and can-opy conductance traits. The E-QTLs were identified using genotype matrix mapping (GMM) software on ICC 4958 × ICC 1882 derived map-ping population. (XLSX 12 kb)
Additional file 9:Summary of E-QTL interactions for plant vigour and canopy conductance traits. The E-QTLs were identified using genotype matrix mapping (GMM) software on ICC 4958 × ICC 1882 derived mapping population. (XLSX 24 kb)
Additional file 10:Summary of QTLs for plant vigour and canopy conductance related traits using low density marker. The QTLs were identified using QTL Cartographer software on ICC 4958 × ICC 1882 derived mapping population. (XLSX 17 kb)
Additional file 11:Summary of QTLs for plant vigour and canopy conductance related traits using high density marker. The QTLs were identified using QTL Cartographer software on ICC 4958 × ICC 1882 derived mapping population. (XLSX 20 kb)
Additional file 12:Genetic map of chickpea RIL population derived from ICC 4958 x ICC 1882. The genetic map represents marker position and corresponding marker name in linkage group. Genetic distances (cM) were shown on the left and markers are shown on the right side of the bars. The map was constructed using Map chart software. The Q represents QTL and R3 represents the population name. Year of mapping was represented by the symbols: # (2014), + (2015) and $ (across the year). A represent CaLG04 with identified QTLs position and its corresponding marker. The markers of the QTLs regions within the hotspot (most plant vigour related traits) were represented in red and outside the hotspot were represented in pink (QR3R-3D/PLA # + $), green (QR3-eTR+ $) and brown (QR3R-3D/PLA $). B) Map represents CaLG07 with QTLs for transpiration rate (QR3-TR) (markers highlighted in red colour) and residuals from 3D and projected leaf area (QR3R-3D/PLA) (markers highlighted in pink colour). C) Map represents CaLG06 with QTLs for residuals from 3D and projected leaf area (QR3R-3D/PLA) (markers highlighted in red colour). D) Map represents CaLG08 with QTLs for transpiration (QR3-T) (markers highlighted in red colour). (ZIP 283 kb)
Abbreviations
ANOVA:Analysis of variance; BLUPs: Best linear unbiased predictions; CIM: Composite interval mapping; DAS: Days after sowing; E-QTLs: Epistatic QTLs; GBS: Genotype by sequencing; GMM: Genotype matrix mapping;
h2: Heritability; ICIM-ADD: Inclusive composite interval mapping-Additive
mapping; LG: Linkage group; LOD: Logarithm of odds; LSD: Least significant difference; M-QTLs: Major QTLs; PCA: Principal component analysis; PVE: Phenotypic variation explained; QTL: Quantitative trait loci; RILs: Recombinant inbred lines; SNPs: Single nucleotide polymorphisms; SSRs: Simple sequence repeats
Acknowledgements
The authors acknowledge Dr.Grégoire Hummeland Dr. Uladzimir Zhokavets from Phenospex for co-designing the LeasyScan platform with Dr. Vincent Vadez. Thanks, Mr. P.V.D Maheswar Rao and Mr. M. Anjaiah for their help in planting, irrigation and crop management practices.
Funding
This research was financially supported by ICRISAT for the capital investment in the LeasyScan facility and Blue Sky Research Project on“Developing crops with high productivity at high temperatures”. Additional funds were provided by CGIAR Research Program (CRP) on Grain Legumes. Availability of data and materials
All data generated or analyzed during this study are included in the supplementary files as well as in the manuscript.
Authors’ contributions
VV and JK - conceived and designed the experiments; KS, MT1 (Murugesan Tharanya), MHH, RB Performed the experiments; KS, MT1, JK and VV Analyzed the phenotypic data; RKV, MT2 (Mahendar Thudi), KS, SMK, DJ -Genotypic data sharing and analysis; PMG - Mapping population
development and seed materials; KS, VV, JK, MT1, MT2 -wrote the paper; VV, JK, MT2, RKV and TT - Manuscript review; All authors read the MS and provided their consent; All authors read and approved the final manuscript. Authors’ information
Vincent Vadez is working as Principal Scientist and Theme Leader– System Analysis for Climate Smart Agriculture (for more details see
www.gems.icrisat.org) at ICRISAT in India, and now a Principal Scientist at IRD (Institut de Recherche pour le Developpement), Montpellier, France. He focuses mainly on phenotyping for drought adaptive traits in different legume and cereal crops. In addition, he has expertise in crop modelling of various drought adaptive traits and their possible production benefits in SAT agro-ecologies. He has collaborators across disciples from various inter-national institutes.
Kaliamoorthy Sivasakthi is a Research Scholar pursuing his PhD in Crop Physiology Laboratory at ICRISAT in India. His Ph.D. work mainly focuses on Contribution of water saving traits for drought adaptation in chickpea (Cicer arietinum L.) through Physiological, Molecular and Genetics approaches. Mahendar Thudi is currently working as Senior Scientist (Chickpea Genomics) at ICRISAT in India and leading the genomics and molecular breeding activities of chickpea. He developed large genetic and genomic resources in chickpea. Played a significant role in the generation of genome sequence of chickpea and re-sequencing of ~ 500 chickpea genotypes. Murugesan Tharanya is a Research Scholar pursuing her PhD in Crop Physiology Laboratory at ICRISAT in India. Her Ph.D. work focuses mainly on “Contribution of water saving traits for drought adaptation in Pearl Millet (Pennisetum glaucum (L.) R. Br.) through Physiological, Molecular and Genetics approaches”.
Sandip M Kale is currently working as Visiting Scientist at Center of Excellence in Genomics at ICRISAT in India.
Jana Kholova` is currently working as Senior Scientist in System Analysis for Climate Smart Agriculture (SACSA) team at ICRISAT in India. She is mainly focuses on phenotyping for drought adaptive traits in semi-arid crops (Sor-ghum, Pearl millet, Chickpea etc.). In addition, she is expertise in APSIM crop modelling for various drought adaptive traits and their possible productions benefits in SAT agro-ecologies.
Mahamat Hissene Halime is a Research Fellow and completed her PhD in Crop Physiology Laboratory at ICRISAT in India.
Deepa Jaganathan is Research scholar and completed her PhD in Center of Excellence in Genomics at ICRISAT in India.
Rekha Baddum is working as Scientific Officer in Crop Physiology Laboratory at ICRISAT in India.
Thiyagarajan Thirunalasundari is working as Professor and Head, Department of Industrial Biotechnology, Bharathidasan University at Tiruchirappalli in India.
Pooran M. Gaur is Principal Scientist (Chickpea Breeding) at ICRISAT in India. He has extensive expertise on chickpea mapping population development and marker assisted breeding.
Rajeev K Varshney is Research Program Director– Genetic Gains at ICRISAT in India. Heis internationally recognized for his contribution in genome sequencing of pigeonpea, chickpea, peanut, pearl millet, sesame, mungbean and azuki bean and development of molecular breeding products. Ethics approval and consent to participate
Not applicable– Data were generated from our own trials. The genetic material that was tested was readily available at ICRISAT and did not required us any kind of permit or request.
Consent for publication Not applicable Competing interests
The authors declare that they have no competing interests.
Publisher’s Note
Springer Nature remains neutral with regard to jurisdictional claims in published maps and institutional affiliations.
Author details
1
International Crops Research Institute for the Semi-Arid Tropics (ICRISAT), Greater Hyderabad, Telangana, India.2Bharathidasan University,
Tiruchirappalli, Tamil Nadu, India.3Institut de Recherche pour le
Developpement (IRD), Université de Montpellier– UMR DIADE, 911 Avenue Agropolis, BP 64501, 34394 Montpellier cedex 5, France.
Received: 13 July 2017 Accepted: 21 January 2018
References
1. FAOSTAT. FAOSTAT database. Available athttp://faostat3.fao.org/compare/E
(2014). Accessed 25 Mar 2017.
2. Krishnamurthy L, Kashiwagi J, Gaur PM, Upadhyaya HD, Vadez V. Sources of tolerance to terminal drought in the chickpea (Cicer arietinum L.) minicore germplasm. Field Crop Res. 2010;119:322–30.
3. Ahmad F, Gaur PM, Croser J. Chickpea (Cicer arietinum L.) In: Singh RJ, Jauhar PP, editors. Genetic resources, chromosome engineering, and crop improvement-grain legumes, vol. 1. Boca Raton: CRC press; 2005. p. 187–217. 4. Ludlow MM, Muchow RC. A critical evaluation of traits for improving crop
yields in water-limited environments. Adv Agron. 1990;43:107–53. 5. Silim SN, Saxena MC. Adaptation of spring-sown chickpea to the Mediterranean
basin. I. Response to moisture supply. Field Crop Res. 1993;34:121–36. 6. Subbarao GV, Johansen C, Slinkard AE, Rao RCN, Saxena NP, Chauhan YS.
Strategies for improving drought resistance in grain legumes. Crit Rev Plant Sci. 1995;14:469–523.
7. Turner NC, Wright GC, Siddique KHM. Adaptation of grain legumes (pulses) to water-limited environments. Adv Agron. 2001;71:193–231.
8. Kashiwagi J, Krishnamurthy L, Upadhyaya HD, Krishna H, Chandra S, Vadez V, Serraj R. Genetic variability of drought-avoidance root traits in the mini-core germplasm collection of chickpea (Cicer arietinum L.). Euphytica. 2005;146:213–22.
9. Zaman-Allah M, Jenkinson DM, Vadez V. Chickpea genotypes contrasting for seed yield under terminal drought stress in the field differ for traits related to the control of water use. Funct Plant Biol. 2011a;38:270–81.
10. Zaman-Allah M, Jenkinson DM, Vadez V. A conservative pattern of water use, rather than deep or profuse rooting, is critical for the terminal drought tolerance of chickpea. J Exp Bot. 2011b;62:4239–52.
11. Vadez V, Kholova J, Zaman-Allah M, Belko N. Water: the most important ‘molecular’ component of water stress tolerance research. Funct Plant Biol. 2013;40:1310–22.
12. Borrell AK, Mullet JE, George-Jaeggli B, van Oosterom EJ, Hammer GL, Klein PE, Jordan DR. Drought adaptation of stay-green sorghum is associated with canopy development, leaf anatomy, root growth, and water uptake. J Exp Bot. 2014;65:6251–63.
13. Vadez V, Kholova J, Medina S, Kakkera A, Anderberg H. Transpiration efficiency: new insights into an old story. J Exp Bot. 2014;65:6141–53. 14. Messina C, Sinclair T, Hammer G, Mclean G, Olerz, Thompson J, Van
Ooesteroom E, Gho C, Cooper M. Developing drought tolerant maize hybrids for the US corn-belt: Discovery to product. Inter-Drought-IV Conference, 2-6, September, 2013. Crown Perth, Western Australia. 15. Kholova J, Murugesan T, Kaliamoorthy S, Malayee S, Baddam R, Hammer GL,
Mclean G, Deshpande S, Hash CT, Craufurd PQ, et al. Modelling the effect of plant water use traits on yield and stay-green expression in sorghum. Funct Plant Biol. 2014;41:1019–34.
16. Thudi M, Gaur PM, Krishnamurthy L, Mir RR, Kudapa H, Fikre A, Kimurto P, Tripathi S, Soren KR, Mulwa R, Bharadwaj C, Datta S, Chaturvedi SK, Varshney RK. Genomics assisted breeding for drought tolerance in chickpea. Funct Plant Biol. 2014;41:1178–90.
17. Gaur PM, Thudi M, Srinivasan S, Varshney RK. Advances in chickpea genomics. In: Gupta S, Nadarajan N, Gupta DS, editors. Legumes in the Omic era. New York: Springer; 2014b. p. 73–94.
18. Varshney R, Thudi M, Nayak S, Gaur P, Kashiwagi J, Krishnamurthy L, et al. Genetic dissection of drought tolerance in chickpea (Cicer arietinum L.). Theor Appl Genet. 2014;127:445–62.
19. Varshney RK, Gaur PM, Chamarthi SK, Krishnamurthy L, Tripathi S, Kashiwagi J, Samineni S, Singh VK, Thudi M, Jaganathan D. Fast-track introgression of “QTL-hotspot” for root traits and other drought tolerance traits in JG 11, an elite and leading variety of chickpea. Plant Genome. 2013b; 6: doi:https:// doi.org/10.3835/plant genome2013.07.0022.
20. Jaganathan D, Thudi M, Kale S, Azam S, Roorkiwal M, Gaur PM, Kavikishor PB, Nguyen H, Sutton T, Varshney RK. Genotyping-by-sequencing based intra-specific genetic map refines a“QTL-hotspot” region for drought tolerance in chickpea. Mol Gen Genomics. 2015;290:559–71. 21. Kale SM, Jaganathan D, Ruperao P, Chen C, Punna R, Kudapa H, et al.
Prioritization of candidate genes in“QTL-hotspot” region for drought tolerance in chickpea (Cicer arietinum L.). Sci Rep. 2015;5:15296.
22. Chandra S, Buhariwalla HK, Kashiwagi J, Harikrishna S, Sridevi R, Krishnamurthy L, Serraj R, Crouch JH. Identifying QTL-linked markers in marker-deficient crops. In: Fischer T et. Editors. New directions for a diverse planet, Proceedings Fourth International Crop Science Congress, 2004; Brisbane, Australia.http://www. cropscience.org.au/icsc2004/poster/3/4/1/795_chandras.htm
23. Vadez V, Kholová J, Hummel G, Zhokhavets U, Gupta SK, Hash CT. LeasyScan: a novel concept combining 3D imaging and lysimetry for high-throughput phenotyping of traits controlling plant water budget. J Exp Bot. 2015;https://doi.org/10.1093/jxb/erv251.
24. Robinson HF, Comstock RE, Harvey PH. Estimates of heritability and the degree of dominance in corn. JAgron. 1949;41:353–9.
25. Botwright TL, Condon AG, Rebetzke GJ, Richards RA. Field evaluation of early vigour for genetic improvement of grain yield in wheat. Aust J Agric Res. 2002;53:1137–45.
26. Condon AG, Richards RA, Rebetzke GJ, Farquhar GD. Breeding for high water use efficiency. J Exp Bot. 2004;55:2447–60.
27. Sinclair TR, Messina CD, Beatty A, Samples M. Assessment across the United States of the benefits of altered soybean drought traits. J Agron. 2010;102:475–82. 28. Messina CD, Sinclair TR, Hammer GL, Curan D, Thompson J, Oler Z, Gho C,
Cooper M. Limited-transpiration trait may increase maize drought tolerance in the US Corn Belt. J Agron. 2015;107:1978–86.
29. Richards RA. Selectable traits to increase crop photosynthesis and yield of grain crops. J Exp Bot. 2000;51:447–58.
30. Richards RA, Lukacs Z. Seedling vigour in wheat—sources of variation for genetic and agronomic improvement. Aust J Agric Res. 2002;53:41–50. 31. Vadez V, Soltani A, Sinclair TR. Modelling possible benefits of root related
traits to enhance terminal drought adaptation of chickpea. Field Crops Res. 2012;137:108–15.
32. Kholová J, Nepolean T, Hash CT, Supriya A, Rajaram V, Senthilvel S, Kakkera A, Yadav RS, Vadez V. Water saving traits co-map with a major terminal drought tolerance quantitative trait locus in pearl millet (Pennisetum glaucum (L.) R. Br.). Mol Breed. 2012;30:1337–53.
33. Aparna K, Nepolean T, Srivastsava RK, Kholová J, Rajaram V, Kumar S, Rekha B, Senthilvel S, Hash CT, Vadez V. Quantitative trait loci associated with constitutive traits control water use in pearl millet [Pennisetum glaucum (L.) R. Br.]. Plant Biol. 2015;17:1073–84.
34. Bidinger FR, Nepolean T, Hash CT, Yadav RS, Howarth CJ. Identification of QTLs for grain yield of pearl millet [Pennisetum glaucum (L.) R. Br.] in environments with variable moisture during grain filling. Crop Sci. 2007;47:969–80.