Editors' Choice—Coating-Dependent Electrode-Electrolyte
Interface for Ni-Rich Positive Electrodes in Li-Ion Batteries
The MIT Faculty has made this article openly available.
Please share
how this access benefits you. Your story matters.
Citation
Karayaylali, Pinar et al. "Editors' Choice—Coating-Dependent
Electrode-Electrolyte Interface for Ni-Rich Positive Electrodes in
Li-Ion Batteries." Journal of The Electrochemical Society 166, 6 (March
2019): A1022 © 2019 The Author(s)
As Published
http://dx.doi.org/10.1149/2.0461906jes
Publisher
Electrochemical Society/IOP Publishing
Version
Final published version
Citable link
https://hdl.handle.net/1721.1/130086
Terms of Use
Creative Commons Attribution-NonCommercial-NoDerivs License
Journal of The Electrochemical
Society
OPEN ACCESS
Editors' Choice—Coating-Dependent Electrode-Electrolyte Interface for
Ni-Rich Positive Electrodes in Li-Ion Batteries
To cite this article: Pinar Karayaylali et al 2019 J. Electrochem. Soc. 166 A1022
View the article online for updates and enhancements.
Coating-Dependent Electrode-Electrolyte Interface for Ni-Rich
Positive Electrodes in Li-Ion Batteries
Pinar Karayaylali,1,zRyoichi Tatara, 2,∗Yirui Zhang,1Kuei-Lin Chan,3Yang Yu,4
Livia Giordano,2,4,∗Filippo Maglia,5Roland Jung,5Isaac Lund,6
and Yang Shao-Horn 1,2,4,∗∗,z
1Department of Mechanical Engineering, MIT, Cambridge, Massachusetts 02139, USA 2Research Laboratory of Electronics, MIT, Cambridge, Massachusetts 02139, USA
3Department of Materials Science and Engineering, National Tsing Hua University, Hsinchu 30013, Taiwan 4Department of Materials Science and Engineering, MIT, Cambridge, Massachusetts 02139, USA 5BMW Group, 80788 Munich, Germany
6BMW Group Technology Office USA, Mountain View, California 94043, USA
Surface chemistry modification of positive electrodes has been used widely to decrease capacity loss during Li-ion battery cycling. Recent work shows that coupled LiPF6 decomposition and carbonate dehydrogenation is enhanced by increased metal-oxygen
covalency associated with increasing Ni and/or lithium de-intercalation in metal oxide electrode, which can be responsible for capacity fading of Ni-rich oxide electrodes. Here we examined the reactivity of lithium nickel, manganese, cobalt oxide (LiNi0.6Mn0.2Co0.2O2,
NMC622) modified by coating of Al2O3, Nb2O5and TiO2with a 1 M LiPF6carbonate-based electrolyte. Cycling measurements
revealed that Al2O3-coated NMC622 showed the least capacity loss during cycling to 4.6 VLicompared to Nb2O5-, TiO2- coated
and uncoated NMC622, which was in agreement with smallest electrode impedance growth during cycling from electrochemical impedance spectroscopy (EIS). Ex-situ infrared spectroscopy of charged Nb2O5- and TiO2-coated NMC622 pellets (without carbon
nor binder) revealed blue peak shifts of 10 cm−1, indicative of dehydrogenation of ethylene carbonate (EC), but not for Al2O3-coated
NMC622. X-ray Photoelectron Spectroscopy (XPS) of charged TiO2-coated NMC622 electrodes (carbon-free and binder-free)
showed greater salt decomposition with the formation of lithium-nickel-titanium oxyfluoride species, which was in agreement with ex-situ infrared spectroscopy showing greater blue shifts of P-F peaks with increased charged voltages, indicative of species with less F-coordination than salt PF6−anion on the electrode surface. Greater salt decomposition was coupled with the increasing
dehydrogenation of EC with higher coating content on the surface. This work shows that Al2O3coating on NMC622 is the most
effective in reducing carbonate dehydrogenation and accompanied salt decomposition and rendering minimum capacity loss relative to TiO2and Nb2O5coating.
© The Author(s) 2019. Published by ECS. This is an open access article distributed under the terms of the Creative Commons Attribution Non-Commercial No Derivatives 4.0 License (CC BY-NC-ND,http://creativecommons.org/licenses/by-nc-nd/4.0/), which permits non-commercial reuse, distribution, and reproduction in any medium, provided the original work is not changed in any way and is properly cited. For permission for commercial reuse, please email:oa@electrochem.org. [DOI:10.1149/2.0461906jes]
Manuscript received March 11, 2019. Published March 29, 2019.
Understanding electrode/electrolyte interface (EEI) is crucial to in-crease cycling performance and safety of Li-ion batteries.1–6Lithium
nickel manganese cobalt oxides has been promising positive elec-trode materials due to their increased initial charge capacity as the nickel content increases.7–9However, significant capacity loss7–9and
thermal instability8,10–13 are observed once the Ni content increases
in NMC electrodes. This impedance growth and reduced capacity retention7,8,14,15has been attributed to the solvent oxidation7,9,16,17and
greater salt decomposition.16
Numerous studies have shown that surface modification of Co-based and Ni-based positive electrode materials can increase ca-pacity retention in Li-ion batteries. Different coating materials have been studied such as metal oxides (Al2O3,18–21TiO2,22–26Nb2O527,28), metal phosphates (AlPO421,29–31), and metal fluorides (AlF332). There are several schools of thoughts for the mechanism or physical ori-gin to enhanced capacity retention associated with coated electrode materials. Coatings on the positive electrode would act as a protec-tive layer that reduces parasitic reactions between the posiprotec-tive elec-trode and electrolyte33and a HF scavenger30,34–36that suppresses the
transition metal dissolution from positive electrolyte surface to the electrolyte. In addition, the coating on some oxides could trigger the formation of metal fluoride on the surface during cycling, which can reduce the electrode reactivity toward the electrolyte and decrease the impedance growth of the positive electrode surfaces.35–39
More-over, coating materials can be converted to metal fluorides,37,40
reduc-ing electrode surface reactivity toward the electrolyte. For example, Myung et al.37have shown that the Al
2O3coating layer might form alu-minum fluoride/oxyfluoride using Time-of-Flight secondary ion mass
∗Electrochemical Society Member. ∗∗Electrochemical Society Fellow.
zE-mail:pinark@mit.edu;shaohorn@mit.edu
spectrometry (ToF-SIMS) on the Li(Li0.05Ni0.4Co0.15Mn0.4) electrode at 60°C after extensively cycled. Similarly, Lu et al.40have studied
the AlPO4- coated LiCoO240–42electrodes using X-ray photoelectron spectroscopy (XPS) and found Al-containing fluorides and/or oxyflu-orides on the cycled coated electrodes.
More recently, density functional theory calculations43,44 have
shown that the driving force for carbonate solvent dehydrogenation on oxides, yielding surface protic species, increased with greater Ni-content in NMC (NMC111, 622 and 811).16 Ex-situ infrared and
Raman spectroscopy have revealed EC dehydrogenation16,43,44 on
charged NMC surfaces, where resulted protic species on charged NMC surfaces can further react with LiPF6to generate less-fluorine-coordinated species.16,45,46Greater salt decomposition was coupled
with increasing EC dehydrogenation on charged NMC with increasing Ni or lithium de-intercalation.16It is hypothesized that coating
materi-als might have much lower thermodynamic tendency to dehydrogenate or dissociate carbonate solvents, which can reduce salt decomposition and capacity loss during cycling.30,33,47
In this study, we investigate the electrochemical performances of uncoated, Al2O3-, Nb2O5- and TiO2-coated NMC622 electrodes us-ing LP57 electrolyte (1M LiPF6in ethylene carbonate (EC) and ethyl methyl carbonate (EMC) 3:7 wt:wt) by cycling measurements and electrochemical impedance spectroscopy (EIS). Density Functional Theory calculations reveal that the high band-gap compounds such as Al2O3 have a lower tendency to bind hydrogen than materials with smaller band gap such as TiO2 and Nb2O5. While on semi-conducting materials hydrogen adsorbs as a proton on the oxygen site and one electron is transferred to the metal states, for instance to the metal 3d states in the case of TiO2, the large band of Al2O3 prevents this charge transfer resulting in unfavorable adsorption.47
We employ Fourier-transform infrared spectroscopy (FT-IR) and X-ray photoelectron spectroscopy (XPS) to understand the reaction
Journal of The Electrochemical Society, 166 (6) A1022-A1030 (2019) A1023
intermediates and salt and solvent decomposition on charged un-coated and un-coated NMC622 electrodes. Through those efforts, we have linked the electrochemical performances of uncoated and coated NMC622 electrodes to the solvent and salt decomposition on these electrodes, which will give information for rational design of stable positive electrode-electrolyte interfaces.
Experimental
Oxide synthesis and electrode preparation.—The pellet electrode
was prepared through pelletizing around 48 mg of active materials using 6 mm diameter pressing die set (Across International) for 15 mins. The pellets were then sintered under oxygen flow at 750°C for 6 hours, for NMC622 electrodes. The cooling and heating rates are controlled to be 2°C/min. The pellet electrodes are then broken into pieces of around 3 mg each, then dry in vacuum under 120°C overnight before transferred into Argon-filled glovebox (<0.5 ppm of H2O and O2).
The carbon-free binder free electrodes were prepared by mixing active materials with N-methyl-2-pyrrolidone (NMP) (Sigma Aldrich) in a 1:100 mass ratio. After bath-sonication for 30 min, the ink was deposited on 1
2 inch diameter aluminum discs and dried at 100°C. Composite electrodes were prepared by mixing active material (85%), carbon black (2% Csp, Timcal, 5% KS6) and polyvinylidene fluoride (PVDF) (8%, Kynar) dispersed in NMP with homogenizer (Thinky AR-100). The slurry was then bladed onto aluminum sheet with a gap of 10μm. Both composite and carbon-free binder-free electrodes were punched and pressed at 6.3 T cm−2under a hydraulic press, to favor embedding of the powder in the aluminum disc in the case of the carbon-free, binder-free electrodes. Finally, the electrodes were completely dried at 120°C under vacuum for 24 h. Al2O3, TiO2and Nb2O5coated NMC622 (LiNi0.6Mn0.2Co0.2O2) materials prepared by atomic layer deposition (ALD) were obtained from Forge Nano.
Electrochemistry.—Electrochemical behavior of the electrodes was confirmed by galvanostatic measurements in two-electrodes cells (Tomcell type TJ-AC) and coin cell (CR2016). For coin-cell cycling, the formation cycle was done at C/10 rate (27.5 mA/g) from upper cut-off voltage (4.2, 4.4 and 4.6 VLi) to 2 VLiwith constant current constant voltage (CCCV) charging with a cutoff current of C/20 (13.8 mA/g) for two cycles, followed by 1 C rate cycling (275 mA/g) from upper cut-off voltage (4.2, 4.4 and 4.6 VLi) to 2 VLi. Cells were as-sembled in an argon-filled glovebox (<0.5 ppm of H2O and O2) and comprised a lithium metal foil as the negative electrode, separated by two pieces of polypropylene separator (2500 Celgard), impregnated with 100μL of LP57 (1M LiPF6in a 3:7 ethylene carbonate (EC): ethylmethyl carbonate (EMC)) electrolyte (BASF). After assembly, the cells rested for 6 h prior to measurement and then were charged with different end-of-charge potentials (4.1, 4.2, 4.4 and 4.6 VLi) at a C/100 rate, based on the theoretical capacity calculated assuming full delithiation. The cells were maintained at end-of-charge potential for 5 h before disassembly in the glovebox. Carbon-free, binder-free electrodes were gently rinsed with 100μL of EMC and dried under vacuum at room temperature for 3 h. No rinsing was performed for pellet electrodes to enable probing electrolyte features.
Three-electrode cells were used to investigate Electrochemical Impedance Spectroscopy (EIS) for coated-NMC622 composite elec-trodes. These cells were assembled in argon-filled glovebox (<0.5 ppm of H2O and O2) with a Li metal foil (15 mm diameter), 2 pieces of Celgard 2325 (19 mm diameter, MTI) as the separators, Li4Ti5O12 mesh reference electrode (18 mm diameter), 2 pieces of Celgard 2325 (19 mm diameter) again, and composite electrode (1/2 inch diameter) from bottom to top, where a mesh Li4Ti5O12reference electrode was placed between positive and negative electrode with two separators with 200μL of 1 mol/L LiPF6in a 3:7 wt:wt ethylene carbonate (EC): ethyl methyl carbonate (EMC) electrolyte (LP57, BASF) was used as electrolyte. The composite electrodes were charged with different end-of-charge potential at 27.5 mAh/g (C/10 rate based on theoreti-cal capacity 275 mAh/g). After 10 minutes relax, EIS measurements
were carried out at open circuit potential with 10 mV amplitude and frequency range from∼10−2to 106Hz with VMP3 (Potentiostat with frequency response analyzer, Biologic), with temperature fixed at 25°C (Espec, SU-241). Additional details of cell/experimental configuration for three-electrode EIS method can be found in our previous work.48
The resistance values from cycling data and the EIS measurements are different, which may arise from responses from negative and pos-itive electrodes in two-electrode cells used for cycling measurements, whereas EIS measurements were made with three-electrode cell setup to measure impedance changes of the positive electrode alone.
FT-IR spectroscopy.—The Fourier transform infrared (FT-IR) spectra of the materials were obtained on an FT-IR Tensor II (Bruker) equipped with deuterated triglycine sulfate (DTGS) detector inside an argon-filled glovebox with the H2O and O2 levels< 0.5 ppm. The species on active materials formed during (electro)chemical pro-cess was analyzed with the diffuse reflectance infrared Fourier trans-form (DRIFT) accessory (Praying Mantis, Harrick scientific products). Powder samples for DRIFT measurement were prepared by mixing active materials with KBr (>99.9% FT-IR grade, Sigma Aldrich) to give the concentration of active materials of 0.2 wt%. The DRIFT mea-surements were done with a 4 cm−1resolution in the 4000–400 cm−1 spectral range at a scan velocity of 1.6 KHz; 256 scans were averaged. All FTIR spectra of the liquid samples were recorded using a single reflection ATR accessory (Pike Vee-Max II, Pike Technologies) with a Ge prism (Pier optics) at an incident angle of 45 degrees. The ATR measurements were performed with a 4 cm−1resolution in the 4000– 400 cm−1 spectral ranges at a scan velocity of 1.6 KHz; 256 scans were averaged. All spectra are shown in the absorbance units defined as log(I0/I), where I0and I represent the background spectra and
sam-ple spectra, respectively. The background spectrum I0for DRIFT and
ATR measurements were measured in the pure KBr powder and blank condition, respectively.
XPS measurements.—All carbon-free, binder-free electrodes were transferred from glovebox to XPS chamber using a transfer vessel (ULVAC-PHI, INC.). For each potential, at least two electrodes were charged for reproducibility. All the XPS spectra were collected using a PHI 5000 VersaProbe II (ULVAC-PHI, INC.) using a monochro-matized Al Kα source and a charge neutralizer. A pass energy of 23.5 eV was used and adventitious carbon at 285 eV (C1s spectra) was used for calibration of all XPS spectra. After subtraction of a Shirley-type background, photoemission lines were fitted using com-bined Gaussian-Lorentzian functions, except in the case of the Co, Ni and Mn 2p3/2lines where asymmetric line shapes were used. The RSF (relative sensitivity factors) values for C 1s, O 1s, F1s, P 2p, Li 1s, Co 2p3/2, Ni 2p3/2and Mn 2p3/2, Al 2p, Ti 2p, Nb 3d photoemis-sion lines were given as 0.314, 0.733, 1, 0.525, 0.028, 2.3526, 2.468, 1.792, 0.256, 1.256, and 3.71, respectively. The chemical composi-tions, binding energies and full width at half maximum of all spectra can be found in Tables S1–S5.
Results and Discussion
Coating-dependent capacity loss and impedance growth of Al2O3-, Nb2O5- and TiO2-coated NMC622 electrodes.—Figure 1 shows the voltage profiles of uncoated, Al2O3-, Nb2O5- and TiO2 -coated (4 monolayers) NMC622 electrodes in the first, 50thand 100th cycles (after two formation cycles) with 4.2, 4.4 or 4.6 VLi cut-off potentials. In the first cycle, the charge and discharge capacities of un-coated and un-coated NMC622 electrodes were comparable (Figure1a), which increases from∼160 mAh/g at 4.2 VLi,∼180 mAh/g at 4.4 VLito∼200 mAh/g for 4.6 VLi. Upon cycling to 4.2 VLi, uncoated and coated NMC622 electrodes were found to have comparable ca-pacities (for 100 cycles examined in this study), where uncoated and coated electrodes were found to have comparable voltage polarization. With increasing upper voltage cutoff, uncoated NMC622 was found to have the highest capacity loss and greatest growth in voltage polar-ization upon cycling to 4.6 VLiin Figure1cin comparison with coated
4.6 V cycling
a) b) c)
4.4 V cycling
4.2 V cycling
1
stcycle
50
thcycle
100
thcycle
V
o
ltage (V
Li)
Capacity (mAh/g)
Figure 1. The capacity versus voltage for (a) 1st, (b) 50thand (c) 100thcycles for uncoated (black), Al
2O3-coated (dark gray), Nb2O5-coated (light gray) and
TiO2-coated (gray) (4 monolayers) NMC622 cycled between 4.6 VLi, 4.4 VLi, and 4.2 VLiand 2 VLi. The cycle number vs capacity plots can be found in Figure
S1. The charge and discharge curves were collected from two-electrode coin cells with a 1 C rate after two formation cycles (C/10 rate) in 1 M LiPF6in a 3:7
(w:w) EC: EMC, where C is defined as the capacity corresponding to full delithiation, and with lithium metal as the negative electrode. The resistance calculations based on electrochemical performances can be found in Figure S2.
NMC622. Among the coated electrodes, Al2O3-coated NMC622 elec-trodes had the highest capacity retention and minimum voltage polar-ization after 100 cycles while TiO2-coated NMC622 electrodes had the highest capacity loss and resistance (voltage polarization).
The observed trend in the capacity loss and cell resistance growth upon cycling to 4.6 VLi for uncoated and coated electrodes in Fig-ure1is further supported by impedance measurements. The Nyquist plots for uncoated, Al2O3-, TiO2- and Nb2O5-coated NMC622 com-posite electrodes cycled between 4.6 VLi and 2 VLi and EIS mea-surements at 4.1, 4.2 and 4.4 VLireveal two semicircles (Figure2), where the high-frequency semicircle was assigned to the impedance associated with ion adsorption and desorption at the electrified inter-face while the low-frequency semicircle was attributed to the charge transfer impedance for the positive electrode.48This assignment is
fur-ther supported by the observation that the low-frequency semicircle grew with higher charging potential from 4.1 VLito 4.4 VLi, result-ing from EEI layer growth and greater resistance for charge transfer, while the size of the high-frequency semicircle kept nearly constant as reported in our previous work.48Although R
HF value depends on electrolyte ionic conductivity, electronic conductivity of composite
electrode and particle size of active materials, the frequency corre-sponding to the high frequency (left) semicircles are consistent (103– 104Hz) with other previous works.48–52In the first cycle, all electrodes
had similar sizes for the high-frequency semicircle while uncoated and Al2O3-coated NMC622 had smaller low-frequency impedance than those found for TiO2- and Nb2O5-coated NMC622. Upon cy-cling, the high-frequency semicircle remained unchanged while the low-frequency semicircle was found to grow, as shown in Figure2. Of significance to note is that Al2O3-coated NMC622 electrodes had the lowest impedance growth for the low-frequency semicircle af-ter 50 cycles, followed by Nb2O5-coated and TiO2-coated NMC622 electrodes. This trend is consistent with that in the estimated resis-tance based on the cycling data collected from two-electrode cells in Figure1.
The decreased impedance growth for the low-frequency semicir-cle and increased capacity retention of Al2O3-coated NMC622 rela-tive to uncoated NMC622 upon cycling to 4.6 VLican be attributed to reduced (chemical) oxidation of the electrolyte on the electrode, specifically dehydrogenation of carbonate solvents to generate pro-tic species, which can decompose electrolyte salt anion (PF6−).16,43,53
Journal of The Electrochemical Society, 166 (6) A1022-A1030 (2019) A1025 1st 1st 50th 1st 1st 50th 50th 50th 4.1 VLi4.2 VLi 4.4 VLi
Al2O3coating -4 ML Nb2O5coating -4 ML TiO2coating -4ML
Uncoated NMC 622
a) b) c) d)
Figure 2. Nyquist plots for uncoated (a), Al2O3- (b), Nb2O5- (c) and TiO2- (d) coated NMC622 (4-monolayer) composite electrodes cycled between 4.6 VLi
and 2 VLiwith EIS collected at 4.1 (light blue), 4.2 (blue) and 4.4 VLi(darker blue) in the first charge and after 50thcycles at 25°C. Data were collected from
in three-electrode cells with mesh Li4Ti5O12reference electrode and Li metal counter electrode in 1 M LiPF6in a 3:7 (w:w) EC: EMC solution. The cells were
galvanostatically charged at C/10 at each potential, then relax 10 minutes before EIS measurements. The electrochemical profiles for each EIS cell are shown in Figure S3 and the comparison of electrochemical performance of three-electrode EIS cell and two-electrode coin cell for cycling are shown in Figure S4.
This hypothesis is supported by much lower driving force for hydro-gen adsorption on Al2O3than LiMO2(M=Ni,Co) surfaces (Figure3), which is shown to scale with the dissociation adsorption energetics of carbonate solvents in our recent work.53While TiO
2coating has the highest tendency to dehydrogenate carbonate solvent among Al2O3, Nb2O5 and TiO2 coating materials (Figure3),47it has lower driving force for chemical oxidation when it is compared with layered posi-tive electrode materials such as LiCoO2and LiNiO2. This is supported by our cycling measurements of uncoated NMC 622 and TiO2-coated NMC622 upon cycling to 4.6 VLi, where uncoated NMC622 was found to have the higher capacity loss and the greatest growth in voltage po-larization than all other coated NMC622 electrodes.
Evidence for coating-dependent dehydrogenation of carbonate solvents and salt decomposition on coated NMC622 electrodes.—
DRIFT measurements of soaked and charged uncoated, Al2O3, Nb2O5 and TiO2-coated NMC622 pellet electrodes (carbon-free and binder-free) revealed evidence of EC dehydrogenation, which became more pronounced when the coating changed from Al2O3 to TiO2. The DRIFT signals, originated from the stretching modes of the EC cor-responding to the C=O bonds, collected from charged Al2O3, Nb2O5 and TiO2-coated electrodes to different end-of-charge potentials in the
Al2O3
H adsorption energy (eV) Nb2O5
TiO2 LiCoO2
LiNiO2
Figure 3. Hydrogen adsorption energy for positive electrode materials
(LiCoO2and LiNiO2) and coating materials (TiO2, Nb2O5and Al2O3
com-pounds), computed with PBE-DFT with respect to12 H2in the gas phase.47
first charge are compared with those of soaked electrodes (only ex-posure to the electrolyte) and LP57 electrolyte in Figure4, and those of the O-C-O region are shown in Figure S6. Two distinct features at 1807 and 1773 cm−1of the LP57 electrolyte16can be assigned to the
C=O stretching of EC and Li+-coordinated EC according to our re-cent work,16respectively. Below we discuss the changes from soaked
electrodes to the charged uncoated and coated NMC electrodes. No significant shift for the peaks associated with the C=O stretch-ing (centered around 1807 and 1773 cm−1) was found for charged uncoated (Figure 4a) and Al2O3-coated NMC622 electrodes (4-monolayer in Figure4band 12-monolayer in Figure4c) relative to soaked electrodes. In contrast, these peaks were blue shifted and broad-ened for charged 4-monolayer TiO2- (Figure4e) and Nb2O5-coated (Figure4d) NMC622, which remained largely unchanged with in-creasing charging voltage for 4 monolayers (Figure4). This blue shift (that induces peak broadening) became more evident with increased coating thickness from 4 to 12 monolayers for charged TiO2-coated NMC622 but not for charged Al2O3-coated NMC622 (Figure4). The blue shift and peak broadening can be attributed to species derived from EC dehydrogenation formed on NMC622 electrodes as reported in our recent work,16which is supported by the calculated spectra for
the Li+-EC and dehydrogenated Li+-EC shown in Figure4. Similar blue shifts and peak broadening were found for the O-C-O stretching of EC on charged TiO2-coated NMC622 while no significant shifts were noted for charged Al2O3-coated NMC 622 (Figure S6). There-fore, these results revealed evidence for dehydrogenation of EC on charged TiO2-coated NMC622 but not Al2O3-coated NMC622, which is in agreement with greater driving force for hydrogen adsorption and consequently surface dissociative adsorption of carbonate solvents on TiO2than Al2O3from DFT results (Figure3).47
Comparing the P-F region of the DRIFT spectra for soaked and charged coated NMC electrodes revealed the formation of less-fluorine coordinated species, which is accompanied with carbonate dehydro-genation. Dehydrogenation of EC or EMC generates protic species such as surface hydroxyl groups,16,43 which can react with LiPF
6 salt to form less fluorine-coordinated species such as PF3O or PF5 species.16,46The possible reaction mechanisms include 2∗H+ O
lat⇒ H2O+ Ovac(∗H being H adsorbed at a lattice oxygen site); H2Ooxide + PF5⇒ PF3O+ 2HF; PF3O+ H2Ooxide⇒ HPF2O2+ HF; and 2HF +NMC and/or TiO2/Nb2O5⇒ NMC-oxide/fluoride and/or titanium oxyfluoride+ H2O.16The sharp peak around 840 cm−1originated from P-F stretching in LiPF6 in the LP57 electrolyte was broadened and blue shifted for charged uncoated NMC622 with increasing charg-ing voltage (Figure4a), which can be attributed to the formation of less-coordinated fluorinated species at higher potentials supported by DFT simulated spectra of PF3O and PF6−. In contrast, this peak was
Uncoated NMC 622 Al2O3 coating -4 ML a) b) c) LP57 4 .1 V4 .2 V 4 .4V 4 .6V s o a k ed D F T resul ts Li+-EC deH-Li+ -EC Li+-EC deH-Li+ -EC Li+-EC deH-Li+ -EC PF6- PF3O PF6- PF3O PF6- PF3O Al2O3 coating -12 ML
Nb2O5 coating -4 ML TiO2 coating -4 ML TiO2 coating -12 ML d) e) f) LP 57 4 .1V 4 .2 V 4 .4 V 4 .6 V s oa ked DF T res u lt s Li+-EC deH-Li+ -EC Li+-EC deH-Li+ -EC Li+-EC deH-Li+ -EC PF6- PF3O PF6- PF3O PF6- PF3O Wavenumber (cm-1)
Figure 4. DRIFT spectra of C=O stretching
re-gion and P-F stretching rere-gion for (a) uncoated,16 (b) 4-monolayer Al2O3-coated, (c) 12-monolayer
Al2O3-coated, (d) 4-monolayer Nb2O5-coated, (e)
4-monolayer TiO2-coated and (f) 12-monolayer
TiO2-coated NMC622 for carbon-free and
binder-free pellets, in the conditions of being soaked in the LP57 electrolyte for 50 hours, and being charged to 4.1, 4.2, 4.4 or 4.6 VLi. Cumulative number of
256 was used at a 4 cm–1resolution. Spectra were
subtracted with respect to a reference spectrum ob-tained with potassium bromide (KBr) powder while the ATR-IR spectrum of the pristine electrolyte is shown for comparison. The DRIFT spectra are compared with the DFT simulations of deH-Li+ -EC and Li+-EC as a reference that was previously reported by Yu et al,16and the peak at 1744 cm−1 was assigned to the C=O in EMC.16The example electrochemistry profiles of Al2O3-coated, Nb2O5
-coated and TiO2-coated NMC622 pellet electrodes
are shown in Figures S5, S7-8 and the O-C-O scis-soring mode for these electrodes are shown in Fig-ures S6 and S9. The peak at 1775 cm−1 (shown by dashline in C=O region) and 1805 cm−1was assigned to the C=O in EC and Li+-EC respec-tively and the peaks around 853 cm−1(shown by dashline in P-F region) are related to less-fluorine coordinated species.16
Journal of The Electrochemical Society, 166 (6) A1022-A1030 (2019) A1027
Al
2O
3coating -4 ML
pristine
4.1 V
4.2 V
4.4 V
4.6 V
C1s F1s C1sBinding Energy (eV)
Al
2O
3coating -12 ML
O1s O1s F1s
Intensity (a.u.)
a)
b)
Figure 5. XPS spectra of the C 1s, O 1s and F 1s photoemission lines for Al2O3-coated 4 (a) and 12 (b) monolayers for the pristine carbon-free, binder-free
electrodes and after charging to 4.1, 4.2, 4.4, and 4.6 VLiwith 1 M LiPF6in EC: EMC (3:7 wt:wt) electrolyte. All spectra were calibrated with the adventitious
hydrocarbons at 285.0 eV and background corrected using a Shirley background. C1s spectra were assigned with the following contributions: C-H/C-C (∼285 eV),54 C-O (∼286.3 eV),55C=O/O-C-O (∼287.6 eV),55,56O=C-O (∼288.8 eV)55and CO3(∼290.3 eV).41O1s spectra were assigned with the following contributions:
O lattice (∼529.3 eV),57ROLi (∼531 eV),56,58surface O/CO
3/O-C=O (∼532 eV),41,59C-O/O-C=O/OP(OR)3(Eb∼533.4 eV)6,56,57and LixPFyOz(Eb∼534.8
eV).60The F1s spectra were deconvoluted to three different species: lithium or metal fluoride species around 685 eV,57lithium or metal fluorophosphate around 686.5 eV57and lithium hexafluorophosphate around 688 eV.40The representative electrochemical profile is shown in Figure S10. The P 2p, Co 2p, Mn 2p, Ni 2p and Li 1s/Co 3p XPS spectra is shown in Figures S11-12, the quantification is shown in Figure S13 and Table S1-S2.
found largely unchanged for charged Al2O3-coated NMC622 with in-creasing voltage, which is in agreement with reduced reactivity toward dehydrogenation of carbonate solvents as shown by DFT (Figure3) and FT-IR results in comparison to charged NMC. On the other hand, the P-F stretching peak was found to be broadened considerably for charged 12-monolayer TiO2-coated NMC622, which was accompa-nied with increasing blue shift and peak broadening associated with the C=O stretching upon EC de-hydrogenation discussed earlier.
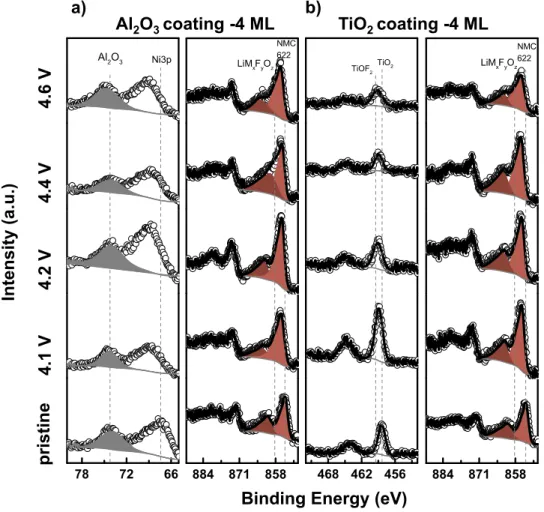
Greater reactivity toward carbonate and salt decomposition for TiO2–coated NMC622 than Al2O3-coated NMC622 was further con-firmed by XPS analysis. EEI layers formed on uncoated and Al2O3-, TiO2- and Nb2O5-coated NMC622 carbon-free, binder-free electrodes charged to different potentials were studied by XPS analysis of C 1s, O 1s, F 1s, P 2p, Mn 2p, Co 2p, Ni 2p, Li 1s, Nb 3d, Al 2p and Ti2p spectra. The C 1s spectra were fitted to components 285.0, 286.3, 287.6 and 288.8 eV. These peaks can be attributed to adven-titious carbon,54C-O bonds like ROLi55 or polyethers, C=O/
O-C-O bonds55,56and O=C-O bonds55. Only small contribution for CO
3 bonds was observed around 290.3 eV.41The growth of EEI layer
sup-ported by the O 1s spectra that revealed five contributions for charged coated samples. The lowest energy contribution at 529 eV came from O lattice from coated NMC electrodes, which could be combination of O lattice40,61–63from coating or the NMC powder. The other four
peaks are attributed to ROLi (∼531 eV),56,58semicarbonates around
532 eV (ROCO2Li and CO3group)41,59and polyethers species around 533.4 eV (O-C=O bonds)6,56,57and lithiated fluorophosphates species
(LixPFyOz).60The O lattice peak was shifted to higher binding en-ergy with increasing voltage, which is an indication of the oxyfluoride formation on the surface. These oxyfluoride species can be formed by the protic species attacking NMC622 electrode and/or coating on the surface of the electrode.16 The indicative O lattice shift to
higher binding energy can be correlated with the shifts of Ni 2p, Ti 2p and Nb 3d to higher binding energy which suggests formation of lithium nickel titanium or lithium nickel niobium oxyfluorides on the surfaces of TiO2 and Nb2O5coated NMC622 electrodes (Figure
7).62We still see formation of lithium nickel oxyfluorides on Al
2O3 -coated NMC622 surfaces similar to un-coated NMC622 electrodes, however since the Al 2p spectra does not shift to higher binding en-ergy, we do not see evidence of formation of aluminum oxyfluoride species which definitely shows less reactivity of carbonate electrolyte on Al2O3-coated NMC622 than TiO2- and Nb2O5-coated NMC622 electrodes.
Increasing tendency toward greater salt decomposition can be fur-ther confirmed by XPS analysis of their F 1s spectra in Figures5and
6. Figures5and6show the 4-monolayer and 12-monolayer TiO2 -and Al2O3-coated NMC622 electrodes. The intensity of F 1s spectra
a) b)
TiO
2coating -4 ML
pri
s
tine
4.
1
V4
.2
V
4
.4
V
4
.6
V
C1s F1s C1sBinding Energy (eV)
TiO
2coating- 12 ML
O1s O1s F1s
Intensity
(a.u.)
x0.5
Figure 6. XPS spectra of the C 1s, O 1s and F 1s photoemission lines for TiO2-coated 4 (a) and 12 (b) monolayers for the pristine carbon-free, binder-free
electrodes and after charging to 4.1, 4.2, 4.4, and 4.6 VLiwith 1 M LiPF6 in EC: EMC (3:7 wt:wt) electrolyte. All spectra were calibrated with the
adventi-tious hydrocarbons at 285.0 eV and background corrected using a Shirley background. C1s spectra were assigned with the following contributions: C-H/C-C (∼285 eV),54C-O (∼286.3 eV),55C=O/O-C-O (∼287.6 eV),55,56O=C-O (∼288.8 eV)55and CO3(∼290.3 eV).41O1s spectra were assigned with the
fol-lowing contributions: O lattice (∼529.3 eV),57ROLi (∼531 eV),56,58surface O/CO
3/O-C=O (∼532 eV),41,59C-O/O-C=O/OP(OR)3 (Eb∼533.4 eV)6,56,57
and LixPFyOz(Eb∼534.8 eV).60The F1s spectra were deconvoluted to three different species: lithium or metal fluoride species around 685 eV,57lithium
or metal fluorophosphate around 686.5 eV57and lithium hexafluorophosphate around 688 eV.40The representative electrochemical profile is shown in Fig-ure S14. The Co 2p, Mn 2p, Ni 2p, Li 1s/ Co 3p, P 2p and Ti 2p XPS spectra is shown in FigFig-ures S15-16, the quantification is shown in FigFig-ure S17 and Table S3-S4.
is from all 4-monolayer Al2O3-, Nb2O5- and TiO2-coated NMC622 electrodes quite similar and can be found Figures S20 and S24. As the Al2O3thickness of the coating increases, the F1s spectra intensity does not change from 4-monolayer Al2O3 to 12-monolayer Al2O3 coating, which is consistent with DRIFT P-F spectra in Figure4. However, with increasing TiO2coating, the F1s spectra intensity in-creases, especially formation of the lithium nickel titanium oxyfluo-ride species on the surface. The increasing F 1s intensities can be de-convoluted to lithium or other transition-metal fluorides (LiF and/or LiMxFyOz) at 685.0 eV57and lithiated or transition metal fluorophos-phates (LixPFyOz) at 686.5 eV.57 The formation of LiMxFyOz-like species can be accompanied with a higher binding energy shift at Ni 2p spectra from 854.5 eV (pristine NMC622 electrodes) to 856 eV (charged NMC622 electrodes) and Ti 2p spectra from 458.5 to 459.0 eV. These LiMxFyOz-like species can be formed by the HF species attacking the coating material and/or charged NMC electrodes as suggested previously, where HF can be generated by reacting pro-tic species from dehydrogenation of EC with LiPF6 species.16The intensity of the LixPFyOz-like species with respect to LiMxFyOz -like species was increased considerably for charged 12-monolayer TiO2-coated NMC622 electrodes with increasing potential, which sug-gests greater reactivity of LiPF6 salt with more protic species pro-duced from dehydrogenation of EC. Although the ratio of LixPFyOz
to LiMxFyOz-like species was similar for both 4-monolayer and 12-monolayer Al2O3 coated NMC622 electrodes, the ratio of these species has been significantly changed when the thickness of the TiO2 coating increased from 4-monolayer to 12-monolayer which indicates the increasing salt decomposition triggered by protic species derived from EC dehydrogenation (Figure S25).16,43
There are several reports on aluminum-based coated positive elec-trodes showing better electrochemical performance than uncoated pos-itive electrodes such as Al2O3coated-LiCoO2cycled at 4.3 VLi64and 4.4 VLi,65Al2O3-coated NMC111 cycled at 4.5 VLi,66Al(OH)3coated – Li[Li0.2Ni0.2Mn0.6]O2cycled at 4.6 VLi.67One important protection mechanism that has been discussed in previous works is called HF-scavenging30,34–36where coating material reacts with HF and forms
metal fluoride species on the surface (e.g. Al2O3+ 6HF = > 2AlF3 + 3H2O) and would reduce the electrolyte reactivity on positive elec-trode surfaces and improve voltage polarization.27,36However, in this
work, we showed that Al2O3-coated NMC622 electrodes had the min-imum voltage polarization and lowest impedance growth and DRIFT C=O region and XPS F 1s analysis did not reveal obvious signs of EC dehydrogenation and formation of aluminum fluoride/oxyfluoride on Al2O3-coated NMC622 electrodes whereas the worst electrochemical performance was shown by TiO2-coated NMC622, where we showed clear signs of EC dehydrogenation and greater salt decomposition
Journal of The Electrochemical Society, 166 (6) A1022-A1030 (2019) A1029
Binding Energy (eV)
Intensity
(a.u.)
pr
istine
4.1
V
4
.2
V
4
.4
V
4
.6
V
a) b)
Al
2O
3coating -4 ML
TiO
2coating -4 ML
Figure 7. XPS spectra of the Ni 2p, Al 2p and Ti 2p photoemission lines for (a) Al2O3-coated (4 monolayers) and (b) TiO2-coated (4 monolayers) for pristine
and charged carbon-free, binder-free electrodes to 4.1, 4.2, 4.4, and 4.6 VLiwith 1 M LiPF6in EC: EMC (3:7 wt:wt) electrolyte. All spectra were calibrated
with the adventitious hydrocarbons at 285.0 eV and background corrected using a Shirley background. The representative electrochemical profile is shown in Figure S18. The Co 2p, Mn 2p, Ni 2p and Li 1s/Co 3p XPS spectra is shown in Figures S19-23, the quantification is shown in Figure S24 and Table S1 and S3.
including formation of lithium-nickel-titanium oxyfluoride species. Dahn et al.26 reported the titanium-based coated on NMC532
elec-trodes can help preventing transition metal dissolution and improve the cycling performance. This may be the reason why we have also seen better electrochemical performance for TiO2-coated NMC622 than uncoated NMC622 using two-electrode coin cell setup. How-ever, our three-electrode EIS cell measurements indicate TiO2-coated NMC622 has higher impedance growth than uncoated NMC622, since we only observe the effect of positive electrode side, mainly the ef-fect of EC dehydrogenation. These results can be further supported by our recent work,47where we show Al
2O3has lower tendency to bind hydrogen than TiO2and Nb2O5coating materials, so as we lower the Fermi level with respect to O-p band (from Al2O3to TiO2), the disso-ciation of EC molecule where protic species such as surface hydroxyl groups are formed becomes more thermodynamically favorable. We propose that the high band-gap insulators such as Al2O3are the best coating materials due to their lower reactivity with electrolyte solvents and salts.
Conclusions
This work combines EIS, DRIFT and XPS spectroscopies together with cycling measurement to understand the reactivity of coating ma-terials on NMC622 electrodes toward carbonate electrolyte with LiPF6 salt and this reactivity is linked with the impedance and cycling mea-surements. By combining cycling and EIS measurements, we show
coating-dependent electrochemical performance of NMC622 upon cy-cling to 4.6 VLi. Al2O3-coated NMC622 had reduced capacity loss and impedance growth while TiO2-coated NMC622 had greater ca-pacity loss and impedance growth than uncoated NMC622. Combin-ing XPS and DRIFT measurements on C=O and P-F regions, we show evidence for dehydrogenation of EC on TiO2-coated NMC622 positive electrodes, where it forms protic species and these protic species can react with LiPF6 salt to form less-fluorine coordinated species such as PF3O-like (DRIFT) and lithium nickel titanium or niobium oxyfluoride species (XPS). Exposing NMC622 surface more to TiO2 coating makes the surface more prone to dehydrogenation of EC and formation of less-fluorine coordinated species. Through these key findings, we propose key reaction intermediates for TiO2and Al2O3coating on NMC622 and we believe Al2O3coating should be used for Ni-rich positive electrodes such as NMC622 due to reduced reactivity toward chemical oxidation of carbonate solvents and the development of stable positive electrode-electrolyte interface during cycling.
Acknowledgment
This work made use of the MRSEC Shared Experimental Facilities at MIT, supported by the National Science Foundation under award number DMR-1419807. Research at MIT related to this work was supported financially by BMW.
ORCID
Ryoichi Tatara https://orcid.org/0000-0002-8148-5294
Yang Shao-Horn https://orcid.org/0000-0001-8714-2121
References
1. S. Menkin, D. Golodnitsky, and E. Peled,Electrochem. Commun., 11, 1789 (2009).
2. A. Smith, J. Burns, S. Trussler, and J. Dahn,J. Electrochem. Soc., 157, A196 (2010).
3. M. Gauthier et al.,J. Phys. Chem. Lett., 6, 4653 (2015).
4. K. Xu,Chem. Rev., 114, 11503 (2014).
5. M. Winter,Z. Für Phys. Chem., 223, 1395 (2009).
6. K. Edström et al., Electrochimica Acta, 50(2–3), 397 (2004).
7. R. Jung, M. Metzger, F. Maglia, C. Stinner, and H. A. Gasteiger,J. Electrochem. Soc., 164, A1361 (2017).
8. H.-J. Noh, S. Youn, C. S. Yoon, and Y.-K. Sun,J. Power Sources, 233, 121 (2013).
9. S. Hwang et al.,APL Mater., 4, 096105 (2016).
10. Y.-K. Sun et al.,Nat. Mater., 8, 320 (2009).
11. S. Hwang et al.,Chem. Mater., 27, 3927 (2015).
12. S.-M. Bak et al.,ACS Appl. Mater. Interfaces, 6, 22594 (2014).
13. N. Zhang et al.,Chem. Mater., 30, 8852 (2018).
14. W. Liu et al.,Angew. Chem. Int. Ed., 54, 4440 (2015).
15. F. Schipper et al.,J. Electrochem. Soc., 164, A6220 (2017).
16. Y. Yu et al.,J. Phys. Chem. C, 122, 27368 (2018).
17. R. Jung et al.,J. Electrochem. Soc., 165, A132 (2018).
18. B. Han et al.,ACS Appl. Mater. Interfaces, 9, 14769 (2017).
19. B. Han et al.,ACS Appl. Mater. Interfaces, 9, 41291 (2017).
20. A. M. Wise et al.,Chem. Mater., 27, 6146 (2015).
21. J. Cho et al.,J. Power Sources, 146, 58 (2005).
22. G. T.-K. Fey, C.-Z. Lu, J.-D. Huang, T. P. Kumar, and Y.-C. Chang,J. Power Sources, 146, 65 (2005).
23. H.-M. Cheng et al.,J. Phys. Chem. C, 116, 7629 (2012).
24. X. Zhang et al.,Adv. Energy Mater., 3, 1299 (2013).
25. S.-J. Kim et al.,J. Power Sources, 304, 119 (2016).
26. L. Ma et al.,ACS Appl. Energy Mater., 1, 7052 (2018).
27. S.-T. Myung et al.,J. Phys. Chem. C, 111, 4061 (2007).
28. R. Muruganantham, M. Sivakumar, and R. Subadevi,Ionics, 24, 989 (2018).
29. J. Cho, Y. Kim, B. Kim, J. Lee, and B. Park,Angew. Chem. Int. Ed., 42, 1618 (2003).
30. M. Aykol et al.,Nat. Commun., 7, 13779 (2016).
31. J.-G. Lee, B. Kim, J. Cho, Y.-W. Kim, and B. Park,J. Electrochem. Soc., 151, A801
(2004).
32. Y.-K. Sun, S.-W. Cho, S.-T. Myung, K. Amine, and J. Prakash,Electrochimica Acta,
53, 1013 (2007).
33. Z. Chen, Y. Qin, K. Amine, and Y.-K. Sun,J. Mater. Chem., 20, 7606 (2010).
34. N. Van Landschoot, E. M. Kelder, P. J. Kooyman, C. Kwakernaak, and J. Schoonman, J. Power Sources, 138, 262 (2004).
35. Y.-K. Sun, Y.-S. Lee, M. Yoshio, and K. Amine,Electrochem. Solid-State Lett., 5,
A99 (2002).
36. M. Aykol, S. Kirklin, and C. Wolverton,Adv. Energy Mater., 4, 1400690 (2014).
37. S.-T. Myung et al.,Chem. Mater., 17, 3695 (2005).
38. S.-T. Myung, K. Amine, and Y.-K. Sun,J. Mater. Chem., 20, 7074 (2010).
39. S.-T. Myung et al.,ACS Energy Lett., 2, 196 (2016).
40. Y.-C. Lu, A. N. Mansour, N. Yabuuchi, and Y. Shao-Horn,Chem. Mater., 21, 4408
(2009).
41. A. T. Appapillai, A. N. Mansour, J. Cho, and Y. Shao-Horn,Chem. Mater., 19, 5748
(2007).
42. R. A. Quinlan, Y.-C. Lu, D. Kwabi, Y. Shao-Horn, and A. N. Mansour,J. Electrochem. Soc., 163, A300 (2016).
43. L. Giordano et al.,J. Phys. Chem. Lett., 8, 3881 (2017).
44. K. Leung,J. Phys. Chem. C, 116, 9852 (2012).
45. A. Guéguen et al.,J. Electrochem. Soc., 163, A1095 (2016).
46. L. Terborg et al.,Anal. Chim. Acta, 714, 121 (2012).
47. L. Giordano et al., submitted.
48. R. Tatara et al.,J. Electrochem. Soc., 166, A5090 (2019).
49. H. Zheng, H. Zhang, Y. Fu, T. Abe, and Z. Ogumi,J. Phys. Chem. B, 109, 13676
(2005).
50. M. Thomas, P. G. Bruce, and J. B. Goodenough,J. Electrochem. Soc., 132, 1521
(1985).
51. D. Aurbach et al.,J. Electrochem. Soc., 145, 3024 (1998).
52. H. Nara et al.,Electrochimica Acta, 241, 323 (2017).
53. T. M. Østergaard et al.,J. Phys. Chem. C(2018).
54. J. Matthew,Surf. Interface Anal., 36, 1647 (2004).
55. H. Ago et al.,J. Phys. Chem. B, 103, 8116 (1999).
56. C. Kozlowski and P. M. Sherwood, J. Chem. Soc. Faraday Trans. 1 Phys. Chem. Condens. Phases, 81, 2745 (1985).
57. S. Verdier et al.,J. Electrochem. Soc., 154, A1088 (2007).
58. S. Malmgren et al.,Electrochimica Acta, 97, 23 (2013).
59. J.-C. Dupin, D. Gonbeau, H. Benqlilou-Moudden, P. Vinatier, and A. Levasseur,Thin
Solid Films, 384, 23 (2001).
60. H. Bryngelsson, M. Stjerndahl, T. Gustafsson, and K. Edström,J. Power Sources,
174, 970 (2007).
61. M. Gauthier et al.,J. Electrochem. Soc., 165, A1377 (2018).
62. W.-H. Ryu, D.-H. Kim, S.-H. Kang, and H.-S. Kwon,RSC Adv., 3, 8527 (2013).
63. R. Genieser et al.,J. Power Sources, 373, 172 (2018).
64. H.-J. Kweon et al.,J. Power Sources, 126, 156 (2004).
65. J. Cho, Y. J. Kim, and B. Park,Chem. Mater., 12, 3788 (2000).
66. Y. Kim, H. S. Kim, and S. W. Martin,Electrochimica Acta, 52, 1316 (2006).
67. Y.-J. Kang, J.-H. Kim, S.-W. Lee, and Y.-K. Sun,Electrochimica Acta, 50, 4784