HAL Id: hal-03046375
https://hal.archives-ouvertes.fr/hal-03046375
Submitted on 8 Dec 2020
HAL is a multi-disciplinary open access
archive for the deposit and dissemination of
sci-entific research documents, whether they are
pub-lished or not. The documents may come from
teaching and research institutions in France or
abroad, or from public or private research centers.
L’archive ouverte pluridisciplinaire HAL, est
destinée au dépôt et à la diffusion de documents
scientifiques de niveau recherche, publiés ou non,
émanant des établissements d’enseignement et de
recherche français ou étrangers, des laboratoires
publics ou privés.
Operando isotopic exchange on SOFC cells: oxygen
transport dependency on applied potential
Alexandre Nau, Clément Comminges, Nicolas Bion
To cite this version:
Alexandre Nau, Clément Comminges, Nicolas Bion. Operando isotopic exchange on SOFC cells:
oxygen transport dependency on applied potential. ChemPhysChem, Wiley-VCH Verlag, 2020, 21
(20), pp.2357-2363. �10.1002/cphc.202000574�. �hal-03046375�
Operando isotopic exchange on SOFC cells: oxygen transport
dependency on applied potential
Alexandre Nau, Clément Comminges* and Nicolas Bion*
Abstract:
The oxygen isotopic exchange technique is a powerful tool to investigate the oxygen transport kinetics in an oxide solid. In a solid oxide fuel cell, isotopic surface exchange and diffusion coefficients are classically determined by using the Isotopic Exchange Depth Profiling method followed by ex situ SIMS characterizations. Despite its relevance, the utilization of in situ or operando techniques to measure the isotopic exchange under an electrical bias remains marginal. We developed here a set-up which enables operando monitoring of oxygen exchange in SOFC type cells under polarization. The system has been used for studying the oxygen mobility dependency upon polarization on a symmetrical Pt/YSZ/Pt cell. Homomolecular and heterolytic exchange reactions were undertaken to investigate the oxygen activation step and discriminate the limiting step among the sequence of elementary steps which constitute the oxygen transport process in the SOFC system. Oxygen ions incorporation into the dense ionic conductor was identified to be the rate determining step, and its first order rate constant dependency on applied potential was established.
Introduction
Oxygen activation and diffusion are of paramount importance for various applications such as catalytic oxidation reactions,[1,2]
membrane reactors,[3,4] solid oxide fuel cells[5], electrolyzers,[6]
electrochemical promotion of catalysis[7,8]... The fine
understanding of mechanisms involved in oxygen activation and diffusion is therefore critical in the quest of efficient materials adapted to the aimed application, and its use requires knowledge in oxygen reactivity, and more specifically on its mobility. Oxygen reduction reaction (ORR) in solid oxide fuel cells is known to be the half reaction that limits SOFC’s performances. In the cathodic half cell (where the ORR occurs), the mechanism can be split into five elemental steps: i) dissociative adsorption of molecular oxygen at the catalyst surface, ii) surface diffusion of oxygen atoms from the catalyst surface to the triple phase boundary (TPB), iii) charge transfer to produce oxygen ions, iv) oxygen ions incorporation into the ionic conductive electrolyte and finally v) diffusion of ionized oxygen atoms in the bulk of the electrolyte. The rate of each step is depending on several parameters such as temperature, oxygen partial pressure and on the magnitude of the polarization. Oxygen Isotopic Exchange (OIE) is classically undertaken to study the oxygen diffusion through an oxide powder.[9] Although several studies report on the effect of
temperature and pressure,[10,11] very little is known on the effect of
electrode polarization on oxygen exchange mechanism.
Destructive ex-situ methods such as isotope exchange depth profile (IEDP) method have been employed to probe the oxygen mobility by using TOF-SIMS after OIE without polarization[12–14] and with polarization.[15] However, experimental methods that
enable operando monitoring of oxygen exchange in SOFC type cells is highly needed in order to decipher the effect of electrode polarization on oxygen mobility. Early works of Sobyanin et al. demonstrated the feasibility of such an experiment by performing homomolecular oxygen isotope exchange on a Pt/8-YSZ/Pt cell.[16] They concluded that at a moderate temperature of ca.
500°C, electrode polarization has no effect on the rate of oxygen homomolecular exchange with respect to its open circuit value. More recently, Wachsman et al. developed an operando setup for monitoring oxygen surface exchange on LSM, LSCF, LSC and LSF cathode powders while applying a cathodic bias. By applying a two-step mechanism involving dissociative adsorption (i.e. steps i) to iii) in the global mechanism discussed above) followed by incorporation of the oxygen ion in the oxide lattice (iv), they concluded that oxygen exchange coefficient (kex) increases exponentially with applied cathodic overvoltage.[17] This
experimental setup based on cathode powders is however differing from real electrochemical cells where the microstructure plays a significant role in performances. Khodimchuk et al. have developed an isotopic exchange setup to study the effect of the polarization on the reaction. By using a symmetrical cell Pt/YSZ/Pt, they have shown that kinetics of oxygen exchange depend on the electrode charge.[18]
The main goal of the present study is to identify the relationship between oxygen exchange/mobility and applied electrical bias on a Pt/8-YSZ/Pt as a model symmetrical cell, and shed light on the rate determining step.
Results and Discussion
In order to monitor precisely the influence of electrode polarization on the rate of oxygen exchange, one has to choose an adequate working temperature where the YSZ electrolyte is conductive enough to enable the O2- diffusion from the cathodic to the anodic
compartment, but not too high temperature so as to not activate too much both electrochemical and diffusion processes. Fig. 1 displays polarization curves with various temperatures at the atmospheric pressure (a) and various oxygen pressures at the selected temperature of 600°C (b).
[a] Institut de Chimie des Milieux et Matériaux de Poitiers (IC2MP), University of Poitiers, CNRS, 4 rue Michel Brunet, TSA51106, F86073 Poitiers Cedex 9, France.
Email: [email protected]; [email protected]
Supporting information for this article is given via a link at the end of the document.
The obtained voltammograms (Figure 1.a)) between 500°C and 700°C shows that decreasing the temperature leads to a significant decrease of the current density, a diffusion limiting current can be observed below 500°C. Moreover, it can be seen
that anodic and cathodic branches are symmetrical thus confirming that gas flux in the two compartments is homogeneous. This is also confirmed by the open circuit voltage of c.a. 40 mV which is very close to the theoretical value of 0 V, indicating a fair gas and temperature homogeneity between the two compartments. The working temperature of 600°C has been defined for this work.
The obtained voltammograms (Figure 1.b)) between 50 mbar up to an oxygen flow of 100 cm3.min-1 at atmospheric pressure
shows that decreasing oxygen pressure leads to a slight decrease of the current density but no diffusion limiting current is observed. This confirms that activation control is maintained even when operating the cell at low oxygen pressure. The voltammogram clearly displays two distinct zones. A first faradaic zone between -0.5 and +0.5 V (zoom in figure S1) which is characterized by two symmetrical waves whose intensities are dependent on the oxygen pressure. Electrochemical impedance spectroscopy (EIS) was employed
to characterize further these two distinct regions. At OCV (fig. 2a), a semi- circle whose diameter is dependent on oxygen pressure with a characteristic frequency of 200 Hz is attributed to the O2/O
2-redox couple in agreement with the data of Mitterdorfer et al.[19]
These waves are related to a two electron transfer with dissociatively adsorbed oxygen on Pt at the three phase boundary (TPB). According to Mizusaki et al., at the temperature of 600°C, there is a competition between two parallel pathways for charge transfer: molecular oxygen surface diffusion to the TPB (pathway a) or dissociative adsorption of O2 near the TPB (pathway b).[20]
In the situation presented in fig. 1, both regimes are observed. At low oxygen pressure (i.e. 50 mbar), a diffusion limited current is observed (the plateaus) corresponding to the molecular oxygen surface diffusion to the TPB prior electron transfer. As PO2
increases, this diffusion current drastically decreases thus favoring the second pathway (dissociative adsorption of O2 near
the TPB) as can be seen on figure S1. This second pathway is dominating at cell voltages below -0.5 V and above + 0.5 V. The Nyquist plot shown in figure 2a (at OCV) relates this evolution. A Gerisher impedance at high frequency mostly observed at OCV (diffusion process coupled to an electrochemical reaction: 45° straight line at the beginning of the charge transfer semicircle)[21]
showing the atomic oxygen surface diffusion. When PO2 increases
at OCV., the polarization resistance of this process increases as well. It shows that this pathway is disfavored compared to the dissociative adsorption of O2 directly at the TBP. This is also in
agreement with data of Mitterdorfer et al. who demonstrated that the surface diffusion coefficient of molecular oxygen rapidly
Figure 1. Evolution of the voltammogram for Pt/YSZ/Pt cell: a) at atmospheric pressure (flow of 100 cm3 min-1) with change on the
temperature (black: 500 °C; red: 600 °C; and blue: 700 °C); b) at 600 °C with change on the pressure of 16O
2 (black: 50 mbar; red: 100 mbar; blue: 250
mbar; orange: 400 mbar; and green: flow of 100 cm3 min-1 at atmospheric
pressure). Scan rate = 20 mV s-1.
Figure 2. Nyquist and Bode representations for the Pt/YSZ/Pt cell at 600°C at OCV (a, b), 0.6 V (c, d) and 1.5 V (e, f). (black: 50 mbar; red: 100 mbar; blue: 250 mbar; green: 400 mbar). The shoulder at 1 MHz on Bode plots is due to impedance of cables
a)
b)
c)
d)
increases at low oxygen surface coverage (θ<0.3).[19] This
suggests that when PO2 decreases, the surface coverage
decreases as well leading to an increase of the surface diffusion coefficient, and finally a smaller polarization resistance. Below -0.5 V ORR occurs and an additional faradaic current appears. Symmetrically, oxygen evolution reaction (OER) onset at ca. +0.5 V draws the corresponding anodic faradaic current. This means that the Pt/YSZ/Pt symmetrical cell can be run at the low oxygen pressure required for the isotopic exchange.
Additional evidences are provided by EIS. At the working temperature of 600 °C, it is observed that the electrolyte resistance is 50 Ω as can be seen on the high frequency intercept in the real axis of the Nyquist representation in Figure 2 a, c and e. This value of 50 Ω is rather high and is a consequence of the chosen temperature (600°C) that induces a moderate ionic conductivity. Therefore, the contribution of YSZ ohmic resistance is rather important at high current densities as it is shown on the corresponding voltammetries at 600°C corrected for ohmic drop (figure S2). This ohmic penalty corresponds to almost doubling the cell voltage at the highest current densities investigated. It seems also quite clear that the electrode kinetics for oxygen reduction and oxygen evolution reactions remains fast, despite the low ionic conductivity of the YSZ electrolyte. Another faradaic contribution is also observed at higher frequencies (around 30 kHz) and clearly visible at 0.6 V (figure 2d), less at 1.5 V, but not at OCV. This is attributed to the dissociative adsorption of O2 near
the TPB (pathway b). When this capacitive loop at 30 kHz appears, there is also the appearance of an inductive loop at low frequency. Both loops seem to be related. This low frequency inductive loop can be attributed to adsorbed oxygen species.[22]. Van Hassel et
al. demonstrated that the transient species Oad- surface coverage
is strongly potential dependent and concluded that inductive effects may occur whenever a stepwise electron transfer takes place towards adsorbed intermediates.[23] On the other hand,
Chen et al. concluded that the occurrence of low frequency inductive loops is primarily determined by the ability of the electrode materials to supply atomic oxygen for the reaction at the interface, and proposed a mechanism of competitive atomic oxygen supply and dissociative oxygen adsorption and diffusion.[24] Both models leads to the appearance of low
frequency loops and implies multiple transient adsorbates. From this EIS data at 600°C and 0.6 V (Figure 2c), we can determine the different resistances of 50 Ω for the solid electrolyte, 20-25 Ω for pathway a, and 20-25 Ω for pathway b. This means that polarization resistances are ca. 40-50 Ω, comparable to that of the solid electrolyte. Therefore the total cell resistance is equally split between the solid electrolyte conductivity and the polarization resistances.
Mass transfer limitation is a critical issue when assessing kinetic parameters. As can be observed on the Nyquist representations, no Warburg impedance is observed at low frequencies (finite diffusion: a 45° straight line should have appeared). The sole diffusion process that might be observed in this data can be seen at higher frequencies with a Gerisher behavior as discussed above. This is also naturally confirmed on the voltammetric measurements (figs. 1a and 1b) where no current limitation appears at high cell
voltage. The study of oxygen isotopic exchange was performed at T=600 °C, where all phenomenon (oxygen surface diffusion, electron transfer and electrolyte conductivity) can be observed without any clear dominant contribution. Under these experimental conditions (600°C and PO2 = 20 mbar), the oxidizing atmosphere on both
cathodic and anodic compartments prevents the YSZ reduction. Indeed, extremely low O2 pressures as well as
high overvoltage are required to trigger electrochemically the YSZ reduction and introduce a significant electronic conduction in the electrolyte.[25] We first investigated the
homomolecular exchange. On oxide-supported Pt sample, the reaction occurs according to a mechanism of adsorption-desorption and gives useful information on the oxygen activation process at the surface of metallic particles.[26]
Huang et al. have shown that at high temperature due to the mass transfer limitation the surface exchange has a low apparent activation energy (8 kJ.mol-1), when at low
temperature (with no mass transfer limitation) the value increases to 42.3 kJ.mol-1.[27] With our experimental setup we
calculated the activation energy of the initial rate of exchange (rq) of 50 kJ.mol-1(for experiment between 300 and 700°C,
figure S3), we can therefore assume that our system has no mass transfer limitation.
rq is defined as : 𝑟𝑞,𝑡=0= 2𝑁𝑔 𝑃0 [ 𝑑𝑃34 𝑑𝑡 ] (1)
Where Ng is the number of 18O+16O atoms in the gas phase;
P0 is the total pressure, t is the time of equilibration and P34
is the partial pressure of 18O16O.
As it can be seen in Figure 3, there is no influence of the electrode polarization on the rate of equilibration. It reinforces the previous result of Sobyanin et al.[16] who
reported the same conclusion at 510 °C and P(O2)= 0.5
mbar. In this range of temperature, there is no effect of the polarization on the oxygen activation process which is likely limited by the dissociative adsorption energy.
The heterolytic exchange was first undertaken at OCV (Figure 4a). A decrease in the partial pressure of 18O
2
(m/z=36) takes place as a function of increasing time during which the partial pressures of the two other oxygen isotopomers increase. The production 18O16O (m/z=34) is
distinctly predominant at the initial points of the exchange while the presence in the gas phase of 16O
2 (m/z=32) is
noticeable after 15 min. This evolution of the isotopic distribution is indicative of a simple mechanism of the exchange process which involves only one single O atom from the solid (eqn (12)). Because of the closed recycle system, 16O
2 is produced later on according to a consecutive
simple reaction (eqn (13)). The simple mechanism was already observed for the exchange of powder YSZ sample[28]
and is consistent with the ability of Pt to dissociate O2.[10]
However another explanation is proposed by Huang et al. who described how the measured values of the oxygen isotopologues are related to the surface concentrations of
16O and 18O.[27] In their explanation the production of 34 only
depends on the surface 18O coverage and could not inform
on the nature of heterolytic exchange mechanism.
When a similar experiment as above is performed in which 1.5 V cell potential is substituted for OCV, the mechanism of the reaction remains unchanged with preponderance of the simple exchange but an important increase of the kinetic is noticed (Figure 4b). Indeed it can be seen that the curves corresponding to the consumption of the 18O
2 and to the
production of 16O18O intersect after 50 min of reaction at OCV
against only 30 min when the cell is polarized. This result is reinforced by the suppression of the polarization at t=118 min which is concomitant with a decrease of the rate of exchange (slope discontinuity on the curves of the figure 4b). Closer inspection of the isotopic distribution shows that the production of 16O
2 was quicker under polarization than at
OCV.
Figure 5a illustrates the evolution of the gas-phase 18O
atomic fraction (hereafter denoted as g) as a function of time
at different magnitudes of cell polarization.
The general trend is that increasing the cell voltage systematically increases the exchange rate as compared to the OCV baseline. It is also worth noting that between OCV and 1V, the decrease of g seems to be more linear than that
observed above 1V.
Figure 6a illustrates the evolution of the gas-phase 18O
atomic fraction (hereafter denoted as αg) as a function of time
at different magnitudes of cell polarization. The general trend is that increasing the cell voltage systematically increases the exchange rate as compared to the OCV baseline. It is also worth noting that between OCV and 1V, the decrease of αg seems to be more linear than that observed above 1V.
This tends to show that two different regimes are observed, the first one corresponding to the pathway a) where oxygen diffusion to the TPB dominates, and the second one to the pathway b) O2/O2- faradaic region where g follows an
exponential decrease. Assuming that oxygen exchange is a first order reaction, the rate constant of the rate determining
Figure 4. Evolution of the gas-phase O2 isotopic distribution, during isotopic
exchange experiment on Pt/YSZ/Pt at 600°C at OCV (a); 1.5V (b) (blue: m/z=32 16O
2, red: m/z=34: 16O18O, black: m/z=36: 18O2, green: current
density)
Figure 5. Evolution of the amount of 18O in the gas phase with Pt/YSZ/Pt cell at different potentials (a), and evolution of the kinetic rate of exchange at different potentials (black: OCV, red: 0.6V, blue: 1V, orange: 1.5V, and green: 2V). The first order rate constant is determined from exponential fit using: g = 0 exp(-kt)
step (r.d.s) can be extracted by fitting the data in Figure 5a with eqn (2):
𝛼𝑔= 𝛼0 exp (−𝑘𝑡) (2)
where k is the first order rate constant of the r.d.s and t is time. An exponential increase of k with the applied cell voltage (Figure 5b) is observed, highlighting that cell polarization has an important effect in the rate of oxygen exchange. When looking at this evolution, one can draw the parallel with the Butler-Volmer law which describes an exponential increase of the rate constant for electron transfer with the applied overvoltage. The two electrode setup along with the short circuiting of gas atmospheres allows observing all elementary steps happening from the cathode to the anode. Therefore, the reaction sequence can be described as follows:
Dissociative adsorption of molecular oxygen in the cathodic side (eqn (3)):
18O
2,g + Pt* 2 18OPt ads (3)
Surface diffusion from the Pt active site to the triple phase boundary (TPB) (eqn (4)):
18O
Pt ads 18OTPB ads + Pt* (4)
Charge transfer at the cathodic TPB (eqn (5)):
18O
TPB ads + 2 e- 18O2-TPB cathode (5)
Incorporation of oxygen ions into YSZ (eqn (6)):
18O
2-TPB cathode 18O2-YSZ (6)
Oxygen diffusion in the bulk of YSZ to the anode TPB (eqn (7))
18O
2-YSZ 18O2-TPB anode (7)
The thick YSZ electrolyte implies that the amount of 18O
atoms incorporated is negligible compared to the number of
16O atoms present in the electrolyte. Therefore, an
accumulation of 18O atoms at the interphase cathode/
electrolyte is created.[29] The respect of the charge balance
in YSZ implies that 16O2- ions at the YSZ/ anode interphase
are pumped out to the anodic TPB and undergoes the charge transfer at the anode (eqn (8))
16O
2-TPB anode 16OTPB anode + 2 e- (8)
Surface diffusion from anode TPB to PtO active site (eqn (9))
16O
TPB anode 16OPtO anode (9)
Desorption (eqn (10)): 2 16O
PtO anode 16O2,g (10)
However, It can be seen on Figure 4 that at initial times the molecule 16O18O (m/z=34) is preferentially formed instead of 16O
2 (m/z=32), indicating that a competitive reaction to eqn.
10 is involved during the oxygen desorption at the anode side. Therefore, rapid surface exchange takes place at the anode surface between the 18O
2 which is also present in the
gas phase (identical atmosphere for both anodic and cathodic compartments) and the 16O
PtO anode before the
desorption reaction. This tends to further argue that surface exchange is a much faster reaction than incorporation or desorption.
When polarizing the cell in the O2/O2- faradaic region
(ΔE>1V, Figure 4b), additional oxygen atoms are transferred at the anode side at a rate determined by the Faraday’s law (i.e Q/2F). This additional amount is drove by the rate of the charge transfer reaction which is exponentially activated with overvoltage (eqn (5) and (8)). It is clearly evidenced by comparing the amount of oxygen atoms exchanged determined independently from the isotopic exchange experiment with the amount of oxygen atoms exchanged calculated from the Faraday’s law (Figure S4 to S7). When subtracting the amount of exchanged oxygen atoms at 1V to the amount exchanged at OCV, one finds the amount of exchanged oxygen atoms predicted from the faradaic current. This is valid at short times (t < 15 min) when the 18O
2
partial pressure in the gas phase is close to its initial value. In other words, the heterolytic exchange (observed at OCV) and the faradaic exchange are cumulative processes. The amount of 18O
Pt ads depends mainly on the molecular
oxygen partial pressure and the reaction temperature. In our experimental conditions, PO2 as well as T are constant in all
experiments. This means that under steady state conditions, the oxygen coverage, θ, is constant as well. Mitterdorfer et al. shown that rate constants for adsorption and desorption (eqn. (4) and eqn. (11), respectively) decreases exponentially when θ increases.[19] Upon polarization, the
rate of the two faradaic reactions (eqn (6) and eqn (9)) increases exponentially with the overvoltage according to the Butler Volmer kinetics. This induces an oxygen depletion at the cathodic TPB. This is the driving force that accelerates by the same proportion the rate of the surface diffusion reactions (eqn (5) and (10)). The direct consequence is an exponential increase in the rate of surface diffusion as it was proposed by Mitterdorfer et al.[19] for the Pt/YSZ system as
well as Horita et al. for the LSF/YSZ[15] and shows that neither
adsorption/desorption nor surface diffusion are rds. As the charge transfer reaction cannot be rds as well[30] and as the
O2- diffusion in the bulk of YSZ is very fast,[28] the sole realistic
possibility is that oxygen ions incorporation at the TPB is the rds (eqn (11)). This is in total agreement with Bouwmeester et al. who showed that oxygen incorporation is the rate limiting step on YSZ powders below ca. 800°C.[11] It is worth
noting that with our measurements O2- dis-incorporation from
YSZ cannot be excluded as the rds, since our setup cannot formerly discriminate between incorporation or dis-incorporation.
Conclusions
A novel experimental setup that enable operando monitoring of oxygen exchange in SOFC type cells under polarization was developed and has been used for studying the oxygen mobility dependency upon polarization on a Pt/YSZ/Pt symmetrical cell. Dissociative adsorption or associative desorption was identified to be the rate determining step. These two steps cannot be distinguished with the presented experimental setup due to the two electrodes configuration. Its first order rate constant increases exponentially with the applied overvoltage in the faradaic region. Additionally, homolytic exchange is observed to be independent of the polarization magnitude whereas heterolytic and Faradaic exchanges are cumulative processes. The polarized isotopic exchange method is a powerful and versatile tool for studying the mobility of reactive species for relevant energy conversion systems such as Solid Oxide Fuel Cells, Solid Oxide Electrolyser Cells or membrane reactors.
Experimental Section
A setup classically used for OIE experiments on powder oxide catalysts[31] was adapted for investigating OIE on
SOFC type cell. In the experimental setup developed for that purpose (Figure 6) the U-form reactor used for powder samples was replaced by a two compartment SOFC test bench (ProboStat A normal system, SS/S; NorECs) connected to a multi Autolab (Metrohm PGSTAT302N) for electrochemical measurements. This equipment was then placed in the closed recycle system and connected on one side to vacuum pump and on the other side to a mass spectrometer (Pfeiffer Vacuum QMS 200 Prisma TM).
The gas inlet and outlet of the anodic and cathodic sides are short circuited together in order to get a single atmosphere for both compartments. The total volume of cathodic and anodic chambers is 199.2 cm3.The masses 32, 34 and 36
m/z were monitored every 3 s. The mass 28 m/z was also
recorded to detect a possible leak. A pressure of 10-6 mbar
is maintained in the ionization chamber, while the total pressure in the test bench was around 20 mbar (modifications of pressure and temperature are discussed in the results and discussion part). A recycling pump (170 cm3
s-1) avoids any diffusion issues in the gas phase which would
limit the changes of the isotopic distribution monitored by the mass spectrometer.
The gas fluxes are slightly different in the anodic and cathodic compartments due to the different geometry of these two chambers.
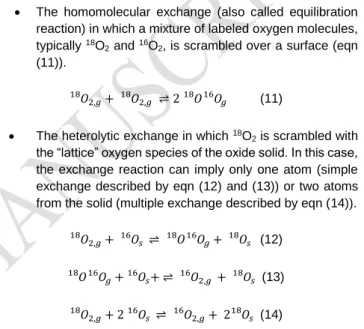
During the isotopic exchange different reactions can occur: The homomolecular exchange (also called equilibration
reaction) in which a mixture of labeled oxygen molecules, typically 18O
2 and 16O2, is scrambled over a surface (eqn
(11)). 𝑂2,𝑔 18 + 𝑂 2,𝑔 18 ⇌ 2 𝑂18 𝑂 𝑔 16 (11) The heterolytic exchange in which 18O
2 is scrambled with
the “lattice” oxygen species of the oxide solid. In this case, the exchange reaction can imply only one atom (simple exchange described by eqn (12) and (13)) or two atoms from the solid (multiple exchange described by eqn (14)).
𝑂2,𝑔+ 𝑂16 𝑠 ⇌ 18𝑂16𝑂𝑔+ 𝑂18 𝑠 18 (12) 𝑂 18 𝑂 𝑔 16 + 𝑂 𝑠+ ⇌ 𝑂16 2,𝑔 + 𝑂18 𝑠 16 (13) 𝑂2,𝑔+ 2 𝑂16 𝑠 ⇌ 16𝑂2,𝑔+ 2 𝑂18 𝑠 18 (14)
From the partial pressure of each isotopomer, one can calculate the atomic fraction of 18O in the gas phase (α
g) using the eqn (15)
𝛼𝑔=
1 2𝑃34+𝑃36
𝑃32+𝑃34+𝑃36 (15)
where P32, P34, P36 are the partial pressures of 16O2, 16O18O and 18O
2 respectively.
A symmetrical cell composed of 8-YSZ (from Tosoh) as electrolyte (diameter: 18.8 mm; thickness: 2.1 mm, density around 95%) and Pt electrodes (brush printed with ink from METALOR Technologies (UK) Ltd; diameter: 10 mm, 3 layers) has been used. The cell was submitted to an in-situ standard pretreatment consisting in an oxidation step at 700°C under a flow of 50 cm3.min-1 of pure 16O
2 (Alpha 2; Air Liquide) during 1 hour,
a decrease of the temperature at 600°C under the same flow and an outgassing at 600°C for 15 min. A 20 mbar dose of pure 18O
2
(99%, Shipper: Sigma-Aldrich Chemie GmbH) was then introduced into the reactor.
Acknowledgements
Figure 6. Isotopic exchange apparatus adapted for measurement on SOFCThe authors acknowledge financial support from the European Union (ERDF) and "Région Nouvelle Aquitaine".
Keywords: Isotopic exchange • oxygen electrochemistry • SOFC • Operando methods • Platinum
[1] M. A. Vannice, Catalysis Today 2007, 123, 18–22. [2] N. Bion, F. Can, X. Courtois, D. Duprez, in Metal Oxides in
Heterogeneous Catalysis, Elsevier, 2018, pp. 287–353. [3] A. F. Sammells, M. Schwartz, R. A. Mackay, T. F. Barton, D. R.
Peterson, Catalysis Today 2000, 56, 325–328.
[4] P.-M. Geffroy, J. Fouletier, N. Richet, T. Chartier, Chemical Engineering Science 2013, 87, 408–433.
[5] S. B. Adler, Chemical Reviews 2004, 104, 4791–4844.
[6] S. D. Ebbesen, S. H. Jensen, A. Hauch, M. B. Mogensen, Chemical Reviews 2014, 114, 10697–10734.
[7] P. Vernoux, L. Lizarraga, M. N. Tsampas, F. M. Sapountzi, A. De Lucas-Consuegra, J.-L. Valverde, S. Souentie, C. G. Vayenas, D. Tsiplakides, S. Balomenou, et al., Chemical Reviews 2013, 113, 8192–8260.
[8] M. N. Tsampas, F. M. Sapountzi, A. Boréave, P. Vernoux, Solid State Ionics 2014, 262, 257–261.
[9] V. Thoréton, Y. Hu, C. Pirovano, E. Capoen, N. Nuns, A. S. Mamede, G. Dezanneau, C. Y. Yoo, H. J. M. Bouwmeester, R. N. Vannier, J. Mater. Chem. A 2014, 2, 19717–19725.
[10] D. Duprez, in Isotopes in Heterogeneous Catalysis, Imperial College Press ; Distributed By World Scientific Pub, 2006, pp. 133–181. [11] H. J. M. Bouwmeester, C. Song, J. Zhu, J. Yi, M. van Sint Annaland,
B. A. Boukamp, Physical Chemistry Chemical Physics 2009, 11, 9640. [12] J. Kilner, B. Steele, L. Ilkov, Solid State Ionics 1984, 12, 89–97. [13] J.-M. Bassat, M. Petitjean, J. Fouletier, C. Lalanne, G. Caboche, F.
Mauvy, J.-C. Grenier, Applied Catalysis A: General 2005, 289, 84–89. [14] A. K. Opitz, A. Lutz, M. Kubicek, F. Kubel, H. Hutter, J. Fleig,
Electrochimica Acta 2011, 56, 9727–9740.
[15] T. Horita, T. Shimonosono, H. Kishimoto, K. Yamaji, M. E. Brito, H. Yokokawa, Solid State Ionics 2012, 225, 141–145.
[16] V. A. Sobyanin, V. I. Sobolev, V. D. Belyaev, O. A. Mar’ina, A. K. Demin, A. S. Lipilin, Catalysis letters 1993, 18, 153–164. [17] G. Cohn, E. D. Wachsman, Journal of The Electrochemical Society
2017, 164, F3035–F3044.
[18] A. V. Khodimchuk, M. V. Anan’ev, V. A. Eremin, E. S. Tropin, A. S. Farlenkov, N. M. Porotnikova, E. Kh. Kurumchin, D. I. Bronin, Russian Journal of Electrochemistry 2017, 53, 838–845.
[19] A. Mitterdorfer, L. J. Gauckler, Solid State Ionics 1999, 117, 203-217. [20] J. Mizusaki, K. Amano, S. Yamauchi, K. Fueki, Solid State Ionics
1987, 22, 323-330.
[21] B. Boukamp, Solid State Ionics 2003, 157, 29–33.
[22] D. A. Harrington, P. van den Driessche, Electrochimica Acta 2011, 56, 8005–8013.
[23] B. A. van Hassel, B. A. Boukamp, A. J. Burggraaf, Solid State Ionics 1991, 48, 139-154.
[24] K. Chen, N. Ai, S. P. Jiang, Solid State Ionics 2016, 291, 33-41. [25] J. Schefold, A. Brisse, M. Zahid, Journal of the Electrochemical
Society 2009, 156, B897-B904.
[26] C. Descorme, D. Duprez, Applied Catalysis A: General 2000, 202, 231–241.
[27] Y.-L. Huang, C. Pellegrinelli, E. D. Wachsman, ACS Catalysis 2016, 6, 6025–6032.
[28] M. Richard, F. Can, D. Duprez, S. Gil, A. Giroir-Fendler, N. Bion, Angewandte Chemie International Edition 2014, 53, 11342–11345. [29] H. Kishimoto, N. Sakai, K. Yamaji, T. Horita, M. Brito, H. Yokokawa, K.
Amezawa, Y. Uchimoto, Solid State Ionics 2008, 179, 347–354. [30] J. Mizusaki, K. Amano, S. Yamauchi, K. Fueki, Solid State Ionics
1987, 22, 313-322.
[31] D. Martin, D. Duprez, The Journal of Physical Chemistry 1996, 100, 9429–9438.
ARTICLE
Polarized isotopic exchange
revealed that ionized oxygen
incorporation
into
YSZ
is
exponentially accelerated with
applied overpotential
Alexandre Nau, Clément Comminges*
and Nicolas Bion*
Page No. – Page No.
Operando isotopic exchange on SOFC cells: oxygen transport dependency on applied potential