HAL Id: hal-02818030
https://hal.inrae.fr/hal-02818030
Submitted on 6 Jun 2020
HAL is a multi-disciplinary open access archive for the deposit and dissemination of sci-entific research documents, whether they are pub-lished or not. The documents may come from teaching and research institutions in France or abroad, or from public or private research centers.
L’archive ouverte pluridisciplinaire HAL, est destinée au dépôt et à la diffusion de documents scientifiques de niveau recherche, publiés ou non, émanant des établissements d’enseignement et de recherche français ou étrangers, des laboratoires publics ou privés.
Guidelines and methodology to analyze the different
case studies
Sophie Drogue, Jean-Philippe Gervais
To cite this version:
Sophie Drogue, Jean-Philippe Gervais. Guidelines and methodology to analyze the different case studies. [Other] 2010, 47 p. �hal-02818030�
Guidelines and methodology to analyze the different case studies
Draft, September 13, 2010Authors’ contact: John Beghin
Iowa State University, USA Beghin@iastate.edu
Caesar Cororaton
Virginia Tech University, USA ccaesar@vt.edu
Federica DeMaria
University of Calabria, Italy and INRA-AgroParisTech, France demaria.federica@agroparistech.fr Sophie Drogué INRA-AgroParisTech, France drogue@agroparistech.fr Marie-Hélène Felt
Université Laval, Canada Marie-Helene.Felt@eac.ulaval.ca
Jean-Philippe Gervais
North Carolina State University, USA JP_Gervais@ncsu.edu
Graciela Ghezan
INTA, Argentina
gghezan@balcarce.inta.gov.ar
Thomas Heckelei
University of Bonn, Germany thomas.heckelei@ilr.uni-bonn.de
Jikun Huang
Centre for Chinese Agricultural Policy, China Jkhuang.ccap@igsnrr.ac.cn Daniel Iglesias INTA, Argentina dhiglesi@gmail.com Daniel Lema INTA, Argentina danilema@correo.inta.gov.ar Natalia Karlova
Institute for Agricultural Market Studies, Russia Karlova@iet.ru
Heloisa Lee Burnquist
ESALQ, University of Sao Paulo, Brazil hlburnqu@esalq.usp.br
Fukunari Kimura
Japan
Vzf02302@nifty.ne.jp
Bruno Larue
Université Laval, Canada Bruno.Larue@eac.ulaval.ca
Rajesh Mehta
Research and Information System for Developing Countries rajeshmehta@ris.org.in
Mark Melatos
University of Sydney, Australia m.melatos@econ.usyd.edu.au
Luiza Meneguelli Fassarella
ESALQ, University of Sao Paulo, Brazil fassarel@esalq.usp.br
Marian Mraz
Slovak Agricultural University of Nitra, Slovakia marian236@yahoo.com
David Orden
Virginia Tech University, USA d.orden@cgiar.org
Tsunehiro Otsuki
Japan
otsuki@osipp.osaka-u.ac.jp
Mauricio Jorge Pinto de Souza
ESALQ, University of Sao Paulo, Brazil mauriciojps@hotmail.com
Jan Pokrivcak,
Slovak Agricultural University of Nitra, Slovakia jpokrivcak@yahoo.com
Dmitri Rylko
Institute for Agricultural Market Studies, Russia dmitri_rylko@hotmail.com
Juan Santini
INTA, Argentina
juansantini@yahoo.com.ar
Simon Schlueter
University of Bonn, Germany simon.schlueter@ilr.uni-bonn.de C. Tapia
INTA, Argentina Ciro.fafnet@gmail.com
Christine Wieck
University of Bonn, Germany Christine.wieck@ilr.uni-bonn.de
Niven Winchester
University of Otago, New Zealand niven.winchester@otago.ac.nz
Jun Yang
Centre for Chinese Agricultural Policy, China Yjydy.ccap@igsnrr.ac.cn
Contents
Contents ... 3
Introduction ... 5
A- Case studies using the gravity approach ... 6
1- Assessment of technical and sanitary norms and regulations upon poultry trade flows for the EU-27 and Brazil ... 6
2- Assessment of NTMs on poultry meat and dairy exports to China ... 8
3- The methodology for India’s Case Study on Poultry Meat & Eggs ... 9
4- Assessment of the impact of Maximum Level Residuals in exporting apples, pears and related processed products for the EU and selected competitors ... 11
5- Assessment of the impact of avian influenza-related regulatory policies on poultry meat trade and on exporters’ welfare ... 12
5.1 Objective ... 12
5.2 The gravity approach ... 13
5.3 The simulation approach ... 14
6 Assessment of the NTM implications on the EU competitiveness of dairy products on the Russian markets ... 15
6.1 Introduction ... 15
6.2 Methodology ... 16
6.3 Database ... 17
7- Assessment of sanitary NTM upon Beef trade flows for the UE (Germany) and Argentina ... 18
8- Assessment of sanitary NTM on lemon trade flows for the UE (Spain) and Argentina... 19
B- Case studies using partial or general equilibrium approaches ... 21
9- The Impact of Nontariff Measures on the Import of Pigmeat into Australia ... 21
9.1 Introduction ... 21
9.2 Theory ... 21
9.3 Estimation Method ... 22
9.4 Data ... 23
10- Impact of NTMs on EU dairy exports to the US: methodology and data overview ... 24
10.1 Introduction ... 24
10.2 Tariff equivalents of NTMs ... 24
10.3 The economic impacts of NTMs ... 25
10.4 Conclusion ... 29
11- Methodology of the case study on Canadian compositional standards for cheese ... 29
11.1 Introduction ... 29
11.2 Theoretical framework ... 29
11.3 Empirical framework ... 31
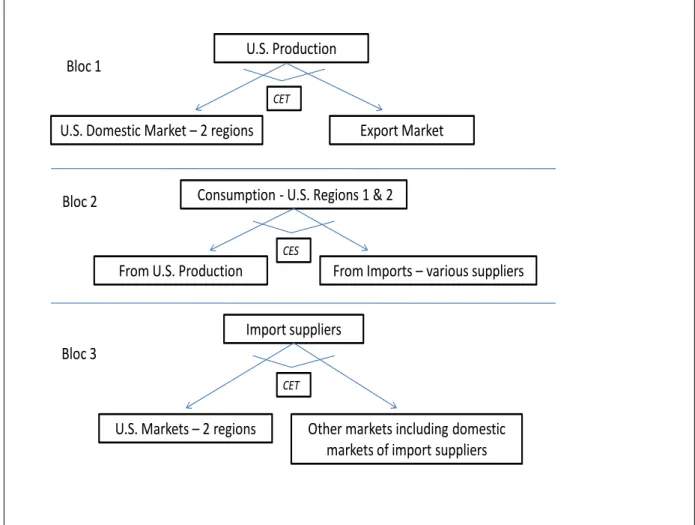
12- Description of the analytical tool of the citrus market case study ... 32
12.1 Model framework ... 32
12.2 Coding, calibration and empirical Extensions ... 35
13- Response of Poultry Meat Import to Incidence of Infectious Diseases and Standards on Pesticide and Veterinary Medicine Residues in Japan ... 35
13.1 Introduction ... 35
13.2 Empirical methodologies ... 36
13.3 Data ... 38
14- Impact of non tariff barriers on competitive edge of European imports of vegetables and fruits to Russia ... 38
Tables and illustrations
Figure 1 : Dairy production for regions with a disaggregated processed dairy sector ... 28
Figure 2 : Citrus simulation model ... 32
Table 1 : Link between the WP5 Framework for Regulatory Requirements and TRAINS ... 8
Table 2 : Regulatory policies for avian influenza ... 13
Table 3 : Bilateral AI-related policy matrix ... 14
Introduction
The literature on the economics of non-tariff measures (NTMs) in the agri-food sector is burgeoning and is motivated by growing concerns that efforts to liberalize trade could be impeded by an increasing number of NTMs. There have been many different approaches to analyze the market impacts of NTMs and Rau and Schlueter (2010) offer an excellent survey. The purpose of this document is to provide a description of the different methodologies used in the analysis of the case studies described in the working paper titled “Rationales for the selection of the case studies” which was produced by the consortium members of the NTM-Impact research project.
The methodologies in this document can be divided into two broad categories. In Part A, a first set of case studies employ gravity-based models to determine the impacts of NTMs on bilateral trade flows.
In their simplest form, gravity models - which borrows the precepts of the Newton theory on gravity - predicts that bilateral trade flows are increasing in the exporter’s GDP and the importer’s GDP and decreasing in distance between two nations. Many improvements and refinements have been made to the gravity framework since economists began estimating ad hoc gravity models in the 1960s. Since then, more sophisticated models add other variables to proxy for trade costs, such as whether or not two nations share a common border, a common language, or colonial relationships; have signed free trade agreements; separate dummies for each exporter and importer can also be included in the equation to account for multilateral resistance (Anderson and van Wincoop, 2003).
As an example a time-variant gravity model in its log-linearized form can be specified as follows1: 0 1 2 3 4 5 6 7 ( ) ( ) ( ) ( ) ( ) k ijt it jt ij ij ij k k k
ijt ijt ijt
Ln X Ln GDP Ln GDP Ln Dist Border Lang Ln Tarif NTM u
WhereX is the bilateral trade of product k between importer i and exporter j. ijk
GDP is the Gross Domestic Product of countries of the sample. They measure the economic size of countries under scrutiny but may be replaced or reinforced by the size of production in the exporting countries, the size of populations in all countries, etc.
ij
Dist is the distance between the capitals of countries i and j.
ij
Border is a dummy variable equal to 1 if i and j share a common border and 0 otherwise.
ij
Lang is a dummy variable equal to 1 if i and j share a common language and 0 otherwise.
k ij
Tarif is the tariff set by country i on imports of products k from country j.
k ij
NTM is any measure of the non tariff measure set by country i on imports of products k
from country j.
1 This is the basic specification common to all case-studies using gravity modeling. Then when presenting them in this
document, only the variables which are not included in this main setting will be described in details, particularly the ones used to take NTMs into account.
Finally, k ij
u is the error term.
The s are the coefficients to be estimated. Their sign depends on their influence on bilateral trade. 1 and 2 are expected to be positive because trade is expected to increase proportionally with countries’ wealth. 3 is expected to be negative because the distance is a proxy of transportation costs and is considered as an obstacle to trade. In the same way the coefficient for the tariff variable 6 is expected to be negative. 4 and 5 are expected to be positive because having a language or a border in common is considered as facilitating trade. When the size of the population is introduced in the equation the expected signs of the coefficients are negative or positive because a big country can export less (absorption capacity) or more (economies of scale) compared to a small country. The sign of7 is not a
priori predictable because the effect of a standard on trade is not a priori positive or negative.
Gravity models can be supported by different theoretical models and have consistently provided some of the greatest successes in empirical trade analysis (Davis and Weinstein, 2002). This document emphasizes the differences and departures from the main gravity setting in each of the case studies.
Part B of this document presents a second category of models including applied partial and general equilibrium methodologies. If gravity models allow to use econometric techniques and then avoid imposing a priori direction of trade, the advantage of the second kind of approaches is that they can capture sophisticated complementary and substitution possibilities at both the consumption and production levels. Most of the time, these models rely on some form of calibration exercise that make it difficult to assess the reliability of the model predictions statistically. Yet, the flexibility these models offer can be a definite advantage in modelling complicated policies and barriers to trade.
The heterogeneity in the methodologies proposed in this working paper is considered an asset for the NTM impact as it allows researchers to consider specific issues that would otherwise be impossible to capture in a more homogeneous framework. This advantage must be weighed against the difficulties in harmonizing the output of the case studies. A future working paper will address this policy question.
A- Case studies using the gravity approach
1- Assessment of technical and sanitary norms and regulations upon
poultry trade flows for the EU-27 and Brazil
H. Lee Burnquist, M.J. Pinto de Souza and L. Meneguelli
A product-level gravity equation – as presented in the introduction, will be used to investigate the effects of existing sanitary and phytosanitary regulations on Brazilian and European
Union (EU) poultry exports in selected markets. Whereas typical gravity equations are estimated for all ij pairs of countries in world trade, our dataset is specified for two sources of exports: Brazil and the EU. Thus, a trade flow observation in our dataset includes two exporters (i) shipping a particular poultry meat products (k), in time period (t) to j relevant importing markets. The set of n markets is allowed to differ for each i export origin according to its importance as an importing poultry market for Brazil and the European Union, respectively.
Two product-level gravity equations will be estimated within this framework. One equation will be set up considering Brazil as exporter and a set of selected major players in the international poultry market as importers, with data taken at a 6-digit HS disaggregation level. A second equation considers the EU-27 as exporter and a set of selected major players in the international poultry market as importers with data also taken at a 6-digit HS disaggregation level. Dummy variables are introduced to express the introduction of NTM by an importing country j applied to commodity k at period t.
The gravity model will be estimated using panel data disaggregated by different types of poultry meat, such that there may be considerable time and variation in the data that is not captured by the standard gravity model. To control for potential time and commodity variation in the data, a comprehensive set of time and commodity fixed effects is specified. One of the major advantages of this approach is to avoid biased coefficients since it provides control for country heterogeneity and therefore the effects of omitted non-observable variables which are difficult to measure (such as multilateral indices of resistance) (Cheng and Wall, 2005).
As the gravity equation is in its logarithmic form, it is implicitely assumed that zero trade flows do not exist. However, this is typically not the case, particularly when the database for the study is disaggregated (HS-4 or HS6 digit). To address the problem of “zeros” the model will be also estimated by Poisson pseudo-maximum-likelihood (PPML) as introduced by Santos Silva and Tenreyro (2006). This method has been considered appropriate for estimating gravity models when there is heteroskedasticity and null or missing bilateral flows in the database (Santos Silva and Tenreyo, 2006; Shepherd and Wilson, 2008).
Data on poultry meat exports will be obtained from UN/COMTRADE (the Commodity Trade
Statistics Data Base of the United Nation) at HS 6-digit level. The time period for the estimation is 1996 to 2008, representing the post-Uruguay Round time period when SPS and TBT agreements became effective within the multilateral WTO trading system. Bilateral applied tariffs will be obtained from the WTO. The source for GDPs statistics is the World
Development Indicators provided by the World Bank.
Dummy variables will be included to take into account the existence of NTMs in poultry trade. Information about the introduction of sanitary and phytosanitary, as well as technical requirements by WTO countries are based on notifications presented by Members between 1996 and 2008. In addition, the introduction of requirements will also be surveyed at national public and private institutions.
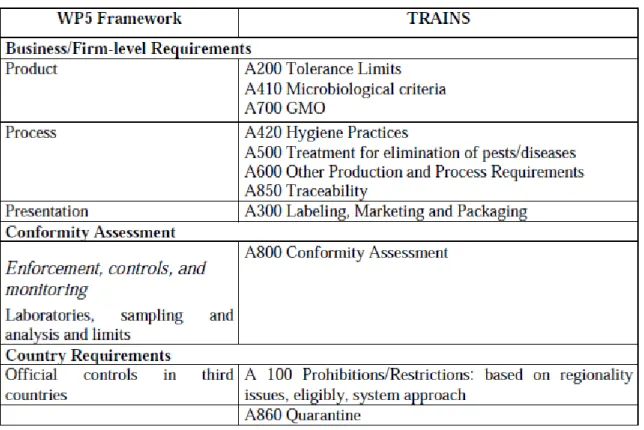
These requirements will be classified and organized according to TRAINS classification of NTMs and aggregated into a classification proposed by WP5 (and reproduced in Table 1. This classification will be used to specify five dummy variables to indicate the existence of different types of NTMs that affect trade of products from animal origin, such as the following list of variables:
NTM1: dummy variable that represents specific product requirements;
NTM2: dummy variable introduced to represent processes requirements;
NTM3: dummy variable to represent labeling requirements (presentation);
NTM4: dummy introduced to represent conformity assessment; and
NTM5: dummy introduced to represent country requirements
Table 1 : Link between the WP5 Framework for Regulatory Requirements and TRAINS
Source: NTM-Impact WP5, Deliverable D5.1
2- Assessment of NTMs on poultry meat and dairy exports to China
J. Yang and J. Huang
The purpose of the case study is to measure the effect of NTMs on EU exports for two groups of agrifood commodities (poultry meat, and dairy products) to China. The rationale behind the selection of these two commodities is described in the WP6 first deliverable of the NTM-Impact project. We propose a gravity model to evaluate the possible effects of NTMs on export of these two commodities from EU to China.
A gravity model (see introduction) has been chosen to model trade of commodity k (poultry meat and dairy products) between exporting country i and importing country j (i.e., China). Besides the usual variable (GDPs, distances, tariffs, etc.) an indicator of NTM (e.g., veterinary standards in commodity k) imposed by China is introduced.
The export value of a commodity k from trade partners to China is in 2000 US dollars. Data are from the UN/COMTRADE database. The period covered in the study is from1992 to 2009.
Instead of exporter’s GDP, the production of commodity k of China’s trade partners is used as the mass factor in the model. Production represents the potential capacity for export. This variable is expected to have a positive impact on export of the commodity to China. Production in the current year might be endogenous as it could be affected by the current export opportunities. However, we argue that current export would have no effect on the output of the previous year. To avoid any problem of endogeneity, this variable is lagged by one year. Data for production of the selected commodity are from the FAOSTAT database. As China is the only import country, the GDP of China is introduced in the model. Data from 1992 to 2009 are taken from the Statistical Yearbooks of China in 2000 constant US dollars. Data on distance between capitals come from the Centre d’Etudes Prospectives et d’Informations Internationales (CEPII).
The import tariff, is used as another resistance factor in the model. Import tariff rates imposed by China are taken from the Chinese Bureau of Customs.
Finally, NTMs are represented by two factors. The first one is the maximum residual limit standard of veterinary, denoted MRL. We assess here the effect of China’s MRL standard of coliform2 on import of poultry meat (HS0207) and dairy products (HS0401-0406). The data on China’s MRL of coliform are taken from the MRL database of the China National Food Safety Resource (NFSR). Imports of poultry meat are also significantly affected by the import restriction during the breakout of bird flu in other countries. A dummy variable (equal to 0 when there is no import restriction in case of bird flu; and equal to 1 when there is an import restriction) is used to capture the effects of import restriction on poultry meat.
3- The methodology for India’s Case Study on Poultry Meat & Eggs
R. MehtaWe propose to use the gravity model developed by Mehta and Nambiar3 to estimate the
impact of food safety standards (FSS) on trade between India and the EU. The two products identified for this purpose are poultry meat and egg powder.
Our model follows the typical specification described in the introduction, but some more variables are introduced in the right-hand-side of the equation: imports, size of populations of both the importer and exporter and an index of food safety standards (Sanitary and PhytoSanitary measures) in the importing countries.
2 According to the report in 2008 by the General Administration of Quality Supervision, Inspection and Quarantine of the
People’s Republic of China, there are many cases of withdrawal diary products and poultry meat from EU because of the violation of the MRL standard of coliform. Therefore, the change of MRL is chosen as the representative of changing standard of SPS regulation in China in current stage.
In the WTO perception, SPS measures (or Food Safety Regulations) imposed by importing countries are not considered as impediments to food trade. It implies that the coefficient of SPS index in our model should not be significant.
Our equation is a three-dimensional panel consisting of two sample product lines, for n importing countries and a four-year period from 2005 to 2008 (depending on the availability of data). The products under scrutiny are poultry meat and eggs; exporting countries are India, US, (and possibly EU or selected countries of EU, depending on availability of Index because the standards within EU countries could vary) ; time coverage is 2005 to 2008.
The characteristics of panel data imply that the random term (u) should capture the characteristics of food products and countries; hence
k k k k
ijt it jt ijt
u Then the model will be estimated by: (i) Ordinary Least Squares (OLS), (ii) Least squares with dummy variables ( being fixed) or Fixed Effects Model, and (3) assuming as random i.e. Random Effects Model. In the Random Effects Model, we have to further assume that
( ijtk) 0
E .
2 2 2
( kjt) ( itk) ( ijtk) ( ijtk, kjt) 0
Var Var Var Cov
The Random Effects Model will be estimated by the Generalised Least Squares (GLS). A two-step procedure will be used for estimation purposes. In the first step, the variance components (2, 2 and e2) will be estimated by using the residuals from a OLS regression.
In the second step, the flexible GLS estimates are computed using estimated variances from the first step.
The above methodology is given for one exporting country/region with n importing countries. We will try to expand this to m exporting countries (EU, US, Australia etc.) In that case three-dimensional panel data will become a four-three-dimensional and hence increase in number of observations and degree of freedoms.
Based on the estimated gravity equation, we will find how much trade is lost due to the heterogeneity in SPS index. The estimation of trade loss using Ordinary Least Squares or a ‘Fixed effects model’ is straightforward. However, in case the ‘Variance Component Model is selected, the percentage loss of imports from i to j is equal to:
1 2 1 0 (1 ) 1 exp ln( ) 1 100 (1 ) 2 k ij k ij NTM NTM ;
and loss in imports of j from i as:
1 2 2 0 (1 ) 1 exp ln( ) 1 100 (1 ) 2 k ji k ji NTM NTM where
2 2 1ln(1 ) 2ln(1 ) k k ij ji NTM NTM ,
k ij
NTM is the NTM measure (here the SPS standard) set by country i on imports from j and
vice-versa for k ji
NTM .
and 2
, 1and 2are the estimated coefficients of NTM and ijk NTM .kji
4- Assessment of the impact of Maximum Level Residuals in exporting
apples, pears and related processed products for the EU and selected
competitors
S. Drogué and F. DeMaria
The (3.4) case study analysis on apples4 has been updated to take into account some more products. In this case study we analyse the impacts of MLR of pesticides when exporting apples and pears and related processed products as juices and purees. MLR of pesticides vary greatly from a country to another. Even if the Codex has fixed international levels, some countries have standards that differ greatly from these levels. This is the case for example for Russia that applies MRL much stricter. We compare the impact of the difference in regulations for seven exporters (Argentina, Brazil, Chile, China, E.U, New Zealand and South Africa) on seven different import markets (Australia, Canada, Japan, Korea, Mexico, Russia and the US) in 2007-2009. The samples on which the econometric section is based consist of 7 bilateral trade relationships and 6 agricultural product lines at HS6-digit level.
We use a gravity model to estimate the impact of MLR regulations on trade of apples, pears and related processed products. The gravity equation is estimated by using both cross section and panel data. The model is specified as presented in the introduction, however some other variables have been introduced in the equation.
Data on trade are from UN/COMTRADE, GDPs and population data are from World Development Indicators of the World Bank (WDI). Data on distances are taken from the CEPII. Applied bilateral tariff data are from the MacMAp database of the CEPII. Besides these variables we introduce an index measuring the country i or j ‘s degree of transparency and corruption. Data come from Transparency International (www.transparency.org). The coefficient of this index is expected to be positive or negative depending on the degree of transparency and corruption of the importing country (Dutt and Traca, 2009).
A measure of the MLR of pesticides imposed by both importing and exporting countries on the products under scrutiny is added in the equation. This index is computed as the weighted average of the difference between country i and country j’ MLR of pesticides. Data are from MRL database of the USDA, Foreign Agricultural Service.
If the MRL index is positive [resp. negative] this means that the standards of the importer are laxer [resp. stricter] than the standards of the exporter. An increase [resp. decrease] in MRL implies a slackening [tightening] of the constraint. The coefficient of this parameter may be positive or negative. A negative coefficient means a positive impact on trade while a positive coefficient would imply a negative impact on trade.
In estimating a gravity model, there are some econometric issues to be addressed which are related to the non-observable heterogeneity of countries and to sample selection bias.
Country heterogeneity introduces a bias in the estimation because of the likely correlation between non–observable, country-specific effects and the explanatory variables of the gravity equation. Heterogeneity may be due to observable and unobservable factors (such as the propensity of a country to export more than others, cultural and historical links or business cycle effects), and/or to several other aspects of the relationships between each country-pair (i.e., common language, colonial past, shared border or religion). While these aspects based on observable factors can be handled by using a set of dummy variables, it is necessary to use a model with country fixed effects to control for non observable factors (Serlenga and Shin 2007). In order to take into account countries’ heterogeneity, we decompose the error term of equation in importing fixed effect, exporting fixed effect and product line fixed effect.
In presence of zero trade value, the log-linearization of gravity equations fails and leads to biased estimates. The issue of zero-trade flows has been widely addressed in the literature on gravity empirics (Martinez-Zarzoso et al., 2007; Martin and Pham, 2008; Santos Silva and Tenreyro, 2006). In particular, Santos Silva and Tenreyro (2006) contribute to the discussion as to which estimator provides the most reliable results by assessing the potential bias of elasticities in a log linearized regression. They show that the consistency of an OLS estimator depends on a restrictive assumption regarding the error terms and suggest that the gravity equation could be estimated in its multiplicative form by using the Pseudo Quasi Maximum Likelihood Method (PQML) based on a Poisson Model. Moreover since the standard Poisson model is vulnerable to problems such as over-dispersion and excess zero flows, we use other estimation techniques, i.e. the Zero Inflated Poisson (ZIP) and the Negative Binomial Regression (NBR), as in Burger et al. (2009).
5- Assessment of the impact of avian influenza-related regulatory policies
on poultry meat trade and on exporters’ welfare
T. Heckelei, S. Schlueter, C. Wieck
5.1 Objective
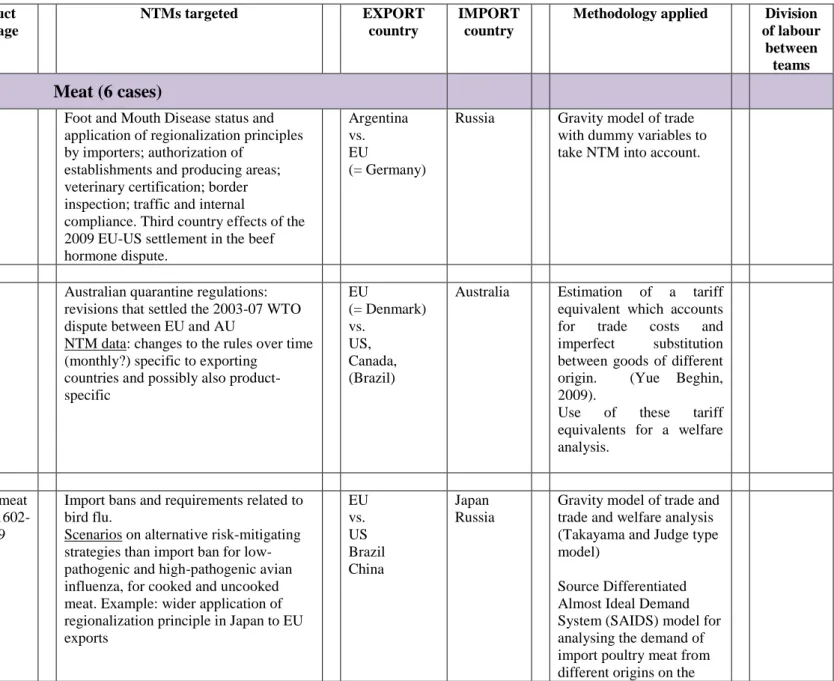
Sanitary and food safety concerns stemming from animal disease outbreaks have limited the growth in trade for meat exporting countries affected by trade bans. Given the growing importance of poultry meat in international trade, many countries implement drastic measures to restrict trade in poultry meat associated with a perceived or actual risk of transferring avian influenza (AI) into their geography.
The objective of this case study is twofold: First, past AI-related policies over the period 2000 – 2007 are evaluated in terms of their trade impact by using a sample selection gravity model approach. Second, feasible future policies are evaluated ex ante: The change of the exporters’ welfare due to variations in the importers’ regulatory policies with regard to avian influenza is analyzed based on the gravity model’s coefficient measuring the forgone trade linked to these policies and the resulting variations of both prices and quantities. The aspect of competitiveness of European poultry meat producers in terms of their potential to export is taken into account by comparing the trade and welfare effects of a change in import policies of two major importers - Japan and Russia – on four important poultry meat exporters –
Brazil, China, the EU25, and the USA - among each other. The welfare approach differentiates between two scenarios: (1) the implementation of an alternative regulatory policy to a ban in the case of low pathogenic notifiable avian influenza having a proportional risk mitigating effect; and (2) the implementation of an alternative regulatory policy to a ban in the case of high pathogenic avian influenza having a proportional risk mitigating effect.
5.2 The gravity approach
To receive coefficients measuring the forgone trade which can be incorporated into a welfare system a gravity model is estimated. We use a sample selection approach (Amemiya 1973, 1974, Helpman et al. 2008) accounting for the presence of zero trade flows. The estimation procedure includes two equations: First, the selection equation investigates the binary decision whether or not to trade and estimates this decision through a probit approach. Second, the level selection equation focuses on the quantity of trade. Poultry meat is split into two different product categories (uncooked5 and cooked6 poultry meat) which are connected
(e.g. via prices) in some fashion. This relationship probably results in correlation between regressors and errors when using the simple sample selection model for estimation and yields biased and inconsistent estimates. Therefore a simultaneous equation model is developed using a two-stage or a three-stage estimation system. The differentiation between uncooked and cooked poultry meat is necessary because regulatory policies with regard to AI differ among these two product categories (see below).
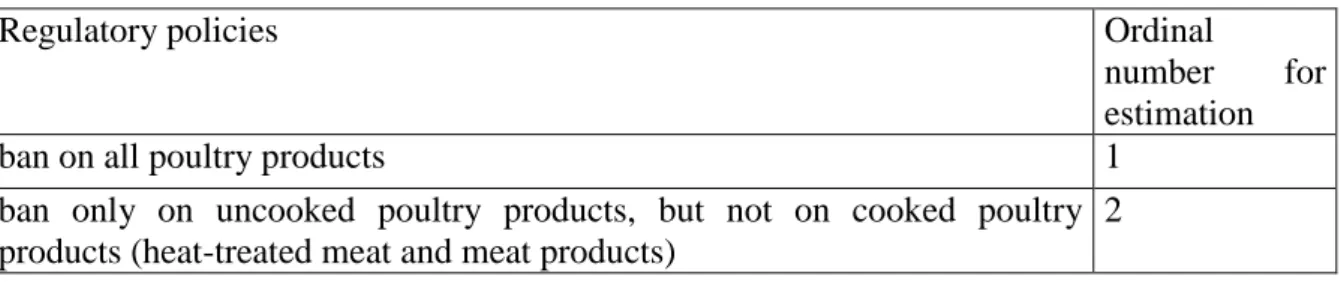
Following data for the years 2000 – 2007 are used in the gravity model: Trade data (in value terms and quantity) comes from UN/COMTRADE. Yearly prices are constructed by dividing trade value by trade quantity for each of the two product categories and each country-pair. Bilateral data on the explanatory variable geographic distance originates from the CEPII homepage. Weighted distance is chosen as the distance variable, where the EU25 is centered on Germany. A time dummy variable is included as well as country-specific fixed effects. Tariff data stem from the UNCTAD TRAINS database. If available, the bilateral effectively applied tariff is chosen; otherwise, the most-favored-nations tariff is incorporated. Poultry meat production and consumption quantities result from the statistical webpage of the FAO. Poultry meat production and consumption can be interpreted as parameters representing a country’s economic size in this sectoral analysis. We use poultry meat as an aggregate. The policy variable reflecting the importing country’s regulatory policy with regard to avian influenza is constructed as follows: We have developed an ordinal scale of three different applicable AI regulatory policies (Table 2).
Table 2 : Regulatory policies for avian influenza
Regulatory policies Ordinal
number for estimation
ban on all poultry products 1
ban only on uncooked poultry products, but not on cooked poultry products (heat-treated meat and meat products)
2
5 Uncooked poultry meat includes fresh, chilled, or frozen broilers, chickens, turkeys, ducks, geese, and guinea flows sold in
cuts, parts, or whole birds (HS 0207).
6 Cooked poultry meat includes all processed poultry products sold in preserved, smoked, prepared, or cooked form (HS
principle of regionalization within a country (disease-free zones) 3
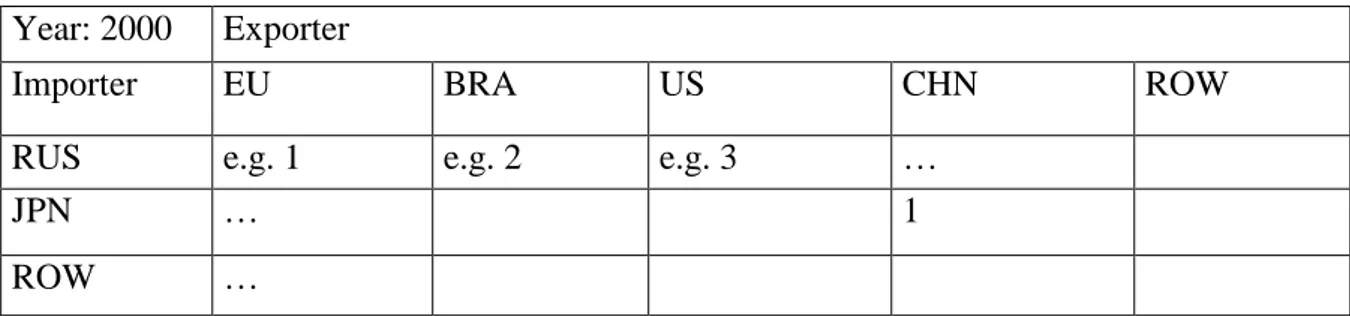
It is assumed that a ban on all poultry products is the most severe policy measure in terms of trade restrictiveness, whereas adhering to the principle of regionalization is least trade restrictive. Next, we analyze the two importers’ policy measures against each of the four exporting countries to receive a bilateral AI-related policy matrix for importation of poultry meat (Table 3). This is done for each year of the observed period 2000 – 2007. The period is chosen since the disease status of exporting countries with regard to AI has changed regularly during this period.
Table 3 : Bilateral AI-related policy matrix
Year: 2000 Exporter
Importer EU BRA US CHN ROW
RUS e.g. 1 e.g. 2 e.g. 3 …
JPN … 1
ROW …
The coefficient’s outcome of the AI-related policy variable is used to build a simulation model. If statistically significant, the estimates are integrated into the partial equilibrium model to separate the policy variation impact from other effects.
5.3 The simulation approach
In order to analyze the exporters’ welfare effects of a change in the importers’ regulatory policy with regard to avian influenza a Takayama-Judge type model for six types of poultry meat is developed. As depicted in Table 4 there are two meat categories: (1) cooked meat and (2) uncooked meat; and three exporting countries’ disease statuses, (1) free of AI, (2) low-pathogenic avian influenza (LPAI), and (3) high-low-pathogenic avian influenza (HPAI). Countries may ban the importation of poultry meat irrespective of whether the exporter has notified the outbreak of LPAI or HPAI and irrespective of the product category. However, findings of LPAI should not lead to import bans according to the provisions of the OIE (2009). Furthermore, heat-treated products could be safely traded regardless of the AI status of the exporting country. In compliance with the provisions of the OIE bans are only justified in case of uncooked meat originating from sources with HPAI and have to adhere to the principle of regionalization. Producers in affected regions is then given the possibility to shift fresh meat production to production of cooked meat as both meat categories are limb substitutes.7 The green and red cells of Table 4 indicate whether a ban is an appropriate measure for the respective meat category and disease status of the products’ origins for preventing the dispersion of AI.
Table 4: Meat categories
Exporter’s disease Meat category
7 The share of cooked poultry meat exports on total global poultry meat exports nearly doubled from 2004 to 2006 after
status Cooked meat Uncooked meat Source free of AI
Source with status LPNAI
Source with status HPAI
That means in the case of an exporting country having the status HPAI the potential importer can relax for instance its policy measure “ban on all poultry products” to a “ban only for uncooked products” allowing the import of heat-treated meat without changing the risk of importing a contaminated product. Two alternative policy scenarios will be analyzed in the welfare approach: (1) the implementation of an alternative regulatory policy to a ban in the case of LPAI and (2) the implementation of an alternative regulatory policy to a ban in the case of HPAI. We will try to include the consumers’ risk perception towards goods from origins with an AI status. It is assumed that consumers’ risk perception is not inevitably linked to the scientific risk associated with the product characteristic, i.e. consumers may overestimate the risk in the case of an actual food crisis. The risk perception is assumed to be time variant; after a period of one year the risk perception does not impact demand anymore. Following eight regions are included in the partial equilibrium model: Japan, Russia and ROWim (rest-of-world importers) as importing countries and Brazil, China, the EU25, the
USA and ROWex (rest-of-world exporters) as exporting countries. Each exporter is assigned
to one of the three AI disease statuses. Data on the disease status originates from the OIE. Demands and supplies are derived from a behavioral double-log function. We will also try other functional forms (such as functions accounting for the so called small-shares problem which arises in CES-based Armington specifications).
6 Assessment of the NTM implications on the EU competitiveness of dairy
products on the Russian markets
Marian Mraz and Jan Pokrivcak
6.1 Introduction
World cow´s milk production has been gradually increasing during the last decade. World milk production is expected to increase by 103 million tons (16%) between 2005 and 2015 (OECD-FAO 2006). In terms of the geographic coverage EU, USA and India are the world major milk producer countries followed by Russia Federation, Brazil, Ukraine and New Zealand. EU27 with its overall milk production represents 26 % of the world total production in 2008. The major European competitors on the Russian markets are in particular producers from countries like New Zealand, USA, Argentina and Ukraine.
World dairy exports have been growing over the last decade. The value of total dairy product exports reached 48.2 billion euros. In comparison between 2003 and 2008, the value of global dairy exports increased by 55.2 %. EU-27 dairy exports have been increasing in value during the whole period and reached 32.4 billion euros in 2008, which is a 41.7 % increase relative to the 2003.
EU exports of dairy products to Russia have been rising steadily, in particular cheese and butter. Among the major products exported from the EU are derived dairy products such as yogurts and butter. From the outlook for the next decade Russia is expected to remain a net importer of dairy products. The EU agricultural exports to Russia are increasing each year reaching in 2008 the level of around 11% of the total EU agricultural exports. EU exports of dairy commodities to Russia remain at around 1% of the total EU agricultural trade.
The major goal of this case study is to investigate the evidence on the existing non-tariff measures facing the EU27 dairy products exported to Russia and to compare the cost implications of the identified NTMs on the EU27 position on the Russian markets relative to other major exporters of dairy products to Russia. In addition, welfare analysis of the existing NTMs and potential changes in the strength of the current regulatory measures will be carried out. In order to capture the relativities between the EU27 and exporters from other countries competing on the Russian market, the underlying data describing the regulatory framework in all countries need to be collected and empirical models estimated.
6.2 Methodology
Within the initial stage of the study the background information on the adopted non tariff measures needs to be collected. Surveys among selected EU firms exporting dairy products to Russia will be carried out. These surveys are expected to provide further insights on how the non tariff measures affect firms’ costs structure as well as help identify the major issues behind the adoption of the NTMs while highlighting the institutional dimension of the overall process. Surveys on non tariff measures have been widely used by number of international organizations e.g. see OECD (1999) or USITC (1998) and are considered to be a source of useful information on their potential impacts.
In order to carry out a welfare analysis of the most significant non tariff measures identified through the surveys, tariff equivalents of the selected non tariff measures have to be estimated. Here econometric methods based on gravity equation will be used. Besides the usual variables we include in the equation exporter and importer GDPs per capita, and production per capita and a vector of variables capturing the relevant non tariff measures Trade policies of the individual countries will be modelled by country-specific fixed effects. Coefficients of exporter’s GDP per capita and importer’s GDP per capita have ambiguous signs from theoretical point of view.
Dealing with commodity specific trade e.g. with dairy products, a variable capturing the per capita milk production for both exporting as well as for importing countries is introduced. The coefficient associated with exporting countries is expected to be positive while that associated with importing countries is expected to be negative. A non tariff measure influencing dairy exports to Russia will be included into the gravity equation. It is possible that the standards will be quantified directly by a variable like the maximum residue levels allowed in imported products (Wilson and Otsuki, 2004, Otsuki, Wilson and Sewadeh, 2001). This method can be used if there is sufficient variability in the applied maximum residue limits and if this variable is relevant for international trade.
Otherwise frequency and coverage ratios measures will be used as in Nogues et al. 1986, OECD, 1995, Fontagne et al., 2005 and others. The deficiency of this method is that it does not differentiate between measures with significant impact on trade and those that do not
affect trade flows at all. Also the assumption that the higher the number of non-tariff measures and their wider application is conducive to restricting trade is not always true. There are some regulations that lead to increased trade as they reduce risk and provide relevant information to consumers. Moenius (2004) shows that trade increases when standards are mutually shared. Additionally exporter specific standards also promote trade while importer-specific standards promote trade in manufacturing while restricting trade in agriculture. The economic rationale behind this prediction comes from the interaction between compliance costs with the standard and information role of the standard that reduces search costs. Some gravity based approaches also use dummy variables that indicate the existence or absence of the non-tariff measures (Cao and Johnson, 2006 and Chevassus-Lozza et al., 2005).
Empirical estimation of gravity model suffers from the problem of heteroscedasticity and zero trade flows. Heteroscedastic errors lead to biased estimators (Silva Santos and Tenreyro, 2006). Zero trade flows occur because of errors, omissions, rounding and due to real absence of trade. The extent of zero trade flows is especially huge when disaggregated data are used. Zero values of dependent variable can lead to biased estimation. The reason is that the sample selection process is not independent from error terms and relevant explanatory variables are omitted. In the presence of heteroscedastic errors the Poisson pseudo maximum likelihood (PPML) estimator is the least biased. The PPML estimator however does not perform well when large proportion of observations is censored. In such a case, the least biased is estimator proposed by Eaton and Tamura.
The estimated tariff equivalent of the particular non-tariff measure represents an input into the structural model employed in order to carry out the numerical cross economy simulations of the relevant policy shock and evaluate its welfare implications. For our simulations we employ an aggregated version of the multi regional CGE model in lines with the GTAP model family. The model has been implemented in General Algebraic Modelling System (GAMS). Its aggregated version covers EU27, Russia and other major dairy product exporters on the Russian market. We stick with the traditional GTAP-like model structure such as long-term static setting and assume perfectly competitive markets with optimising agents. The model has been expanded with specific treatment of the four major dairy commodities allowing to pick the technological detail of dairy production as well as to accommodate the policy instruments implemented within their market organisation.
6.3 Database
Trade data have been collected from the UN/COMTRADE database. Gross domestic product will come from World Bank database and we draw on FAOSTAT database for production of commodities. Applied tariffs are taken from MacMAp CEPII tariffs database.
As a main source of information on the EU non tariff measures will serve the database developed within the WP4. The available data are expected to establish the existing level of the adopted measures in the EU 27 and serve further as a benchmark to evaluate the actual stringency of the other country policies relative to the EU27 requirements. Within the work carried out in WP4 also data on NTM’s employed in Russia are being collected. Some information on the adopted regulatory measures relevant for the dairy markets is adopted from
the market access database (MADB). The MADB includes background information on three regulatory measures applied by the Russia authorities for dairy products8.
The Russian Federal Law no. 88 FL of 12/6/2008 on milk and dairy products has introduced sanitary requirements such as residue levels of antibiotics and microbiological criteria, which differ from international standards. This legislation also covers both sanitary and quality requirements. Recently Russia informed about an additional requirement that the establishments shall have valid contracts with Russian importers for milk products supplies. Russia applies very strict MRLs which are far lower than the recognized limits set by
international bodies, even for allowed substances. While many pesticides and veterinary medicines are recognized as being not harmful for animals and humans by international bodies (with permitted MRLs) and are widely used in several countries worldwide are not permitted in Russia. Many of Russia's MRLs diverge from relevant international standards.
The procedures on approval and controls are used in non-transparent, discriminatory and disproportionate manner in some cases. There is not always a procedure in place to review complaints and to take corrective actions when a complaint is justified. The inspection procedures often appear non-transparent and inspection reports do not seem to reflect the actual level of hygiene of banned establishments. In addition, the procedure of listing of establishments has not been transparent.
7- Assessment of sanitary NTM upon Beef trade flows for the UE
(Germany) and Argentina
D. Lema, C. Tapia, G. Ghezan and D. Iglesias
The objective of the study is to measure the effect of non tariff measures on beef exports from Germany and Argentina. In this study, a gravity model will be used to evaluate the effects of existing sanitary NTM on German and Argentinean beef exports to selected markets.
Two product-level gravity equations will be estimated within this framework. One equation will be set up such that Germany is an exporter and with selected major players in the international beef market (importers and exporter) with data taken at HS4-digit level of desegregation. A second equation considers Argentina as exporter and a set of selected major players in the international beef market (importers and exporter) with data also taken at HS4-digit desegregation level.
The gravity model will be estimated using panel data. To control for potential time and commodity variations in the data, a comprehensive set of time and commodity fixed effects will be specified. One of the major advantages of this approach is that it provides control for
country heterogeneity and therefore the effects of omitted non-observable variables which are difficult to measure otherwise (Cheng and Wall, 2005).
Equations of this gravity model usually are specified in logarithmic form, assuming that zero trade flows do not exist. However, this is typically not the case, particularly at the current level of desegregation (HS4 digit). To address the problem of “zeros” the model will be also estimated by Poisson pseudo-maximum-likelihood (PPML) as introduced by Santos Silva and Tenreyro (2006). This method has been considered appropriate for estimating gravity models when there is heteroskedasticity and null or missing bilateral flows in the database (Santos Silva and Tenreyo, 2006; Shepherd and Wilson, 2008).
Data on beef exports will be obtained from UN/COMTRADE. The time period for the estimation is 1995 to 2005, representing the post-Uruguay Round time period when SPS and TBT agreements became effective within the multilateral WTO trading system. Bilateral applied tariffs will be obtained from the WTO. The source for GDPs statistics is the World Development Indicators provided by the World Bank.
Dummy variables will be included to take into account the existence of NTMs in beef trade. Information about the introduction of sanitary and phytosanitary, as well as technical requirements by WTO countries are based on notifications presented by Members between 1996 and 2008. In addition, the introduction of requirements will also be surveyed at national public and private institutions. These requirements will be classified and organized to specify dummy variables to indicate the existence of different types of NTMs that affect trade of products from animal origin.
8- Assessment of sanitary NTM on lemon trade flows for the UE (Spain)
and Argentina
D. Lema, J. Santini, G. Ghezan and D. Iglesias
The objective of the study is to measure the effect of non tariff measures on lemon exports from Spain and Argentina. The gravity framework selected for this analysis uses the theoretical model presented in introduction.
Two product-level gravity equations will be estimated within this framework. One equation will be set up considering Spain as exporter with a set of selected major players in the international lemon market (importers and exporters) with data taken at the HS4-digit desegregation level. A second equation considers Argentine as an exporter and a set of selected major players in the international lemon market (importers and exporter) with data also taken at the HS4-digit desegregation level.
The gravity model will be estimated using panel data. To control for potential time and commodity variation in the data, a comprehensive set of time and commodity fixed effects will be specified. One of the major advantages of this approach is that it provides control for country heterogeneity and therefore the effects of omitted non-observable variables which are difficult to measure otherwise (Cheng and Wall, 2005).
Equations of this gravity model usually are specified in logarithmic form, assuming that zero trade flows do not exist. However, this is typically not the case, particularly at this level of disaggregation (HS4 digit). To address the problem of “zeros” the model will be also estimated by Poisson pseudo-maximum-likelihood (PPML) as introduced by Santos Silva and Tenreyro (2006). This method has been considered appropriate for estimating gravity models when there is heteroskedasticity and null or missing bilateral flows in the database (Santos Silva and Tenreyro, 2006; Shepherd and Wilson, 2008).
Data on citrus exports will be obtained from UN/COMTRADE. The time period for the estimation is 1995 to 2005, representing the post-Uruguay Round time period when SPS and TBT agreements became effective within the multilateral WTO trading system. Bilateral applied tariffs will be obtained from the WTO. The source for GDPs statistics is the World
Development Indicators provided by the World Bank.
Dummy variables will be included to take into account the existence of NTMs in citrus trade. Information about the introduction of sanitary and phytosanitary, as well as technical requirements by WTO countries are based on notifications presented by Members between 1996 and 2008. In addition, the introduction of requirements will also be surveyed at national public and private institutions. These requirements will be classified and organized to specify dummy variables to indicate the existence of different types of NTMs that affect trade of citrus products.
B- Case studies using partial or general equilibrium approaches
9- The Impact of Nontariff Measures on the Import of Pigmeat into
Australia
J.C. Beghin and M. Melatos
9.1 Introduction
In quantifying the impacts of NTMs, two broad strategies have been adopted in the literature. The first involves the derivation of a ‘tariff equivalent’, typically measured as the difference between the domestic (protected) price and the world price of the imported good. This approach, however, necessarily assumes that import volume is positive; a domestic protected price must be observed. The second approach to NTM quantification involves the use of the gravity model to predict bilateral trade flows. Here too, however, the vast majority of studies assume that trade flows are positive. Both these traditional approaches are, therefore, problematic in cases where bilateral trade in a particular good is systematically zero, as is the case for pigmeat imports into Australia.
Australia imports pigmeat from Denmark, Canada and the United States. However, imports from a number of other European countries, namely Sweden and Finland, are zero despite the fact that the current quarantine regime does not, at least in principle, preclude the importation of pigmeat from these regions. We posit that the zero trade flows observed are the result of prohibitive trade costs and/or a reflection of the preferences of Australian consumers of pigmeat.
Yue and Beghin (2009) have developed a new technique for estimating the tariff equivalent and trade effects of a prohibitive NTM. Their approach, adopted in this study, combines Wales and Woodland’s (1983) Kuhn-Tucker approach to predict when corner solutions are likely to arise in a utility maximization framework with Yue et al. (2006) approach to measuring the tariff equivalent which accounts for trade costs and imperfect substitution between goods of different origin.
9.2 Theory
The representative consumer consumes two broad types of goods: pigmeat and a composite good of all other products. The composite good is designated the numeraire. Multiple varieties of pigmeat are available. The consumer’s utility function is additive in consumption of pigmeat and the composite good. With respect to how the consumption of pigmeat varieties contributes to consumer welfare, different functional forms will be tried. All specifications will have the ability to accommodate zero consumption levels; as in the linear expenditure system or random utility models with consumption thresholds, for example. With respect to the composite good, various functional forms are used to ensure robustness with respect to the marginal utility of income which is the first partial derivative of the utility function with respect to all other goods.
o First, consistent with Wales and Woodland’s (1983) random utility approach, we allow for stochastic preferences over different products. This variation enters each consumer’s utility function through consumption weights. These weights are functions of: (i) socio-demographic characteristics of the representative consumer, (ii) other factors that influence consumer preferences over different types of pigmeat (e.g., country of origin) and (iii) a vector of random components capturing preference variation only known to the consumer.
o Second, each variety has a minimum consumption threshold associated with it, which could also be explained by some shifters as just described
The representative consumer maximizes utility subject to her budget constraint and non-negative consumption of (all varieties of) pigmeat and the aggregate “all other consumption” good. Note that the domestic price of each pigmeat variety comprises a “world price” component and a trade cost component, itself made up of a “transportation cost” (here, geographic distance) component, an (ad valorem) tariff and the tariff equivalent of NTM policies affecting trade importation of the product, here pigmeat.
Many factors, apart from NTMs, can influence the demand for different varieties of pigmeat: input cost changes affecting meat cost (e.g. feed and labor costs for live animals) translating into a higher export unit value, exchange rate changes also affecting the export unit value perceived by the importer, prices of substitute products (e.g. chicken, mutton, beef etc) and market structure (e.g. size and vertical integration). These factors enter into demand decisions by affecting the unit price faced by the consumer
Since the Australian quarantine rules regarding pigmeat imports have changed regularly, we will try to estimate how the NTM tariff equivalent has changed over time for importers of pigmeat into Australia. In particular, significant changes in quarantine rules for pigmeat occurred in 1990, 1992, 1996, 1997 and 2004. We estimate the tariff equivalent associated with each NTM regime. This step will be conditioned on observing actual changes in trade flows once a prohibitive regime is removed.
Solving the consumer’s problem yields first-order necessary and sufficient Kuhn-Tucker conditions for all goods of interest j, i.e., for each variety of pigmeat and for the composite good. In each case, these FOCs take the form MUj pAustj where , the Lagrange multiplier, can be interpreted as the marginal utility of income. Provided consumption of the composite (numeraire) good is strictly positive, then the marginal utility of consumption of the composite good equals .
It is now possible to derive an expression for the random (i.e. unobserved) components of the utility function as a function of all the other model parameters which relate to observed data. This expression can then be used to calculate the joint distribution given that the consumer only consumes a positive amount of a subset of varieties of pigmeat. Assuming that the random components of consumer utility are IID and normally distributed, a log-likelihood function can be derived to estimate the tariff equivalent NTM and the parameters related to observed data.
9.3 Estimation Method
Using the methodology outlined in the previous section, we estimate the following 24 (at least) parameters:
o NTM tariff equivalent (at least 1, more if we are able to identify the trade impact of changes to the NTM regime either over time or by type of cut).
o Country of origin parameters for: Australia, US, Canada, Denmark, Sweden, Finland and Rest of the World (ROW). (7)
o Marginal impact of geographic distance on the domestic price of pigmeat in Australia (1)
o Marginal impact of socio-geographic characteristics on pigmeat demand for: Australia, US, Canada, Denmark, Sweden, Finland and ROW. (7)
o Minimum consumption thresholds for: Australia, US, Canada, Denmark, Sweden, Finland and ROW. (7)
o Marginal utility of the composite good. (1)
If the minimum consumption thresholds, when estimated, are significantly different from zero then we can conclude that the country of origin (or other attributes) of a given variety of pigmeat matter even if that variety is not consumed.
In the pigmeat market, different exporting countries tend to specialize in different types of cuts: Denmark (mainly middles for bacon), Canada (mainly legs and shoulders for ham) and the United States (mainly shoulders and legs). The fresh pork market and small goods markets for “ham-on-the-bone” and uncooked salami are supplied entirely from local production. Therefore, country-specific NTMs may in fact be “product-specific”. To model this, we can run the analysis on different cuts of meat separately; each modeling run would define “pigmeat” in a narrower way, effectively focusing attention on the impact of NTMs on the relevant bilateral trade relationships.
2nd Stage – Welfare Analysis
We also calculate the impact on Australian and foreign pigmeat producers of the removal of these NTMs. To do this, a partial equilibrium demand and supply model will be defined. Welfare effects will be estimated. The computation of welfare effects can be difficult with some functional forms of preferences because no close form solution exists to derive the mean and standard deviation of the compensating variation (see Yue and Beghin, 2009 and Phaneuf
et al., 2000).
9.4 Data
The following data is collected (or calculated) for the period 1980-2009. The period is chosen since Australian quarantine regulations have changed regularly between 1990 and 2004. We need data for a period long enough to envelope the period over which the NTM regime for pigmeat has changed. This will allow us to identify the impact of these regulatory changes.
Population, prices and bilateral exports of all countries that have (i) at least 2 years of positive trade flows in pigmeat with Denmark, Finland, Sweden and/or Australia and (ii) pigmeat consumption and production data reported by the FAO. This panel of “third countries” is used to approximate our representative consumer. The data are collected from the UN/COMTRADE database.
Individual country economic and demographic data (collected from the Penn World Tables). The distances between trading nations come from CEPII and are used to approximate transport costs.
The (FOB) bilateral export prices of Danish, US, Canadian and Australian pigmeat exports. When bilateral trade is zero, the unobserved export price is approximated by averaging FOB prices for all other exporters in that year.
The price of domestically produced pigmeat in Australia is approximated by their FOB price.
In markets outside of Australia and the EU, the price of pigmeat is a consumption-weighted average of imported and domestically-produced pigmeat.
Tariff rates on pigmeat imports into Australia and other countries.
If possible, we will also attempt to collect price data on substitute products such as chicken, mutton and beef).
10- Impact of NTMs on EU dairy exports to the US: methodology and data
overview
N. Winchester
10.1 Introduction
The case study will analyse the impact of non-tariff measures (NTMs) on EU cheese exports to the US. Cheese is a significant agricultural export for the EU and accounts of around one-third of total EU dairy exports (Eurostat, 2009). It is beneficial to focus on EU cheese exports to the US as EU products account for nearly 73% of US imports of this commodity (USDA, 2009). The study will use a gravity approach to estimate ad valorem tariff equivalents (TEs) of NTMs and include these estimates in a bespoke computable general equilibrium (CGE) model to estimate the impact of NTMs on production, trade and welfare. In addition to modelling EU production and trade in detail, the model will also consider responses from the EU’s major competitors in the EU cheese market (New Zealand, Switzerland and Australia). 10.2 Tariff equivalents of NTMs
Ferrantino (2006) identifies three approaches to quantify TEs of NTMs: (i) “handicraft” price gap methods, (ii) price-based econometric approaches, and (iii) quantity-based econometric methods. Handicraft methods estimate the price gap between domestic and international prices. Price-based econometric methods take advantage of systematic reasons why prices in some countries are higher than prices in other countries. Quantity-based econometric methods infer the impact of NTMs by comparing actual trade flows with a “free trade” benchmark.
Handicraft approaches are generally considered to be more accurate than “mass produced” econometric methods but the data and time required to implement handicraft studies can be unreasonable. Following Nahuis (2004), Philippidis and Carrington (2005), Philippidis and Sanjuán (2007a, 2007b) and Winchester (2009), we estimate TEs of NTMs using a series of gravity equations – as introduced in the present document - as this approach uses easily accessible trade data.
Residuals from the gravity equation can be used to estimate impediments to trade such as NTMs. Specifically, a difference between actual ( ) and predicted ( ) exports indicates the presence of a trade barrier not specified in the gravity equation. The size of the trade barrier is estimated from:
where σ is the elasticity of substitution between varieties from different countries and τij is the
TE of unobservable trade restrictions applying to exports from i to j.
Data and estimation techniques
Data on bilateral exports is sourced from UN/COMTRADE database. For distance, we employ harmonic-mean weighted distance measures available from the CEPII.9 Guided by Head and Mayer (2002), bilateral distance between two countries is calculated as population-weighted average distances between the major cities belonging to those two countries. Data for our dummy variables capturing the effects of contiguity, sharing a colonial relationship (equal to one if two nations have had a colonial relationship after 1945) and speaking a common language (equal to one if a language is spoken by at least 9% of the population in both nations) are also sourced from CEPII.
Guided by Silva Santos and Tenreyro (2006), gravity equation is estimated using the Poisson pseudo–maximum likelihood (PPML) estimator. That is, we implement a Poisson regression of exports on the logarithm of distance, contiguous, common language and colonial heritage dummy variables, and importer and exporter fixed effect dummy variables.10 As the PPML estimator is unlikely to fully account for heteroskedastcity we base inference on robust standard errors.
10.3 The economic impacts of NTMs
Our numerical simulations employ a modified version of the ‘GTAP7inGAMS’ model. GTAP7inGAMS draws on version seven of the Global Trade Analysis Project (GTAP) database (Narayanan and Walmsley, 2008) and is programmed using the General Algebraic Modeling System (GAMS). The GTAP database lists data for 113 regions and 57 sectors and
9 See http://www.cepii.fr/anglaisgraph/bdd/distances.htm.
10 Silva Santos and Tenreyro (2006) show that estimating the gravity equation in multiplicative form using the
(PPML) estimator has several advantages over applying OLS to the log-linear model. First, using Jensen’s inequality the authors show that estimating a gravity equation in logarithms using OLS can lead to severely biased and inconsistent estimates when heteroskedastcity is present. Second, as the logarithm of zero is undefined, the sample must be truncated or the dependent variable rescaled when exports between a particular pair of countries are zero.