HAL Id: hal-00318223
https://hal.archives-ouvertes.fr/hal-00318223
Submitted on 22 Nov 2006
HAL is a multi-disciplinary open access
archive for the deposit and dissemination of
sci-entific research documents, whether they are
pub-lished or not. The documents may come from
teaching and research institutions in France or
abroad, or from public or private research centers.
L’archive ouverte pluridisciplinaire HAL, est
destinée au dépôt et à la diffusion de documents
scientifiques de niveau recherche, publiés ou non,
émanant des établissements d’enseignement et de
recherche français ou étrangers, des laboratoires
publics ou privés.
On the distribution of energy versus Alfvénic correlation
for polar wind fluctuations
B. Bavassano, R. Bruno
To cite this version:
B. Bavassano, R. Bruno. On the distribution of energy versus Alfvénic correlation for polar wind
fluctuations. Annales Geophysicae, European Geosciences Union, 2006, 24 (11), pp.3179-3184.
�hal-00318223�
© European Geosciences Union 2006
Geophysicae
On the distribution of energy versus Alfv´enic correlation for polar
wind fluctuations
B. Bavassano and R. Bruno
Istituto di Fisica dello Spazio Interplanetario, Istituto Nazionale di Astrofisica, Rome, Italy Received: 21 July 2006 – Accepted: 18 October 2006 – Published: 22 November 2006
Abstract. Previous analyses have shown that polar wind
fluctuations at MHD scales appear as a mixture of Alfv´enic fluctuations and variations with an energy imbalance in favour of the magnetic term. In the present study, by sep-arately examining the behaviour of kinetic and magnetic en-ergies versus the Alfv´enic correlation level, we unambigu-ously confirm that the second population is essentially re-lated to a large increase of the magnetic energy with respect to that of the Alfv´enic population. The relevant new result is that this magnetic population, though of secondary impor-tance in terms of occurrence frequency, corresponds to a pri-mary peak in the distribution of total energy. The fact that this holds in the case of polar wind, which is the least struc-tured type of interplanetary plasma flow and with the slow-est evolving Alfv´enic turbulence, strongly suggslow-ests the gen-eral conclusion that magnetic structures cannot be neglected when modeling fluctuations for all kinds of wind regime.
Keywords. Interplanetary physics (MHD waves and
turbu-lence; Sources of the solar wind) – Space plasma physics (Turbulence)
1 Introduction
Since the first continuous observations of solar wind per-formed by Mariner 2 in 1962 it was recognized the exis-tence of a correlation of Alfv´enic type between velocity and magnetic field fluctuations (Coleman, 1967; Unti and Neuge-bauer, 1968). At almost the same time, analyses of 1965– 1966 Pioneer 6 data gave evidence of the filamentary struc-ture of the interplanetary magnetic field (Bartley et al., 1966; McCracken and Ness, 1966), described as bundles of mag-netic tubes of force embedded in the solar wind. Thus, al-ready at the very beginning of the space exploration the main ingredients of the solar wind variability at MHD scales were well identified.
Correspondence to: B. Bavassano
(bavassano@ifsi-roma.inaf.it)
In the next decades impressive advances have been done thanks to the increasing quality of plasma and magnetic field measurements, performed on extended ranges of solar dis-tance and latitude in the heliosphere. Fundamental contri-butions have been also given by new analysis methods and use of advanced concepts to describe the behaviour of so-lar wind fluctuations. Several reviews offer exhaustive dis-cussions about all this (e.g., Goldstein et al., 1995a; Tu and Marsch, 1995; Bavassano et al., 2004; Bruno and Carbone, 2005).
Still, there are points that need further analyses. One is that of the energy distribution among the various components of solar wind fluctuations. In particular, the question addressed here is that of how the kinetic and magnetic energies are dis-tributed between Alfv´enic and non-Alfv´enic disturbances or, versus the level of the Alfv´enic correlation.
Past studies (e.g., Bavassano et al., 1998) have shown how the normalized residual energy (defined as the difference be-tween kinetic and magnetic energies divided by their sum, see section on data analysis) varies with the Alfv´enic corre-lation. In the present study, instead of using a normalized quantity, we will directly look at the kinetic and magnetic energy values. This will be done for two different samples of the polar solar wind. This is the wind that is typically ob-served in the high-latitude heliosphere for conditions of low solar activity. A fast, teneous, and steady flow, as compared to low-latitude conditions, the polar wind is the best example in the heliosphere of an almost structureless flow. As typi-cal of the fast wind regime (Tu and Marsch, 1995), the polar wind is characterized by the presence of a strong flow of fluc-tuations of Alfv´enic type (e.g., Goldstein et al., 1995b; Smith et al., 1995; Bavassano et al., 2000).
2 Data analysis
Our analysis is based on data of the solar wind plasma and magnetic field experiments aboard Ulysses, the first space-craft that, with a highly inclined orbital plane with respect to the ecliptic, has been able to explore the heliosphere up
3180 B. Bavassano and R. Bruno: Energy versus Alfv´enic correlation
Table 1. Start and end times (year, day, hour), minimum and
max-imum distances (R, in AU), and latitudes (λ, in degrees, northern hemisphere) of the core (first row) and boundary (second row) in-terval.
time interval R λ
min max min max
1995 176 13 – 1995 260 17 1.77 – 2.36 72.5 – 80.2
1996 106 17 – 1996 182 23 3.65 – 4.02 32.8 – 40.1
to 80◦of latitude, with extended full immersions in the po-lar wind. The available plasma data are the fluid velocity vector (averaged over proton and alpha-particle populations), the proton number density, the alpha-particle number density, and the proton temperature. The time resolution is either 4 or 8 min, depending on the spacecraft mode of operation. As regards the magnetic field, the data used are 1-min averages of both components and magnitude, computed from higher resolution measurements.
In the present study we will use two samples selected from the northern leg of the Ulysses’ first out-of-ecliptic orbit, when the polar wind is exceptionally stable (McComas al., 2000). Both intervals are three solar rotations long, as seen by Ulysses. Their time, distance, and latitude ranges are given in Table 1. The interval of the first row, in the following indicated as “core” interval, corresponds to a top-latitude cut of the Ulysses’ trajectory, while that of the second row, in the following indicated as “boundary” interval, is from the dis-tant polar wind, near the low-latitude boundary of the polar flow.
Before describing the analysis method we would like to recall that two different Alfv´enic populations are usually present in the solar wind (e.g., see review by Tu and Marsch, 1995), one of fluctuations propagating, in the wind plasma frame, away from Sun (outward population) and the other of fluctuations propagating towards the Sun (inward popu-lation). Outside the Alfv´enic critical point, where the solar wind becomes super-Alfv´enic, both kinds of fluctuation are obviously convected outwards as seen from the Sun. Gen-erally most of the energy comes from the outward popula-tion. The Sun is the major source for outward fluctuations, with smaller contributions from interplanetary sources. Con-versely, inward fluctuations can only come from sources out-side the Alfv´enic critical point, since inout-side this point inward waves fall back to the Sun (for the completeness it should be mentioned that they might originate inside the critical point as well, if they initially propagate outward and then are scat-tered backward due to some non-linear process).
The computational scheme of our analysis is simple. In a first step, for each plasma velocity vector V we have determined the corresponding magnetic field vector B by averaging over 4 (or 8) min, then have derived the
corre--1
-0.5
0
0.5
1
R
F
0
1
2
3
4
5
core polar wind
-1
-0.5
0
0.5
1
-1
-0.5
0
0.5
1
C
R
F
0
1
2
3
boundary polar wind
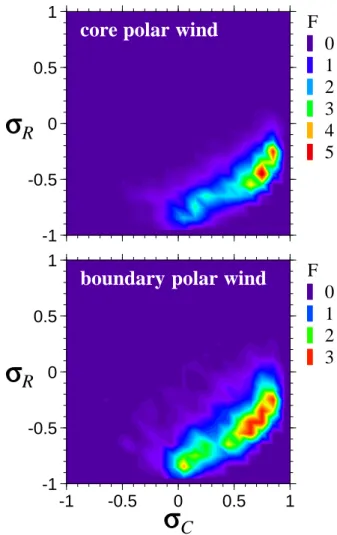
Fig. 1. Distribution of the occurrence frequency F (in per cent) in
the plane σC-σRfor core (top) and boundary (bottom) polar wind
intervals. Note that the scale for F is different in the two panels.
sponding Els¨asser’s variables Z±(Els¨asser, 1950), defined as V ±B/√4πρ (with ρ the mass density, computed by includ-ing both proton and alpha-particle contributions). These vari-ables are ideally suited to separately identify Alfv´enic fluc-tuations propagating in opposite directions (e.g., see Tu and Marsch (1995) for a discussion on their use). When studying Alfv´enic fluctuations in solar wind, it is useful to have that Z+(Z−) fluctuations always correspond to an outward (in-ward) propagation, whatever the direction of the background magnetic field is. This request is fulfilled by applying the above definition only when the background field has a sun-ward component along the local spiral direction, while for the opposite magnetic polarity Z±is taken as V ∓ B/√4πρ. In the following we will apply this dual definition. Obvi-ously, in the case of folded (or S-shaped) field configura-tions, erroneous outward/inward classifications are obtained. This, however, occurs for a quite small number of cases (see Balogh et al., 1999).
10 100 1000
core polar wind
(km2/s2)
e
B
boundary polar wind
-1 -0.5 0 0.5 1 10 100 1000 (km2/s2)
C
e
V
-1 -0.5 0 0.5 1C
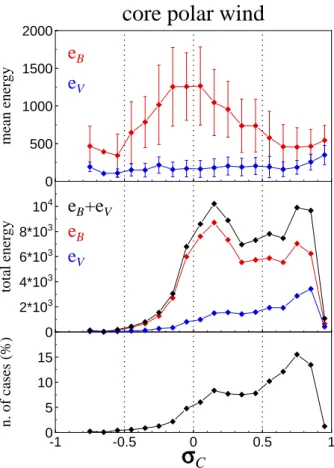
Fig. 2. σC-eB(top) and σC-eV (bottom) scatter plots for core (left)
and boundary (right) polar wind intervals.
In the next step, from the time series of V , B/√4πρ, Z+, and Z−we have computed the corresponding total variances eV, eB, e+, and e−, as given by the trace of the variance
ma-trices. These values give a measure of the energy (per unit mass) associated to the various fluctuating fields in a given frequency band, determined by the data sampling time (see above) and by the averaging time used to evaluate variances. Results discussed here refer to hourly variances. With this choice we essentially focus on fluctuations in the core of the inertial Alfv´enic regime (e.g., Goldstein et al., 1995b; Hor-bury et al., 1995). We would like to underline that, as already mentioned, the computed energies are for unit mass. In par-ticular, when dealing with the magnetic energy eB, one has
to keep in mind that it is the variance of B/√4πρ, namely the magnetic field scaled to Alfv´en units or, the Alfv´en speed.
Finally, from the above quantities we have derived two normalized differences, namely 1) the normalized residual energy σR=(eV−eB)/(eV+eB), a measure of the energy
shar-ing between kinetic and magnetic fluctuations, and 2) the normalized cross-helicity σC=(e+−e−)/(e++e−), a measure
of the energy sharing between the two components (outward and inward) of the Alfv´enic fluctuations. The normalized cross-helicity gives also a measure of the level of corre-lation between velocity and magnetic fluctuations (Roberts
0 500 1000 1500
2000
core polar wind
mean energy
e
Be
V -1 -0.5 0 0.5 1 0 5 10 15 C n. of cases (%) 0 2*103 4*103 6*103 8*103 104 total energye
B+e
Ve
Be
VFig. 3. Energy distributions versus cross-helicity for core polar
wind. The top and middle panels give mean and total values of the
magnetic (red) and kinetic (blue) energies (in km2/s2) for 0.1-bin of
σC, respectively. In the top panel error bars are standard deviations.
In the middle panel the black line refers to the sum of magnetic and kinetic energies. The bottom panel gives the number of cases (in
per cent) for each σCbin.
et al., 1987). In fact (Bavassano et al., 1998), provided that σR6=±1, the correlation coefficient is σC/
p
1−σR2(note the
constraint σC2+σR2≤1).
3 Magnetic and kinetic energies versus cross-helicity
Figure 1 shows 2-D frequency distributions of σC and
σR hourly values for the analysed polar wind intervals. As
expected on the basis of previous analyses by Bavassano et al. (1998, 2005), in both cases essentially the same pat-tern is observed, with a prominent peak near σC∼0.8 and
σR∼−0.5 and a tail extending towards σC∼0 and σR∼−1,
with a secondary peak near the end. The main peak is easily interpreted in terms of wind regions dominated by outward (Z+) Alfv´enic fluctuations, while the secondary peak corre-sponds to an ensemble of fluctuations with a strong energy imbalance in favour of the magnetic term. Not surprisingly (e.g., see Bavassano et al., 2000), for the core sample the
3182 B. Bavassano and R. Bruno: Energy versus Alfv´enic correlation
0 250 500 750
1000
boundary polar wind
mean energy
e
Be
V -1 -0.5 0 0.5 1 0 5 10 15 C n. of cases (%) 0 103 2*103 3*103 4*103 5*103 total energye
B+e
Ve
Be
VFig. 4. The same as in Fig. 3, for boundary polar wind.
Alfv´enic peak is more pronounced than for the boundary sample.
Obviously, plots as those in Fig. 1 do not allow to under-stand if cases falling near (0,−1) in the σC–σR plane have
to be related to an increase of magnetic fluctuations, or to a decline of velocity fluctuations, or to both events. Moreover, from a normalized quantity as σR it is impossible to
under-stand the relative weight, in terms of energy content, of the different kinds of fluctuation. These points are addressed in Fig. 2, where scatter plots of cross-helicity and energy val-ues are given in σC–eB(top) and σC–eV (bottom) planes for
the core (left) and boundary (right) polar sample. The energy levels are different in the two samples (higher in core polar wind), but the overall pattern is the same, with the decrease of cross-helicity (in absolute value) essentially associated to a robust increase of the magnetic energy eB. In the following
we will indicate this ensemble of fluctuations as “magnetic population”.
To further investigate these features the −1 to 1 σCrange
has been divided into 20 bins and for each subset of data falling in a bin we have computed means, standard devia-tions, and total values of magnetic and kinetic energy. Total values are defined as product of the mean value by the
per-0.01 0.1 1 10 100
e
Bt
/e
Br
0.01 0.1 1 10e
Bn
/e
Br
-1 -0.5 0 0.5 1 0.01 0.1 1 10 Ce
Bn
/e
Bt
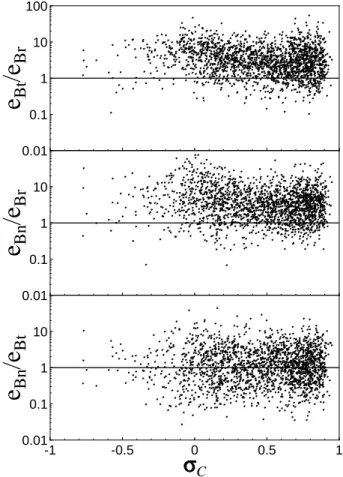
Fig. 5. Geometrical properties of the magnetic fluctuations versus
cross-helicity for the core polar wind sample. Plotted data are the
ratios between values of eBalong the rt n frame axes (see definition
in the text).
centage of cases in the bin (this makes meaningful a com-parison between total energies from samples with a different number of data). Plots of all these quantities are given in Figs. 3 and 4 for the core and boundary interval, respectively. The top panel of each figure shows the variation with σC of
the mean values, with standard deviations as error bars (red for magnetic energy, blue for kinetic energy). The middle panel is for the total eB and eV values (again red and blue
lines, respectively) and for their sum (black line). The bot-tom panel gives the percentage of cases for each σCbin.
Again, trends are similar in the two figures, though with different energy levels (scales are higher of a factor of two for the core sample). The curves in the top panels confirm that low (in absolute value) cross-helicity corresponds to a strong increase in the energy of fluctuations of magnetic type (velocity fluctuations only have a weak decrease for σCfrom
∼1 to ∼0.7). A second point to be stressed is that (see mid-dle panels) the low cross-helicity population, though a sec-ondary peak in terms of number of cases, is a major peak in the distribution of total magnetic energy (red curve). Given
the low level of total kinetic energy, this also holds for the sum of total energies (black curve). Thus, from the point of view of the energy content of solar wind fluctuations, the magnetic population is seen to play a primary role. It is wor-thy of note that this feature is more pronounced for the near-boundary, and more distant, polar wind.
4 Geometrical properties of the magnetic fluctuations versus cross-helicity
Given the predominant role of the magnetic fluctuations it seems useful to further characterize them by looking at a possible dependence on σC of their geometrical properties.
This has been done for the core polar wind sample, when the background magnetic field is nearly radial (average spiral an-gle of 8.5◦). In a first approximation, this geometry allows to
separate parallel and perpendicular (to the background field) fluctuations by directly using the rt n reference axes of the Ulysses data (r outwards along the Sun-spacecraft line, n northwards in the plane defined by r and solar rotation axis, and t to complete a right-handed system).
Figure 5 shows the ratios between eBr, eBt, and eBn(the
eB values along r, t, and n axes, respectively) as a function
of σC. For all the σCrange the magnetic fluctuations appear
characterized by 1) an equipartition between transverse fluc-tuations (see eBn/eBtin the bottom panel) and 2) a
predom-inance of these fluctuations with respect to the radial ones (see eBt/eBr and eBn/eBr in top and middle panel,
respec-tively). It is worthy of note that this last feature becomes more pronounced as σC goes to 0. In other words, for low
cross-helicity the fluctuations tend to be more planar (in a plane nearly perpendicular to the background magnetic field) than for cross-helicity approaching 1.
5 Discussion and conclusion
Previous studies (Bavassano et al., 1998, 2005) have shown that polar wind fluctuations at hourly scale essentially are a mixture of 1) variations of Alfv´enic type and 2) variations characterized by σC∼0 and σR∼−1.
In the present analysis, by separately examining the be-haviour of eB and eV versus σC, we have unambiguously
confirmed that the second population is essentially related to a large increase of the magnetic energy with respect to the levels typically observed for the Alfv´enic population.
The relevant new result is that this magnetic population, though of secondary importance in terms of occurrence fre-quency, corresponds to a primary peak in the distribution of total (magnetic plus kinetic) energy. Thus, from the point of view of the energy content of solar wind fluctuations, the magnetic population plays a primary role.
As regards geometrical properties, the magnetic popu-lation appears to be made of fluctuations more planar, in a plane roughly perpendicular to the background magnetic
field, than those of the Alfv´enic population. This is remi-niscent of quasi-two-dimensional fluctuations, first discussed by Matthaeus et al. (1990) to account for the Maltese-cross shape of the 2-D magnetic correlation function (with the caveat that no analysis is done here for the propagation vec-tors, that for 2-D fluctuations have to be transverse to both the background and the fluctuating fields). Yet, it should be noted that the observed geometry may well come from coro-nal magnetic flux tubes that, turbulently mixed, are swept out by the solar wind (e.g., see Thieme et al., 1990). Planar mag-netic structures embedded in the solar wind were discussed in detail by Tu and Marsch (1991), who named them “mag-netic field directional turnings”. A recent study of Bruno et al. (submitted, 2006)1shows how remarkable their role is for solar wind variability.
In conclusion, though the polar wind is a weakly struc-tured plasma flow (e.g., McComas et al., 2000) with a slowly evolving Alfv´enic turbulence (Goldstein et al., 1995b; Hor-bury et al., 1995), in the hourly-scale domain the ensemble of magnetic structures appears to have a total energy con-tent comparable to that of the Alfv´enic population. This strongly supports the view that magnetic structures cannot be neglected when modeling MHD fluctuations for all kinds of wind regime. Efforts done in the past (Tu and Marsch, 1993; Schmidt and Marsch, 1995; Schmidt, 1995) to combine the effects of Alfv´en waves and convective structures should be further developed.
Acknowledgements. The use of data of the plasma analyzer
(princi-pal investigator D. J. McComas, Southwest Research Institute, San Antonio, Texas, USA) and of the magnetometers (principal investi-gator A. Balogh, The Blackett Laboratory, Imperial College, Lon-don, UK) aboard the Ulysses spacecraft is gratefully acknowledged. The data have been made available through the World Data Center A for Rockets and Satellites (NASA/GSFC, Greenbelt, Maryland, USA). We are indebted to G. Consolini for very fruitful discussions. The present work has been supported by the Italian Space Agency (ASI) under contract I/035/05/0 ASI/INAF-OATO.
Topical Editor B. Forsyth thanks G. Erd¨os and another referee for their help in evaluating this paper.
References
Balogh, A., Forsyth, R. J., Lucek, E. A., and Horbury, T. S.: He-liospheric magnetic field polarity inversions at high heliographic latitudes, Geophys. Res. Lett., 26, 631–634, 1999.
Bartley, W. C., Bukata, R. P., McCracken, K. G., and Rao, U. R.: Anisotropic cosmic radiation fluxes of solar origin, J. Geophys. Res., 71, 3297–3304, 1966.
Bavassano, B., Bruno, R., and Carbone, V.: MHD turbulence in the heliosphere: evolution and intermittency, in: The Sun and
1Bruno, R., D’Amicis, R., Bavassano, B., Carbone, V., and
Sorriso-Valvo, L.: Magnetic field directional turnings as an impor-tant component of the solar wind turbulence, Ann. Geophys., 2006.
3184 B. Bavassano and R. Bruno: Energy versus Alfv´enic correlation the heliosphere as an integrated system, edited by: Poletto, G.
and Suess, S. T., Kluwer Academic Publishers, Dordrecht, The Netherlands, Astrophysics and Space Science Library, 317, 253– 282, 2004.
Bavassano, B., Pietropaolo, E., and Bruno, R.: Cross-helicity and residual energy in solar wind turbulence: radial evolution and latitudinal dependence in the region from 1 to 5 AU, J. Geophys. Res., 103, 6521–6529, 1998.
Bavassano, B., Pietropaolo, E., and Bruno, R.: On the evolution of outward and inward Alfv´enic fluctuations in the polar wind, J. Geophys. Res., 105, 15 959–15 964, 2000.
Bavassano, B., Pietropaolo, E., and Bruno, R.: Alfv´enic fluctuations in “newborn” polar solar wind, Ann. Geophys., 23, 1513-1520, 2005,
http://www.ann-geophys.net/23/1513/2005/.
Bruno, R. and Carbone, V.: The solar wind as a turbulence lab-oratory, Living Rev. Solar Phys. 2, also available: http://www. livingreviews.org/lrsp-2005-4, 2005.
Coleman Jr., P. J.: Wave-like phenomena in the interplanetary plasma: Mariner 2, Planet. Space Sci., 15, 953–973, 1967. Els¨asser, W. M.: The hydromagnetic equations, Phys. Rev., 79,
183–183, 1950.
Goldstein, M. L., Roberts, D. A., and Matthaeus, W. H.: Magneto-hydrodynamic turbulence in the solar wind, Annu. Rev. Astron. Astrophys., 33, 283–325, 1995a.
Goldstein, B. E., Smith, E. J., Balogh, A., Horbury, T. S., Goldstein, M. L., and Roberts, D. A.: Properties of magnetohydrodynamic turbulence in the solar wind as observed by Ulysses at high heli-ographic latitudes, Geophys. Res. Lett., 22, 3393–3396, 1995b. Horbury, T. S., Balogh, A., Forsyth, R. J., and Smith, E. J.:
Obser-vations of evolving turbulence in the polar solar wind, Geophys. Res. Lett., 22, 3401–3404, 1995.
Matthaeus, W. H., Goldstein, M. L., and Roberts, D. A.: Evidence for the presence of quasi-two-dimensional nearly incompress-ible fluctuations in the solar wind, J. Geophys. Res., 95, 20 673– 20 683, 1990.
McComas, D. J., Barraclough, B. L., Funsten, H. O., Gosling, J. T., Santiago-Mu˜noz, E., Skoug, R. M., Goldstein, B. E., Neuge-bauer, M., Riley, P., and Balogh, A.: Solar wind observations over Ulysses first full polar orbit, J. Geophys. Res., 105(A5), 10 419–10 433, 2000.
McCracken, K. G. and Ness, N. F.: The collimation of cosmic rays by the interplanetary magnetic field, J. Geophys. Res., 71, 3315– 3318, 1966.
Roberts, D. A., Klein, L. W., Goldstein, M. L., and Matthaeus, W. H.: The nature and evolution of magnetohydrodynamic fluctua-tions in the solar wind: Voyager observafluctua-tions, J. Geophys. Res., 92, 11 021–11 040, 1987.
Schmidt, J. M.: Spatial transport and spectral transfer of solar wind turbulence composed of Alfv´en waves and convective structures 2: Numerical results, Ann. Geophys., 13, 475–493, 1995, http://www.ann-geophys.net/13/475/1995/.
Schmidt, J. M. and Marsch, E.: Spatial transport and spectral trans-fer of solar wind turbulence composed of Alfv´en waves and con-vective structures 1: The theoretical model, Ann. Geophys., 13, 459–474, 1995,
http://www.ann-geophys.net/13/459/1995/.
Smith, E. J., Balogh, A., Neugebauer, M., and McComas, D. J.: Ulysses observations of Alfv´en waves in the southern and north-ern solar hemispheres, Geophys. Res. Lett., 22, 3381–3384, 1995.
Thieme, K. M., Marsch, E., and Schwenn, R.: Spatial structures in high-speed streams as signatures of fine structures in coronal holes, Ann. Geophys., 8, 713–723, 1990,
http://www.ann-geophys.net/8/713/1990/.
Tu, C.-Y. and Marsch, E.: A case study of very low cross-helicity fluctuations in the solar wind, Ann. Geophys., 9, 319–332, 1991, http://www.ann-geophys.net/9/319/1991/.
Tu, C.-Y. and Marsch, E.: A model of solar wind fluctuations with two components: Alfv´en waves and convective structures, J. Geophys. Res., 98, 1257–1276, 1993.
Tu, C.-Y. and Marsch, E.: MHD structures, waves and turbulence in the solar wind: Observations and theories, Space Sci. Rev., 73, 1–210, 1995.
Unti, T. W. J. and Neugebauer, M.: Alfv´en waves in the solar wind, Phys. Fluids, 11, 563–568, 1968.