HAL Id: hal-00778011
https://hal.archives-ouvertes.fr/hal-00778011
Submitted on 18 Jan 2013
HAL is a multi-disciplinary open access
archive for the deposit and dissemination of
sci-entific research documents, whether they are
pub-lished or not. The documents may come from
teaching and research institutions in France or
abroad, or from public or private research centers.
L’archive ouverte pluridisciplinaire HAL, est
destinée au dépôt et à la diffusion de documents
scientifiques de niveau recherche, publiés ou non,
émanant des établissements d’enseignement et de
recherche français ou étrangers, des laboratoires
publics ou privés.
Inverting hyperspectral images with Gaussian
Regularized Sliced Inverse Regression
Caroline Bernard-Michel, Sylvain Douté, Laurent Gardes, Stephane Girard
To cite this version:
Caroline Bernard-Michel, Sylvain Douté, Laurent Gardes, Stephane Girard. Inverting hyperspectral
images with Gaussian Regularized Sliced Inverse Regression. ESANN’08 - 16h European Symposium
on Artificial Neural Networks, Apr 2008, Bruges, Belgium. pp.463-468. �hal-00778011�
Inverting hyperspectral images with Gaussian
Regularized Sliced Inverse Regression
C. Bernard-Michel1, S. Dout´e2, L. Gardes1 and S. Girard1
1- MISTIS - INRIA Rhˆone-Alpes
655 avenue de l’Europe - Montbonnot - 38334 Saint Ismier Cedex, France 2- Laboratoire de Plan´etologie de Grenoble
Bˆat. D de Physique - B.P. 53 - 38041 Grenoble, France
Abstract. In the context of hyperspectral image analysis in planetology, we show how to estimate the physical parameters that generate the spec-tral infrared signal reflected by Mars. The training approach we develop is based on the estimation of the functional relationship between param-eters and spectra, using a database of synthetic spectra generated by a physical model. The high dimension of spectra is reduced by using Gaus-sian regularized inverse regression to overcome the curse of dimensionality. Compared with a basic k-nearest neighbors approach or a Partial Least Square (PLS) regression, estimates are more accurate and are thus promis-ing.
1
Introduction
Visible and near infrared imaging spectroscopy is a key remote sensing technique to study and monitor planets. It allows the detection, mapping and character-ization of minerals, as well as volatile species, that often constitute the first step toward the resolution of key climatic and geological issues. These tasks are carried out by the spectral analysis of solar light reflected in different di-rections by the materials forming the top few millimeters or centimeters of the ground. Physical properties of the surface, such as chemical composition, gran-ularity, texture, and physical state are some of the most important parameters that characterize the morphology of the hundred thousand spectra that typi-cally constitute an image. Modeling the direct link between these parameters and observable spectra is usually called the forward problem in classical physics. It can be evaluated numerically by radiative transfer models, simulating the propagation of solar light through the atmosphere and surface to the sensor. It allows us, for given values of the model parameters, to simulate the spectra that should be observed. Conversely, deducing the physical model parameters from the observed spectra is called an inverse problem. It generally cannot be solved analytically, and the use of optimization or statistical methods becomes necessary. From a general point of view, solving inverse problems requires that the fundamental physics are adequately understood, such that a function, G, may be specified that relates the spectra X = (X1, . . . , Xd) and the parameters
Y = (Y1, . . . , Yp):
Once this relationship G is known, different methods can be used to deduce the parameters Y from the observable X. They can be roughly divided in three categories:
• Optimization algorithms are the most traditional approaches. They consist of minimizing an objective function that expresses the similarity between an observed spectrum and a simulated one. For example, this function may be the mean square errors function, where the errors are the differences between observed and simulated reflectances at each wavelength. These methods involve numerical optimization techniques (Powell’s method, Sim-plex method, quasi-Newton method...) starting with an initial guess of the parameters and searching for the optimum parameters via an iterative process that minimizes the merit function [10]. In fact, estimations are un-stable since inverse problems are often ill-posed (solutions are not unique and a small change in the data can lead to enormous differences in the estimations). A probabilistic approach can then be used in inverse prob-lems by introducing a prior distribution on model parameters [13]. These approaches are computationally expensive since they iteratively simulate new spectra. Therefore, they cannot be applied in the case of the inver-sion of an image with several hundred thousand pixels. Moreover, they can sometimes fall into local minima if the merit function is not convex. • Look-up table / k-nearest neighbors approach (k-NN): In order to replace
a heavy runtime computation with a simpler look-up operation, a large database (look-up table) is generated by radiative transfer for many pa-rameter values and stored on disks. To reverse a hyperspectral image, the spectrum at each pixel is then compared with the look-up table spectra in order to find the best match (the nearest neighbor), according to a merit function minimization. Parameters are then deduced from the look-up table best match spectrum. In comparison with traditional optimization methods, the speed gain is significant, since retrieving a value from mem-ory is often faster than undergoing an expensive computation. The main disadvantages of this approach are the multiplicity of solutions and their instability [2].
• Training approaches assume that there exists a functional relationship
Y = F (X) (2)
between spectra and parameters. This relationship corresponds to the inverse of the physical model G in the forward problem (1). The idea is to use a look-up table to estimate the underlying mathematical relationship F. This relationship then allows us to estimate the parameters of new spectra. Computation time can then be very competitive. Neural networks [9] or support vector machines (SVM) [7] can be used to learn the function F as well as PLS regression for linear problems [8]. The advantage of a such a training approach is that, once the relationship has been established,
it can be used for very large sets and for all new images with the same physical model.
In this paper, we develop a training approach, based on a dimension reduc-tion technique: the sliced inverse regression. To the best of our knowledge, this method has never been used in the context of model inversion on images in plan-etology. It has the advantage of being fast, stable and statistically interpretable. It can also help to select an appropriate look-up table for inversion.
2
Our methodology
Our aim is to estimate the d-variate function F in the inverse problem (2). For the sake of simplicity, only one parameter Y ∈ R is considered in the sequel. Because of the curse of dimensionality, estimating such a relation is not realistic. Dimension reduction techniques have to be applied to choose a lower dimensional regressor space, sufficient enough to describe the relationship of interest. In practice, it appears [2] that a unidimensional regressor space gives satisfactory results. Thus, we assume that there exists a function f from R to R such that: F(X) = f (< β, X >). (3) As a consequence, the estimation of the relationship reduces to computing one projection axis spanned by β and an univariate function f .
Principal component analysis (PCA) is the most current technique that could be used to choose β [5]. However, in the case of a regression problem, PCA is generally not satisfying since only the explanatory variables X are considered and the dependent variable Y is not taken into account. Specific dimension reduction techniques have been developed for regression problems, and among them Sliced Inverse Regression [11] is the most popular. It consists of applying PCA to the inverse regression curve E(X|Y ) instead of applying it to the original predictor X. The projection axis β is then deduced by calculating the eigenvec-tor corresponding to the largest eigenvalue of Σ−1Γ where Γ = Cov(E(X|Y )) is
the covariance matrix of the inverse regression curve and Σ = Cov(X) is the pre-dictors covariance matrix. Since inverse problems are generally ill-posed [13, 1], Σ is ill-conditioned making its inversion difficult. We thus propose to compute a Gaussian Regularized version of Sliced Inverse Regression (GRSIR). Theoretical details can be found in [4, 3]. The concept of this method is to incorporate some Gaussian prior on the projections in order to dampen the effect of noise in the input data, and to make the solution more regular or smooth. The ill-posed problem is then replaced by a slightly perturbed well-posed problem depend-ing on a regularization parameter δ. Similarly, GRSIR consists of computdepend-ing the eigenvector also corresponding to the largest eigenvalue of (Σ2+ δId)−1ΣΓ
where Id is the d × d identity matrix. In practice, Σ and Γ are replaced by their empirical counterpart. Once a relationship has been revealed between reduced spectra < β, X > and the parameter Y , then f is estimated using piecewise linear interpolation.
3
Application
3.1 DataIn this paper, we concentrate on an observation of the south pole of Mars at the end of summer. It has been collected during orbit 103 by the French imag-ing spectrometer OMEGA on board Mars Express Mission. A detailed analysis of this image [6] revealed that this portion of Mars mainly contains water ice, carbon dioxide and dust. This has led to the physical modeling of individual spectra with a surface reflectance model. This model allows the generation of 30,000 synthetic spectra with the corresponding parameters that constitute a look-up table. At first, we focus on the terrain unit of strong CO2 concentra-tion: the bright permanent south solar cap. This unit has been determined by a classification method based on wavelets [12]. It contains approximately 5,000 spectra to reverse. The 5 most important parameters characterizing the mor-phology of these spectra are the proportions of CO2, water and dust; and the
grain sizes of water and CO2.
3.2 Validation on simulated data
As a first step, we propose to validate GRSIR methodology using test data. Spectra are simulated by radiative transfer modeling for random values of the 5 parameters of interest. In order to work in realistic conditions, multiGaussian noise of dimension d has been added to all the spectra of the test data. Zero-mean noise is simulated with a covariance matrix determined experimentally from real observation. We denote by:
• n the number of spectra from the test data (n = 3500), • xi∈ Rd, i∈ 1, . . . , n the spectra from the test data,
• yi∈ R, i ∈ 1, . . . , n one of the 5 associated parameters.
To quantify the relevance of GRSIR methodology, we examine two aspects of the validation: the quality of the estimations but also the quality of the relationship between reduced spectra and parameters. To this end, we used two validation criteria. The first one, called Normalized Root Mean Square Errors (NRMSE), quantifies the importance of estimation errors, given by the differences between the real values yi and the estimations ˆyi:
N RM SE= v u u u u u t n P i=1 ( ˆyi− yi)2 n P i=1 (yi− y)2 with y = 1 n n X i=1 yi. (4)
This measure is invariant with respect to position and scale and therefore it is possible to deduce if one parameter is better estimated than another. The NRMSE is close to zero when the predicted values are accurate and conversely
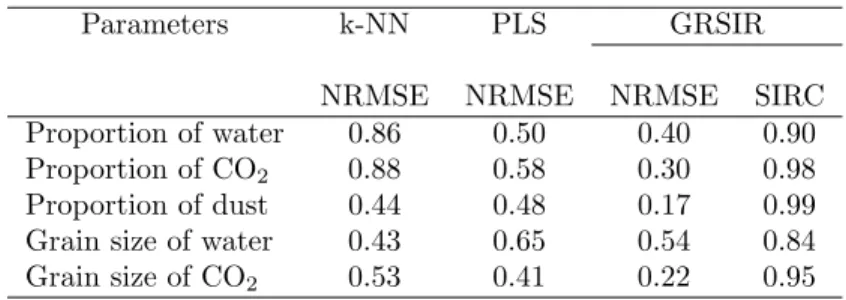
becomes larger when predictions are poor. The second one, called SIR criterion (SIRC) [11] quantifies the quality of the relationship between projected spectra and parameters. The closer SIRC is to 1, the better the relationship is. Results are presented in Table 1, and are compared with a basic k-NN approach currently used by physicists and with a PLS regression [8]. The number of axes for the PLS regression has been fixed to 5 which globally gives the best results for the whole set of parameters. Results show that, for most parameters, estimations are more accurate with GRSIR. Only one parameter, the grain size of water, is better estimated on average by k-NN. This may be due to the fact that too few values have been considered for simulations in the look-up table (only 5). In all other cases, we can see an important gain on the NRMSE which can be 3 times smaller with GRSIR than with k-NN or with PLS regression. A more detailed analysis shows that the original densities simulated in the test data are better reproduced with GRSIR giving a good idea of the parameter’s range of variation. Finally, the SIRC, always close to 1, is very satisfying.
Parameters k-NN PLS GRSIR
NRMSE NRMSE NRMSE SIRC Proportion of water 0.86 0.50 0.40 0.90 Proportion of CO2 0.88 0.58 0.30 0.98
Proportion of dust 0.44 0.48 0.17 0.99 Grain size of water 0.43 0.65 0.54 0.84 Grain size of CO2 0.53 0.41 0.22 0.95 Table 1: Comparisons between GRSIR and k-NN with validation criteria
3.3 Inversion of real data
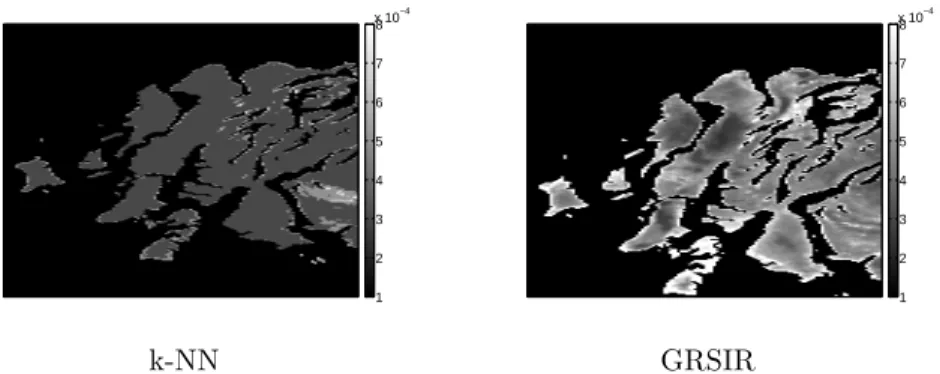
The inversion of the image observed from orbit 103 by GRSIR and k-NN shows that GRSIR gives very smooth mappings for all sets of parameters. Moreover, GRSIR estimations vary continuously while k-NN estimations assume a small number of values. An example is given in Figure 1, where we see that, the proportion of dust is nearly always estimated to a constant equal to 0.0003 with k-NN. With GRSIR, the map is more detailed. We did not present the map estimated by PLS regression because of the lack of space, but let us precise that it is similar results to GRSIR’s. Because no ground data is available, it is difficult to determine the accuracy of inversion estimates.
4
Conclusion
In this paper, we proposed a regularized version of Sliced Inverse Regression in order to retrieve the physical parameters from the spectra observed on Mars by an OMEGA spectrometer. To the best of our knowledge, this methodology has never been used in the domain of remote sensing and more particularly in
1 2 3 4 5 6 7 8 x 10⁻⁴ 1 2 3 4 5 6 7 8 x 10⁻⁴ k-NN GRSIR
Fig. 1: Proportion of dust estimated by k-NN and GRSIR from the hyperspectral image observed from orbit 103.
planetology. Results on simulations are promising. Estimations are accurate, and most of the time better than the ones given by the k-nearest neighbors algorithm or the PLS regression. On real data, maps are smoother with GRSIR, than with k-NN, and seem to give a coherent mapping if we compare the inversion of different hyperspectral images of the same portion of Mars surface.
References
[1] R.C. Aster, B. Borchers, and C.H. Thurber. Parameter Estimation and Inverse Problems. Elsevier Academic Press, 2005.
[2] C. Bernard-Michel, S. Dout´e, M. Fauvel, L. Gardes, and S. Girard. Retrieval of Mars
surface physical properties from Omega hyperspectral images using regularized sliced inverse regression. Journal of Geophysical Research - Planets, 114, 2009. E06005. [3] C. Bernard-Michel, L. Gardes, and S. Girard. A note on sliced inverse regression with
regularizations. Biometrics, 64:982–986, 2008.
[4] C. Bernard-Michel, L. Gardes, and S. Girard. Gaussian regularized sliced inverse regres-sion. Statistics and Computing, 19:85–98, 2009.
[5] C.M. Bishop. Pattern Recognition and Machine Learning. Springer, 2006.
[6] S. Dout´e, B. Schmitt, J-P. Bibring, Y. Langevin, F. Altieri, G. Bellucci, B. Gondet, and
the Mars Express Omega Team. Nature and composition of the icy terrains from mars express omega observations. Planetory and Space Science, 55:113–133, 2007.
[7] S.S. Durbha, R.L. King, and N.H. Younan. Support vector machines regression for re-trieval of leaf area index from multiangle imaging spectroradiometer. Remote Sensing of Environment, 107:348–361, 2007.
[8] I. Ildiko and J. Friedman. A statistical view of some chemometrics regression tools. Technometrics, 35(2):109–148, 1993.
[9] B. Kamgar-Parsi and J.A. Gualtieri. Solving inversion problems with neural networks. International Joint Conference on Neural Networks, 3:955–960, 1990.
[10] D.S. Kimes, Y. Knyazikhin, J.L. Privette, A.A. Abuegasim, and F. Gao. Inversion meth-ods for physically-based models. Remote Sensing Reviews, 18:381–439, 2000.
[11] K.C. Li. Sliced inverse regression for dimension reduction. Journal of the American Statistical Association, 86:316–327, 1991.
[12] F. Schmidt, S. Dout´e, and B. Schmitt. WAVANGLET: An efficient supervised classifier for hyperspectral images. Geoscience and Remote Sensing, IEEE Transactions, 45(5):1374– 1385, 2007.