Publisher’s version / Version de l'éditeur:
Vous avez des questions? Nous pouvons vous aider. Pour communiquer directement avec un auteur, consultez la première page de la revue dans laquelle son article a été publié afin de trouver ses coordonnées. Si vous n’arrivez pas à les repérer, communiquez avec nous à PublicationsArchive-ArchivesPublications@nrc-cnrc.gc.ca.
Questions? Contact the NRC Publications Archive team at
PublicationsArchive-ArchivesPublications@nrc-cnrc.gc.ca. If you wish to email the authors directly, please see the first page of the publication for their contact information.
https://publications-cnrc.canada.ca/fra/droits
L’accès à ce site Web et l’utilisation de son contenu sont assujettis aux conditions présentées dans le site LISEZ CES CONDITIONS ATTENTIVEMENT AVANT D’UTILISER CE SITE WEB.
Building Research Note, 1984-09
READ THESE TERMS AND CONDITIONS CAREFULLY BEFORE USING THIS WEBSITE. https://nrc-publications.canada.ca/eng/copyright
NRC Publications Archive Record / Notice des Archives des publications du CNRC : https://nrc-publications.canada.ca/eng/view/object/?id=5c6bc492-093a-47e4-af07-a53a2e625c6f https://publications-cnrc.canada.ca/fra/voir/objet/?id=5c6bc492-093a-47e4-af07-a53a2e625c6f
NRC Publications Archive
Archives des publications du CNRC
This publication could be one of several versions: author’s original, accepted manuscript or the publisher’s version. / La version de cette publication peut être l’une des suivantes : la version prépublication de l’auteur, la version acceptée du manuscrit ou la version de l’éditeur.
For the publisher’s version, please access the DOI link below./ Pour consulter la version de l’éditeur, utilisez le lien DOI ci-dessous.
https://doi.org/10.4224/40000497
Access and use of this website and the material on it are subject to the Terms and Conditions set forth at
Air quality measurements in low-leakage houses
ISSN
0701-5232S e r
TH1
- , ,I ,
...
*- , .AIR QUALITY pfEASlJREMENTS
IN LOW-LEAKAGE HOUSES
by
R
.
S
.
X)umon tA N A
LYZED
Division of B u i l d i n g Research, National Research Council of Canada
AIR
QUALITY
MEASUREMENTS IN LOW-LEAKAGEHOUSES
by
R.S.
DumontAbstract
R e s u l t s of air qua11 t y measurements are presented for a group of
low-leakage hauses located in Saskatoon, Saskatchewan. A total of 4 6 houses were tested for formaldehyde, n i t r o g e n d l o x i d e , xadon, and humidity l e v e l s .
The median l e v e l of formaldehyde was 0.09 ppm, slightly lower than t h e
guidel-lne of 0.1 ppm. Elevated levels of formaldehyde
C
Xl.1 ppm) were foundin 18 of 46 houses. The median
l e v e l
of radon was 3.0 p i c o c u r i e s t ' l i t r e ,s l i g h t l y lower than t h e g u i d e l i n e
of
4 p C i / ~ . Elevated l e v e l s o f radon ( 2 4 p ~ i / ~ ) were found in 1 2 o u t of 4 4 houses. The median level of nitrogendioxide was 4 . 6 ppb, c o n s i d e r a b l y lower than the g u i d e l i n e of 50 ppb, No houses were found with elevated nitrogen dioxide l e v e l s (250 ppb).
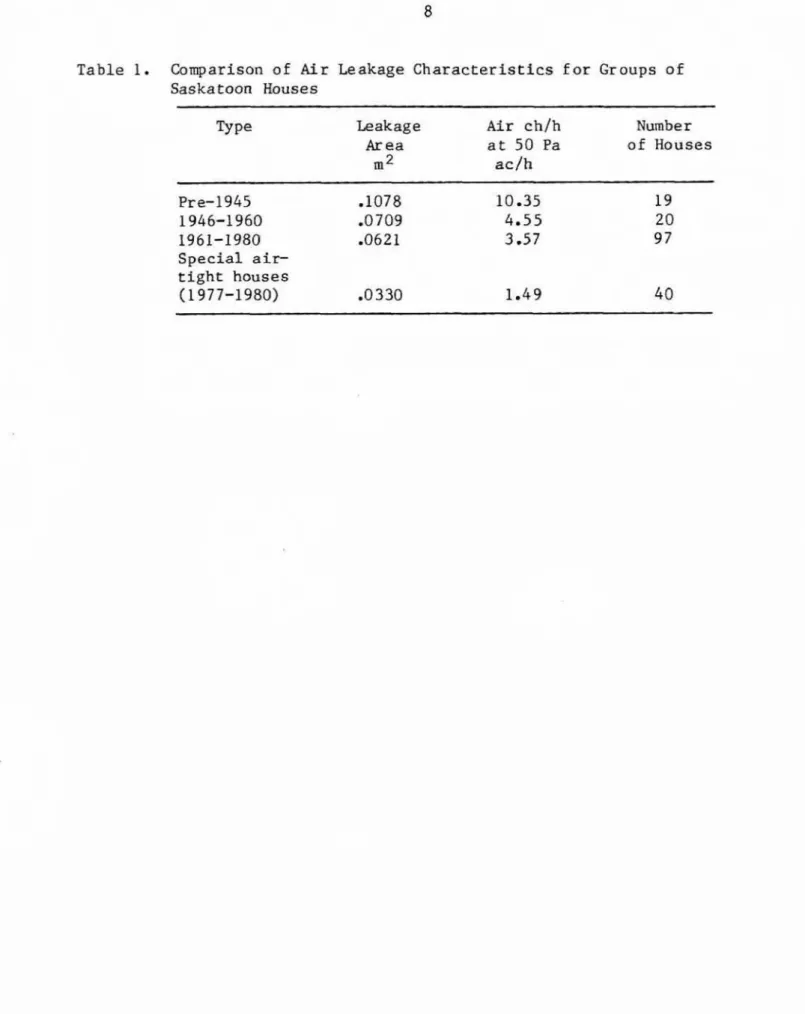
In recent years, a large number of houses have been constructed i n the
Canadian prairie r e g i a n that have been sealed to a considerably h i g h e r
degree t h a n conventional housing. A
1981
report by Dumont andOrr
l includespressure t e s t values f o r a group of 40 houses that were specially sealed.
On average, these houses had equivalent leakage area valves that were 53% o f
those in conventional houses. (See T a b l e 1).
As part of an ongoing research p r o j e c t , testing was done on t h e levels of s e l e c t e d p o l l u t a n t s in a group of t h e s e low-leakage houses.
A number of g u i d e l i n e s exist for a i r p o l l u t a n t levels. A frequently
q u o t e d standard is t h e document " V e n t i l a t i o n f a r Acceptable M r Quality"
produced by the American S o c i e t y of
Heating,
Refrigerating, and hirConditioning Engineers (ASHRAE)
.
Values f o r f ormaldehye,
radon daughters, and nitrogendioxide
are presented in Table 2.ZR I982 a preliminary air q u a l i t y survey of 5 1 houses i n t h e Saskatoon area was undertaken to determine l e v e l s of formaldehyde and radon daughters.
The
survey included houses of varying ages and airtightness levels.As shown in Figure I , a number of the houses exhibited higher l e v e l s of
f armaldehyde gas. Using the ASHRAE criterion o f
0.1
ppm, 8 of the5
1Saskataon houses had elevated formaldehyde gas
levels,
Of p a r t i c u l a rinterest f n this i n i t i a l survey was t h e r e l a t i o n s h i p b e t w e n formaldehyde
levels and the a i r t i g h t n e s s of t h e structure. F i g u r e 2 p r e s e n t s the
r e l a t i o n s h i p between formaldehyde l e v e l s and t h e pressure t e s t reading for each house.
It
shows that houses with higher formaldehyde readings were generally among t h e more airtight of the sample. (It should b e n o t e d t h a tt h e airtightness of the structure is n o t a d i r e c t measure of t h e air change
systems. These systems can
substantially
i n c r e a s e t h e amount of ventilation compared t o n a t u r a l veatilatBon from s t a c k and wfnd e f f e c t s . )In t h e 1982 survey, radon d a u g h t e r l e v e l s were a l s o measured using t h e
Terradex Track-Edge Detector. The results are p r e s e n t e d in Figure 3. Using
the
ASHRAE
l e v e l of 0.01 working levels as a cut o f f , 17 of 4 3 houses* hadelevated radon daughter l e v e l s . A p l o t of the radon daughter l e v e l s as a
f u n c t i o n of t h e pressure t e s t readings f o r the houses is presented in
F i g u r e 4 .
1983 Study of S a s h - Houses
As a follow-up to the 1982 study, a survey of formaldehyde, nitrogen d i o x i d e and radon gas l e v e l s was conducted in 1983 in a sample of 46 hauses
in
Saskatoon. The houses chosen had all been built s i n c e 1978, and werechosen because they had a pressure test reading of less than 2.5 a i r changes p e r hour at 50 pascals. The average pressure test reading f o r the 4 6 houses was f - 3 3 a i r changes p e r hour at 50 pascals.
This i s considerably
t i g h t e rthan the value of 3.6 air changes per hour at 50 pascals which w a s reported l
as an average f o r conventional h o u s e s b u i l t during the p e r i o d 1960-1980 in
Saskatoon.
For steady s t a t e c o n d i t i o n s , t h e concentration o f a pollutant w i t h i n a
well-mixed space may be expressed as:
where
C,
= c o n c e n t r a t i o n of pollutant w i t h i n t h e space (mass/volwme)C,
= c o n c e n t r a t i o n of p o l l u t a n t at t h e s o u r c e of t h e v e n t i l a t i o n air, i.e.,
o u t s i d e air (mass/volme)N
= n e t p o l l u t a n t generation rate within the space (mass!time)V
= volume rate of a i r exchange (volume/time)A high concentration of p o l l u t a n t w i t h i n t h e s p a c e may be experrenced
under any or a l l
of
three conditions:8 high outdoor concentration
(c,)
C high pollution generation rate
(N)
alow
ventilation rate(v)
*
Due t o equipment f a i l u r e e t c .,
n o tall
of the t e s t swere
successfullycompleted.
For
instance,in
this case, although 5 1 t e s t s were conducted,only 4 3 were successful. Throughout t h i s paper, reference is made only t o
T e s t Procedure for Air Quality Heasxtrememts in the 1983 Study
1.
Formaldehvde
Formaldehyde t e s t s were made in t h e houses using Ihpont Pro-tek passive
badges- A t o t a l af
2
badges, each of whf ch was exposed f o r o n e w e e kp e r i o d s , were placed in the l i v i n g areas {generally the dining or l i v i n g
roams) of each house. The badges were analyzed in a laboratory in Toronto. The measurements were taken from January
3
t o January 21, 1983. W r i n g thist i m e , t h e average outdoor temperature was -1 1°6, and t h e average w i n d speed was 13 km/h. The results of the t e s t s f o r the houses are p r e s e n t e d in
Table 3.
2. Radon Gas Tests
Radon gas l e v e l tests in the houses were made using Tesradex Rack Etch
passive detectors. The p a r t i c u l a r detector chosen has a f i l t e r w h i c h
m i n i m i z e s the contact of dust particles with the detector; hence o n l y the
r a d o n gas and n o t the radon d a u g h t e r concentration is measured.
Measurements w e r e made from January t o A p s l l 1983. Results are presented in
T a b l e 3.
Appendix A presents a discussion on the consistency of t h e formaldehyde and radon sensor readings.
3. Nitrogen Dioxide Tests
Nitrogen dioxide t e s t s , one p e r house, were made during a
week
in earlyJanuary using a passive detector. The test badges were processed by H e a l t h and Welfare Canada. Results are presented in Table
3.
In a d d i t i o n t o these three t e s t s , data were gathered
for
each house, as follows:a Pressure t e s t result at a pressure d i f f e r e n c e of 50 Pa.
Type of heating system
a Type of ventilation system used
a. None
b . Fresh air d u c t i n t o plenum c. Air-to-air heat exchanger
o Type of air-to-air heat exchanger
Number of occupants during day and n i g h t p e r i o d s
a I n s i d e temperature and relatjve humidity d u r i n g formaldehyde t e s t s
o Area of p a r t i c l e board
+
Number of wood heating appliances (wood stoves ox fireplaces w Number of cigarette or c i g a r smokers.These data are contained
in
Table 3.Test Results
1 . The formaldehyde levels for each house are presented in Figure 5, The values shown are the average sf t h e t w o readings t a k e n . The median
greater t h a n 0.1 ppm. A p l o t of formaldehyde levels as a function of
i n d o o r r e l a t i v e humid1 t y is shown in F i g u r e 6 . A p l o t of t h e
formaldehyde levels
as a function of t h e amount of p a r t i c l e boardfn
each house is shown in F i g u r e 7.
2. The results of the radon gas tests are sham in Figure 8 , Of the 4 3 houses successfully tested, 12 houses had radon gas levels t h a t exceeded 4 pfcocuriesjlitre, which is the
U.S
EPA remedial c r i t e r i o n . Themedian value for t h e s e 4 3 houses was 3.0 p i c o c u r i e s / l i t r e .
3.
The
results of the n i t r o g e n dioxide t e s t s are shown in Figure 9. Themedian level, f o r the 46 houses w a s 4.6 ppb, The houses were divrhded into four categories, depending on t h e presence or absence of wood applLances and smokers- The results were as follaws:
Category No 2 Number
P P ~ of Houses
No
wood a p p l i a n c e s , n o smokers3.5
12 No wood appliances, smokers 5 -3 4Wood appliances, no smokers 5.1 2 1
Wood appliances, smokers 5.6 9
Formaldehyde
The median formaldehyde
Level
was 0.09 pgsn, with values rangingbetween 0.033 and 0.24 ppm. The houses w i t h higher formaldehyde r e a d i n g s tended to have higher relative humidifies. Of the 8 homes with relative
h u m i d i t y
(BH)
values less t h a n 302, none had f armaldehyde readings greatert h a n 0.1 ppm. Of the 6 houses w i t h RH values greater than 40%, 2 had
formaldehyde readings greater than 0.1 ppm. A p l o t of t h e relationship
between formaldehyde and interior relative humidity is shown i n Figure 6. Assuming constant moisture generation rates in t h e various houses (on an equivalent volume b a s i s ) ,
low
relative humidity values are a r e s u l t ofhigher air change rates. Thus t h e r e l a t i o n s h i p between formaldehyde and relative h m i d i t y is not unexpected. There is a secondary e f f e c t , s i n c e
the formaldehyde offgassing rate is known to
increase
w i t h higherhumidities
.
Higher formaldehyde readings were a l s o associated w i t h the houses t h a t
d i d not have a mechanical v e n t i l a t i o n system. F i f t y percent of the houses with no mechanical ventilation system showed formaldehyde levels greater
than 0.1 ppm, Only 27% of those t h a t had mechanical v e n t i l a t i o n showed
levels greater than 0.1 ppm.
As
part of t h e survey, measurements were made of t h e area of p a r t i c l e board contained w i t h i n each house. The areas of p a r t i c l e board are shown inTable 3. The range of particle board areas varied from 0 to 31 1 m2. Tn a d d i t i o n , there were other formaldehydeemitting sources within t h e houses
(some carpets, permanent press f a b r i c s , hardwood plywoods) t h a t were not q u a n t i f i e d . A s shown i n Figure 7, there was weak p o s i t i v e correlation
(correlation coefficient =
0.36)
between the formaldehyde l e v e l and t h eamount o f particle b o a r d Fn the houses. O t h e r f a c t o r s , such a s t h e
ventilation rate, the age
and
brand of the p a r t i c l e board, the type of covering on the p a r t i c l e board, t o b a c c o smoke and o t h e r sources offormaldehyde
are p o s s i b l ereasons
the c o r r e l a t i a n between the formaldehydelevel
and the amount of particle board isnot:
stronger.A house
can
have alow
formaldehyde reading by having either a low volume of f o r m a l d e h y d e e m i t t i n g sources or a high allr change rate. Due to u n a v a i l a b i l i t y of equipment, air change measurements were n o t made dusf ngthe period the formaldehyde readings were taken.
It
is possible to estimatethe a i r change rate of those houses that d i d not have f o r c e d v e n t f l a t i o n
systems by using the pressure t e s t data. shaw3 p r e s e n t e d a correlation
between the a i r change rate and t h e pressure test data, w i n d speed and o u t s L d e air temperature. The correlation equation when the w i n d speed i s
greater than 3.5 m/s and the temperature difference is greater than 25 K, i s
a s follows:
where
I
= air change rate (h-I)C
= constant from pressure test (L/(s-pa") )V
= volume of house (m3)Values f a r
C, V,
andI for
t h e houses in t h e survey lacking forcedventilation systems are presented i n T a b l e 3 . As may be seen f r o m t h e
table, the calculated average i n f i l t r a t i o n rate f o r t h e s e houses was
0.23 a c l h , and t h e corresponding average f armaldehyde l e v e l was 0.1 06 ppm.
This relatively
low
air change rate, coupled with the h i g h p a r t i c l eboard loadlng for a number of the houses, is believed to be r e s p o n s i b l e f o r the elevated formaldehyde gas readings in this group of houses.
2. Radon
The median radon level f o r the h o u s e s w a s 3.0 p i c s c u r i e s l l i t r e , w i t h
the v a l u e s ranging between 0.82 and 9.44
pCi/L.
The r e a d i n g s w e r e a l l takenin
the lowest levels of t h e houses, which were generally not o c c u p i e d .2, Nitrogen Dioxide
The medEan value f o r the NO2 readings was 4.6 parts p e r b i l l i o n , w i t h
values ranging between 0.7 and 13.3 ppb, well, below t h e ASHEEAE g u i d e l i n e of
50
ppb. Three of the f o u r houses ~ 5 t h readings above 10 ppb had e i t h e r woads t o v e s or f i r e p l a c e s . The f o u r t h house, with a r e a d i n g above 10 ppb, had 2 smokers with cigarette consumption levels of 1 pack (20 cigarettes) each p e r d a y . The houses w i t h
no
wood appliances and n o smokers averaged 3.5 ppb, and those w i t h both wood a p p l i a n c e s and smokers averaged5.6
ppb.The results of t h i s study i n d i c a t e a number of areas for further work: Future studies of t h i s type should include direct measurements of the air change rates in the houses using tracer gas ar o t h e r a p p r o p r i a t e
means.
Remedial
work
on these houses e x h i b i t i n g higherlevels
of p o l l u t a n t ss h o u l d be undertaken.
lnvestfgatfons should be undertaken ro determine t h e source sf t h e
radon g a s . An area t h a t is l i k e l y to be a s t r o n g source is the f l o o r
drain, through which radon can leak into t h e house via the weeping
tile system.
Offgassing rates for typical p a r t i c l e boards used in Canadian houses should
be
d e t e r m i n e d . A particular need exists for d a t a on the offgassing rate when t h e board has a floor covering. Also ofi n t e r e s t is the rate of offgassing a s a function of the age of the board, the board temperature, and t h e relative humidity.
Further studies should be undertaken on residences such as mobile
homes, that c o n t a i n large q u a n t i t i e s of p a r t i c l e board.
R e f
ereaces
1. Dumant, R.S. and
Orr,
H.W. "Airtightness Measurements of Detached Musesin the Saskatoon Area," National Research Council of Canada, D i v i s i o n of Building Eksearch, B u i l d i n g Research Note 178, Ottawa, Ontario,
1981.
2. ASHRAE, "Ventilation for Acceptable Indoor Air W a l i t y " Standard 62-1981, 1791 T u l l i e C i r c l e N . E . , A t l a n t a , Georgia, 30329, 1981.
3. Shaw, C.Y., "A Correlation between Air I n f i l t r a t i o n and Air Tkghtness
for Houses in a Developed R e s i d e n t i a l Area," ASHRAE Transactions, V o l .
87,
Pt.2, 1981.LIST O F TABLES
1. Comparison of
air
leakage characteristicsfor
groups of Saskatoon houses.2. Guidelines for selected air contaminants. 3.
Air
q u a l i t y data, 1983 Survey, Saskatoon4 , Calculated a i r change rates f o r houses lacking forced v e n r i l a t i o n .
LIST OF
FIGURES Flgure1
Figure 2 Figure 3 Figure 4 F i g u r e 5 Figure 6 F i g u r e 7 Figure 8 Figure9
Formaldehyde
r e a d i n g s , 1982 s t u d y .Formaldehyde readings a s a function of air t i g h t n e s s , 1982
study.
Radon readings, 1 9 8 2 s t u d y .
Radon readings as a function of air tightness, 1982 study. Formaldehyde r e a d i n g s , 1983 s t u d y .
Formaldehyde readings a s a function of indoor relative humidity, I983 s t u d y .
Formaldehyde readings as a function of the amount of p a r t i c l e board, 1983 study.
Radon readings, 1 9 8 3 study.
Table 1. Comparison of Air Leakage Characteristics f o r Groups of
Saskatoon Houses
TYPE k a k a g e
Air
chlh NumberArea at 50 Pa of Houses
m 2
ac J h Pre-1945.I078
10.35 19 1946-1960.O
7094.55
20 1961-1980 .062 k 3-57
97 S p e c i a l air- tight houses (1977-1980) -0330 1.4940
Table 2. Guidelines far g e n e r a l l y acceptable l e v e l s of s e l e c t e d a i r contaminants
.
Con raminan t Level Reference
- - - - . . - - . - . - - - --
Formaldehyde 0.12 mg/m3 ASHME 62-1981
0.1 ppm at 25OC,
101.3
kPaRadon 4 pCi/L U.
S.
EPARadon daughters 0.01 working levels
ASHRAE
62-1981Nitrogen Dioxide 100 pg/m3 W.S. EPA
50 ppb at 25'C, 101.3 kPa
T a b l e 3.
Air
QualityDa
La,1983
S u r v e y , SaskatoonTightness
Fo
rmald. Fo rmald.House
Year
ac /h Press. P P WPQnt p p DupontT a b l e 3 (cont'd)
House T o t a l P a r t i c l e
House Volume Board Area
/!
of # of RadonCode ( m 3 )
(m2)
PP
Wood Appl Smokers @CI/L)A2 A4
A5
B 1 2 I311 B13 B10 B15 B 1 4 B3 AA!JB6
C8
D2 D3 FF5 D4 E4 FF6 3'8 P9 F1 G JG4
H6H7
H8 3 3 L l OLL
1 6 3 M8M9
P2
P5
P 4 R3R8
S9 S 1 FF1S8
T3T4
W7
Y1
T a b l e 3 Ccont'd)
He at ing Number V e n t i l
UA
HeatMA
Es
t ProblemsHouse System of Sys t e r n Exchanger On Erne Moisture/
Code Type Chimneys TY
TY
pe Hrs. &lour?A2
A4AS
B12
BP
1 £313B10
B 15 B 1 4B3
AA9 B6 C8D2
D 3 FF5 D4E4
F
F6F8
F 9
F1
G7G4
H6 H7 H a 53L90
L11 G 3 M 8 M9P2
P5 P 4R3
R8 S 9 S 1 FFIS
8T3
T4
W7
Yl
GAS 2 GAS 1GAS
3 GAS 2 GAS 2GAS
2 GAS 2 GAS 1 GAS 1 GAS 2 EL. BASE. 0EL.
BASE.
1 GAS 1 GAS 2 GAS 1 GAS 2 GAS 2 GAS 2 GAS 2 GAS 2 GAS 2 GAS 3 HOT WATER 1EL.
BASE. 2 GAS 1 GAS 3 GAS 2 GAS 2 GAS 2 GAS 2 GAS 2GAS
1 GAS 2 BOILER 1EL* FURNACE
0 GAS 2 GAS 3 GAS 2 GAS 2 EL. BASE. 1 GAS 2 GAS 2GAS
2 GAS 2 GAS 1 GAS 2 A TO A A TO A A TO A FR. A I R DUCTFR.
A I RDUCT
NQNE A TO A A TO A NONE A TO A A TO A RTO
A A t o k ATO
A ATO
A FRmAIR DUCT
A TO A PR. A I R DUCT NONE FR. AIR DUCT FR.AIR
DUCT NONE A TO A ATO A
A TO A A TO A A TO A ATO
A A TOA
FR.AIR
DUCT PR. A I R DUCT A TO A FR. AIR OUCTFR.
AIR DUCT A TO A NONE A TO A A TP A A TO A ATO
A ATO
AFR. AIR DUCT
A TF A A TO A ATO
A A "110 A P & PMITSUB
VAN
E E 200---
---em-----
MITSUBP & P
---
P & P
PASSSOLAR
P & P
VANEE
200 P & PP & P
---
MITSUB +-------
---
----dm---
P C PP & P
VAN
EE 200VAN
EE 200 P h P OTHER VANEE
200 dm---MITSUB
---
--dm-VAN EE
200---
PASS. SOLARVAN
EE 200VAN
EE 200 P & P P & P OTHERVAN
EE 200 DC2PASS.
SOLAR YESJNON O
NO NOYES /NO
NO
NOIYES
YES/NO NOVESSNO
YES/NOT a b l e 3 (cont'd)
Daytime Nightime In.Temp In.Ternp RelHurn & I l i u m
House Adul t s / Adults
/
Deg (C) h g{a
Pe
s cen t: P e r c e n tCode Children Children Week
I
Week 2 Week 1 Week 2- - A2 A4
A5
B 1 2 B 1 1 B13 B 1 0a1
5 B14 B3 kA9 B 6 C8 D2 D3FF5
D4
E4
F F6F8
F9 F 1 6 7 6 4 H 6 Hi' H 8 5 3L
10 L11 G 3 M8 I49P2
P5
P
4 R 3 R 8s9
S1
FF1 S8T3
T4
w7
Y
1Table 4 . C a l c u l a t e d a i r change rates far houses l a c k i n g forced
ventilation
. - . -
Formaldehyde
House
C
n VI
PPmCode m3/ ( s-pa") (m3) A C J ~ 2 wk Average
Consistency of the Radm and Formaldehyde Seasore
During t h e
a i r
quality measurements, a number of cross-checks were madewith
the radon and formaldehyde sensors. These checkswere
p r i m a r i l y takenro
ensure that the companies supplying t h e sensors and d o i n g the analysesw e r e providing consistent readings,
Radon
-
During the course of t h e experiment, groups of 5 s e n s o r s w e r e p l a c e d
side-by-side in t w o l o c a t i o n s , The f i r s t l o c a t i o n f o r the aide-by-side check was in a crawl s p a c e area t h a t was known t o have e l e v a t e d radon
l e v e l s , The results f o r the f i v e sensors, all of which were placed s i d e by
side,
were
as follows, when read at the 1.0 pCiJL-month s e n s i t i v i t y l e v e l .Sensor
No.
Radon r e a d i n g IpCii'L)5.40
-
Average = 5.59
A second check, again using 5 sensors placed s i d e - b y s i d e , was
performed in a well-venrflated l a b o r a t o r y . The results f o r t h i s comparison
are
shown below:Sensor No. Radon reading (pCi /L)
Dl
00-
0.17Average = 0.18 S t d . Dev, = 0.06
Formaldehyde
A side-by-side check was performed on the DuPont sensors. A t o t a l of 4 sensors
were
placed s i d e b y - s i d e in one house f o r a one week period. TheSensor no. Formaldehyde l e v e l (ppm)
0 -088
-
Average = 0.0780
0 4.0 8.0 12.0 16.0
A I R TIGHTNESS nsO
,
A I R CHANGES / H R . AT 5 0 Pa< 0 H E b t l H G TYPE -
A
B O ELECT RlClTY A D O NATURAL G A S - AGE OF HOUSE A PRE 1945D
1946 -1960 0 1961-1900-
0n
0. Qn o
n I 1 I I I I I Figure 20
HEATING
TYPE
A
E3
O
ELECTRICITY
A
0
NATURAL G A S
8
IAGE
OF HOUSE
Li
PRE
1945
1946
-1960
0
1961
-
1980
0
8.
0
A
-"
('0
8
n
0
A
A
0 0
1
0
,
I
I
I
I
A I R
TIGHTNESS
n 5 0
.
A I R CHANGES/ HR. A T
5 0
Pa
Figure 40
.a5
.
I 0
.I5
.20
FORMALDEHYDE
R E A D I N G S , p p m
F i g u r e
5
RELAf I V E HUMIDITY, %
Figure 6
PART
l C t E BOARD
A R E A
/
HOUSE
VOLUME
,
m
- I
F i g u r e 7
M E A N
= 3.56
S.D.
= 2.14
MEDIAN
=
3.01
0
0
2.5
5 . 0
7.5
R A D O N ,
p i c o c u r i e s
litre
F i g u r e 80
5
10
NO2
L E V E L S ,
p p b
Figure 9