How to harness the potential of Short Food
Supply Chains in Vaud?
Bachelor Project submitted for the degree of
Bachelor of Science HES in International Business Management
by
Jonas DI VITA
Bachelor Project Mentor:
Nicolás DEPETRIS CHAUVIN, Ph.D, Associate Professor
Geneva, June 3 2020
Haute école de gestion de Genève (HEG-GE) International Business Management
Disclaimer
This report is submitted as part of the final examination requirements of the Haute école de gestion de Genève, for the Bachelor of Science HES-SO in International Business Management. The use of any conclusions or recommendations made in or based upon this report, with no prejudice to their value, engages the responsibility neither of the author, nor the author’s mentor, nor the jury members nor the HEG or any of its employees.
Acknowledgements
I would like to thank all the people who took the time to complete the consumer survey and share it around.
I would also like to thank my professor and supervisor, Nicolás Depetris Chauvin, for his guidance, time and advice throughout this research.
Moreover, I want to thank my life partner, Andrea Galvez, for her continuous support and help.
Executive Summary
This study aimed at analyzing the demand side of short food supply chains in the canton of Vaud to provide local farmers with recommendations about how to organize, market and promote the sale of local fruits and vegetables.
While many elements in the analysis confirmed the findings of the existing literature, others brought a new understanding of consumers in Vaud. The consumer analysis led to the construction of a consumer profile being more likely to be frequent users of such food supply systems.
People being most likely to frequently consume through short food supply chains are women of age 45+ years old, potentially vegeterian or vegan. It has also been shown that frequent users live closer from the place of purchase and give less importance to the price, but rather value the locality of the production, the freshness and the quality of products. They also value the social interaction which is inherent to some short food supply chains. Moreover, the information available about the product such as the traceability is greatly appreciated.
Frequent consumers tend to associate local fruits and vegetables with notions such as seasonality and health benefits. They also think of the geographical and social proximity connecting local producers and consumers and the solidarity which reinforces this link. They tend to be concerned by environmental causes and attach importance to the ecology.
Those findings combined with evolving trends in consumer and purchasing behaviors were used to build a comprehensive and detailed marketing strategy articulated around distribution arrangements and promotion strategies.
Online presence was also strongly recommended to compete with online purchase and traditional Swiss retailers increasingly adopting digital technologies. Furthermore, e-commerce platforms were recommended to provide higher flexibility to consumers and SEO techniques briefly discussed to maximize quality traffic to producers’ websites. With the aim of broadening the customer base of local farmers, distribution arrangements have been introduced. Delivery and click & collect solutions were recommended as a way to offer higher convenience to consumers. Finally, a promotion mix was presented combining a variety of tools; advertising, public relations, personal selling and sales promotions.
Contents
How to harness the potential of Short Food Supply Chains in Vaud? ... 1
Disclaimer ... i
Acknowledgements ... ii
Executive Summary ... iii
Contents ... iv
List of Tables ... vi
List of Figures ... vi
1.
Introduction ... 1
1.1
Report structure ... 1
1.2
Research problem ... 1
1.3
Literature review ... 3
1.4
Research objectives ... 5
2.
Methodology ... 5
2.1
Quantitative online survey ... 6
2.1.1
The survey ... 6
2.1.2
Sampling method ... 8
2.1.3
Sample biases ... 8
2.1.4
Data analysis ... 9
2.2
Projective technique - free association task ... 9
2.2.1
Free word association task ... 9
2.2.2
Theory of Social Representation ... 10
2.2.3
Central Core Theory ... 10
2.2.4
Data analysis ... 11
3.
Results ... 13
3.1
Survey ... 13
3.1.1
Demographics ... 14
3.1.2
Purchasing behavior ... 18
3.2
Probit model: who is a frequent user of SFSCs? ... 27
3.3
Free word association task ... 34
Recommendations ... 40
3.4
Summary of findings ... 40
3.5
Strategic recommendations ... 42
3.5.1
Covid-19 as an engine for SFSCs ... 43
3.5.2
Market structures and value chains ... 44
3.5.3
What is currently being done? ... 47
3.5.4
Who to target and how? ... 48
3.5.5
Marketing strategy ... 49
3.5.6
Further thoughts ... 57
Bibliography ... 60
Appendix 1: Online survey ... 64
Appendix 2: Scales and list of variable ... 76
Appendix 3: Chi-square test and t-test for gender and frequent users ... 78
Appendix 4: T-test age by frequent users ... 79
Appendix 5: T-test yearly income by frequent users ... 80
Appendix 6: T-test education by frequent users ... 81
Appendix 7: T-test household size by frequent users ... 82
Appendix 8: T-test fruits and vegetables percentage of expenditure by
frequent users ... 83
Appendix 9: T-test distance by frequent users ... 84
Appendix 10: T-test timing or purchase by frequent users ... 85
Appendix 11: T-test channels for fruits and vegetables purchase by
frequent users ... 87
Appendix 12: T-test SFSC frequency by retailer users ... 90
Appendix 13: T-test reasons to buy through SFSCs by frequent users ... 91
Appendix 14: T-test importance of elements when choosing a SFSC by
frequent users ... 95
Appendix 15: T-test SFSC compared to traditional food chain by frequent
users ... 100
Appendix 16: Average marginal effects of predictors ... 103
Appendix 17: Average marginal effects of “Age” ... 104
Appendix 18: Average marginal effects of “Fruits and vegetables
percentage of expenditure” ... 105
Appendix 19: Average marginal effects of “Frequency of purchase of
fruits and vegetables” ... 106
Appendix 20: Free word association categories ... 107
Appendix 21: Polarity indexes ... 108
List of Tables
Table 1 Reasons to buy through SFSCs ... 22
Table 2 – Importance of elements when choosing a SFSC ... 24
Table 3 probit regression output – Frequent user ... 27
List of Figures
Figure 1 – Typology of Short Food Supply Chains ... 4
Figure 2 – Three-dimensional representation of knowledge ... 10
Figure 3 – Structural frequency-importance matrix of social representation ... 11
Figure 4 – Frequent vs non-frequent users of SFSCs ... 14
Figure 5 – Gender distribution ... 14
Figure 6 – Gender distribution by frequent users ... 15
Figure 7 – Age distribution by frequent users ... 16
Figure 8 – Distribution of yearly income before tax ... 16
Figure 9 – Status ... 17
Figure 10 – Education level ... 17
Figure 11 – Household size ... 18
Figure 12 – Fruits and vegetables as percentage of food expenditures ... 19
Figure 13 – Average distance from home to place of purchase ... 19
Figure 14 – Timing of purchase by frequent users ... 20
Figure 15 – Channels for purchase of fruits and vegetables by frequent users 21
Figure 16 – SFSC frequency vs traditional retailer ... 21
Figure 17 – SFSC vs traditional food chains for NFUs ... 25
Figure 18 – SFSC vs traditional food chains for FUs ... 26
Table 3 Probit regression output – Frequent user ... 27
Figure 19 – Proportion of FUs vs NFUs by age group ... 28
Figure 20 – Proportion of FUs vs NFUs vs importance of price ... 28
Figure 21 – Average marginal effects of predictors ... 30
Figure 22 – Average marginal effects of “Age” ... 31
Figure 23 – Average marginal effects of “Fruits and vegetables percentage of
expenditure” ... 32
Figure 24 – Average marginal effects of “Frequency of purchase of fruits and
vegetables” ... 33
Figure 25 – Classifier based on probit model ... 33
Figure 26 – Frequency-importance matrix ... 35
Figure 27 – Polarity index of categories ... 36
Figure 28 – Frequency-importance matrix for non-frequent users ... 37
Figure 29 – Polarity index for non-frequent users ... 38
Figure 30 – Frequency-importance matrix for frequent users ... 39
Figure 31 – Polarity index for frequent users ... 39
Figure 32 – Local food value chain ... 46
1. Introduction
1.1 Report structure
This report is organized as follows; it starts by presenting the research problem of the study. Then, a literature review covering the theoretical foundations of short food supply chains and presenting the current state of this research field. The literature review also highlights some existing findings about consumers.
Next, a detailed research methodology describing the various steps of the analysis as well as the methods used.
Following the research methodology, the results of the various analyses are presented followed by some strategic recommendations encompassing distribution arrangements and marketing strategies.
As a way of conclusion, a summary of the findings and recommendations are discussed. A non-exhaustive list of ideas for future research on the topic is also provided.
1.2 Research problem
Short Food Supply Chains (SFSCs) exist under a variety of configurations (Farmer’s market, farmer’s basket, self-service shop, contract farming, etc.). They are systems intending to significantly reduce the number of intermediaries and/or the geographical distance between producers and consumers.
Those alternative food supply systems are already present in Switzerland, nevertheless the majority of consumers still grocery shops in major food retailers such as Coop, Migros, Aldi or Lidl who possessed 72.8% market shares combined in 20161 (Federal Council, 2017).
Additionally, consumer and purchasing behaviors are evolving. Small shops, short food chains and online sales have started organizing themselves to compete with mainstream retailers. Not only the channels through which consumer purchase are evolving, but also consumer needs as a whole. For food products, the era of responsible consumption has come with increased concern for sustainability, bio certification and ecology.
This trend towards local products now present in Switzerland and Europe had initially started in the US and is now getting more and more attention (Commerce de détail: la grande mutation, 2019).
Nevertheless, the agricultural sector which contributed to 1% of Switzerland’s Gross Domestic Product (GDP) in 2016 has been suffering from structural change shifting Switzerland’s economy towards a service-oriented one, raising concerns about food sovereignty2 (Federal council, 2017).
With the current growing interest of the population in topics related to sustainability, SFSCs have the potential to help in fostering an economy of proximity supporting Swiss farmers whose agriculture exploitations have shrunk from 64’000 in 2005 to 53’000 in 20153 (Federal council, 2017).
Despite the gravity of the situation for Swiss farmers, short food supply chains remain a topic of little interest which lacks visibility among consumers. Therefore, in this context of proximity, sustainability and “fair” consumption, the study of Short Food Supply Chains in Vaud could be socially beneficial.
Farmers – who are the first actors of SFSCs – focus on the production rather than the commercialization of their production. By not considering the consumer as the centerpiece of their business, they have little knowledge of what is expected from them, and thus fail in knowing who to target and how to effectively communicate with them. For this reason, the aim of this research is to understand, define and identify frequent users of SFSCs of fruits and vegetables in the canton of Vaud in order to provide actionable information about consumer profiles having high business value.
This information is then used to propose marketing strategies to upstream actors of SFSCs to effectively organize, market and promote the sale of their products. Some distribution methods are also discussed with the aim of improving customer purchasing experience. Eventually, the goal is to increase the share of consumption taking place through those food supply systems in the canton of Vaud.
2 Agriculture, 2017. [online]. [Viewed 17 October 2019]. Available from:
https://www.eda.admin.ch/aboutswitzerland/fr/home/wirtschaft/taetigkeitsgebiete/landwirtschaft.html 3 Agriculture, 2017. [online]. [Viewed 17 October 2019]. Available from:
1.3 Literature review
The concept of “Alternative Food Networks” (AFNs) was initially used as an umbrella term referring to the networks of food supply and its actors which differed from the standardized industrial ones (Murdoch et al, 2000).
AFNs were historically seen as a solution for vulnerable production system located in peripheral rural regions which were negatively impacted by globalization and market liberalization (Ilbery and Kneasfsey, 1999). However, the growth of new food circuits in globalized agricultural economies taking place in non-peripheral rural regions testifies of a set of fundamental changes in consumer preferences such as the growing concern for ecology, health and animal welfare (Renting et al, 2003).
While AFNs emphasize on the relations of the networks’ actors (consumers, producers and other potential actors such as intermediaries), SFSC is considered as a more specific term stressing out the interrelations between the actors directly involved in the production, processing, distribution, and consumption (Renting et al, 2003).
As defined by Parker (2005), SFSCs is considered short when the geographic distance between the farm and the consumer is perceived as low and/or when the number of intermediaries between the producer and the consumer is reduced (ideally, one maximum).
While geographic proximity is at the core of SFSCs, the notion of organized proximity (Torre, 2010) is also fundamental. It represents how close actors can be irrespectively of the geographical distance separating them. Based on those two notions, a supply chains typology has been provided by Aubry and Kebir (2013) which extends the one provided by Renting et al., (2003) (Face-to-Face, Proximate, Extended) as shown in figure 1.
The degree to which a relationship between producers and consumers can be characterized is highly dependent on the strength of the proximity (organized and geographical) existing between the supply and demand.
Furthermore, supply chains with direct relations (case IV) also benefit from a significant degree of value-laden information This means that the chain is more transparent and that products reach a consumer who is aware of the provenance and quality attributes of the food (Renting et al., 2003).
Figure 1 – Typology of Short Food Supply Chains
Figure 1 Typology of SFSCs, Source: Aubry and Kebir, (2013, p.87)
SFSCs are often associated with elements such as food quality and locally embedded sustainable farming practices (Ilbery and Maye, 2005; Goodman, 2003). However, Born and Purcell (2007) also point out that the assumption that SFSCs result in ecologically-sound outcomes can be a common misconception.
On the consumer side, Brown et. al (2009) reports that French consumers’ higher motivation to consume fruits and vegetables box schemes were the quality of products. They also outline the importance of ecological commitment in their purchase decisions. In another consumer study conducted to explore consumers’ perception of local food, elements such as “quality”, “locality” and “freshness” came out of the word association method (Roininen et al., 2005). Furthermore, Stolz et al. (2010) show that consumers having a strong interest in organic products are less price sensitive than conventional food consumers.
Hinrichs (2003) also mentioned the elitist status of such movements as they mainly resonate with conscientious consumers. Yet, the fact that the development of SFSCs in Europe has been substantial rather than marginal (Renting et al, 2003) challenges Hinrichs’ statement on the niche status of these food supply systems.
Although growing in importance, the activation of geographical proximity remains key for the survival of SFSCs (Kebir and Torre, 2013). They describe geographical proximity as the building of channels and/or tools by which supply and demand will interact.
Numerous studies on consumer preferences and willingness to pay for local food exist as well as many studies trying to evaluate the sustainability and environmental impact of such supply systems. Several publications focusing on the role short food supply chains plays in rural development also exit, but very few have actually studied the consumer profiles and providing an activation strategy through promotional strategies.
Moreover, studies on short food supply chains in the canton of Vaud are almost inexistent which further motivates the need for additional research.
1.4 Research objectives
The objectives of this research are manifold. It aims at understanding, defining and identifying consumers of SFSCs of fruits and vegetables in the canton of Vaud.
Another objective of this research is to understand who is more likely to be a frequent consumer of fruits and vegetables sold through short food supply chains and to identify the predominant factors increasing the likelihood of someone frequently consuming through those food supply systems.
The understanding of the driving forces to local consumption will also be complemented by an analysis of the social representation that consumers have of locally produced fruits and vegetables.
The identification resulting from this central analysis will then be used as the corner stone of the research to tackle other aspects such as the development of detailed marketing strategy articulated around distribution and promotion strategies.
2. Methodology
The research methods applied for this report are mainly twofold; a quantitative online survey and a qualitative online free association task (projective technique). Both research methods are directed towards individual consumers.
While the quantitative analysis intends to identify the profile of consumers and to quantify the drivers of local consumption, the qualitative free association task is used to understand the social representation of short food supply chains by the respondents.
2.1 Quantitative online survey
2.1.1 The survey
An online survey which can be found in appendix 1 was designed using Google Form. The survey was created in both French and English and contained 33 questions. The survey made extensive use of 5 points ordinal Likert-Scale to rate frequency, importance and compare the experience resulting from a purchase in a conventional store or through a short food supply chain.
Another technique used in the survey is the Check-All-That-Apply (CATA) questions. This method was used to allow participant to select multiple questions and to avoid constraining their responses. The option “Other” accompanied with a short description was always given to the participants for CATA questions.
Also, every question was mandatory. If a participant did not answer a question, he or she could not keep filling in the survey. Unfortunately, Google Form does not provide a functionality to obtain the rate of abandoned trials.
Participants were asked questions by sections, each focusing on a specific aspect of the research. Before each section, a short definition of what SFSCs are was provided to ensure that all participants had at least a minor idea of the topic of interest. The definition provided was the following:
“Short food supply chains are a type of food supply system. They involve very few intermediaries, and, in many cases, products only travel a short distance, so producer and consumer can actually talk to each other. The main goal of the short food supply chain is to promote local food production and consumption. Examples of short food supply chains (SFSCs) are farmers market, farm shops, farmer's basket, etc.”
The 6 sections of the survey were the following ones: • Perception of locally grown food
The first section of the survey tried to understand the perception people have of locally grown food. The free association task took place at an early stage in order to avoid any bias in the mental representation of the participants. The methods used to analyze the data resulting from this section are discussed in greater depth under section 2.2.
• Current purchasing behavior
The second section of the survey sought to describe in a standardized way the purchasing behavior of people. Participants were asked questions about aspects such as the frequency of purchase, the percentage of food expenditure fruits and vegetables represent, usual place of purchase, distance from home to the place of purchase as well as when the purchase usually occurs.
• Do you buy through short food supply chains?
The third section contained one conditional question: “Do you buy through short food supply chains?”. The response was categorical (yes or no) and participants were redirected to either section 4 (Local food consumption) or 5 (“I have never purchased any item through short food supply chains”) of the survey based on their answer. This logic has proven useful to avoid combining opinions of respondents having previous knowledge of SFSCs with those having no prior experience.
• Local food consumption
The fourth section aimed at understanding local consumption patterns. Although mainly focused on fruits and vegetables, certain questions went beyond those food items. Again, aspects such as the frequency of purchase through SFSCs or the type of SFSCs used were studied. However, this section emphasized on the underlying motivations for choosing a SFSC.
• “I have never purchased any item through short food supply chains”
The fifth section was created for participants who have responded “no” in the third section. The reason for this section was to avoid asking question about SFSCs to people having never purchased through those channels and thus having a higher chance of not responding correctly and falsifying the accuracy of the results. The results coming from this section were not used for this study given the objective of this research and the small sample size.
• Demographics
The sixth section focused on common demographics such as age, gender, income etc. The responses to this section are useful in profiling consumers not only based on their behavior, but also on demographic factors.
2.1.2 Sampling method
Given the resources at disposal to conduct this study, the online survey was diffused through several online channels and following non-probabilistic sampling methods. The two types of non-probabilistic sampling methods which were used are:
• Convenience sampling
This sampling technique targets people who are the easiest to reach. Far less expensive, more efficient, and simpler to execute, convenience sampling also has its drawbacks, namely the lack of generalizability of the sample (Jager et al., 2017). In this effort, family, friends and work colleagues were contacted to fill in the survey.
• Voluntary sampling
The second technique used is the voluntary sampling method whereby respondents self-selected themselves to participate to the survey and no inclusion criteria was imposed onto them. However, a filtering based on the canton of residence was applied afterwards (respondents of canton of Vaud only were selected).
For not being probabilistic, those methods result in some biases as well as affecting the statistical validity of the findings. To somehow counter this drawback, the sample size was increased as much as possible (𝑛 = 458).
In order to reach as many participants, the survey was shared via email and on social medias (Facebook, LinkedIn, Twitter). The link to the survey was shareable and non-unique.
2.1.3 Sample biases
As mentioned above, the sampling methods used resulted in sample biases. Indeed, the fact that some members of the intended population had a lower or higher probability of being part of the sample inherently leads to sample bias.
Voluntary sampling leads to self-selection bias whereby respondents self-select themselves to take part into the survey. This part of the population is likely to have a stronger interest in the topic given their self-participation.
Another aspect worth to be mentioned is that unfortunately, randomization of the answers wasn’t possible with Google Form and as a result, preventing participants to select first answers by convenience could not be done.
2.1.4 Data analysis
In order to extract valuable information from the survey data, a rigorous and systematic approach to the data analysis had to be followed. For this report, the software Stata version 13.1 and MS Excel have been used.
Also, the format of the data was of high importance for the analysis. Besides the answers from the free word association task, the data collected is categorical, taking on discrete values. While most of the variables are ordinal, some of them are used as dummy variables taking on the value of 1 if the event of interest occurred and 0 otherwise. A detailed list of the variables, the scales as well as the numerical values assigned to each category is presented in appendix 2.
First of all, the results from the survey were analyzed in an explorative way. The use of pivot tables and data visualization helped in having a better understanding of the nature of the data. Also, this primary analysis has proven to be helpful to guide the second part of the survey analysis which was done using probit model.
The probit model is well adapted to use when the dependent variable is dichotomous (taking on two possible values). In this case, the objective was to identify who is likely to be a frequent consumer of fruits and vegetables through SFSCs. The dependent variable takes on the value of 1 if the respondent is a frequent user and 0 otherwise. It is worth mentioning that probit models use the cumulative normal distribution as a link function (probit link) to transform any real value into a probability between 0 and 1.
2.2 Projective technique - free association task
2.2.1 Free word association task
In the survey, the first section “perception of locally grown food” contained two questions related to the free word association task.
The first question asked participants to write three words that came to their mind when they thought about “locally grown fruits and vegetables”.
The second question asked them to rate from -3 to +3, their attitudes towards the words evoked. For example, a participant responds to the first question with the words 1) Expensive, 2) Not convenient, 3) Environment. The participant then needs to assign a value as follows: first word: -2, second word: -1, third word: +3. Those values give a connotation to the evoked word which can be either negative, neutral or positive.
2.2.2 Theory of Social Representation
The theory of social representation which was initially developed by Serge Moscovici in 1961, relies on three dimensions; attitude, information and field of representation; the field of representation essentially represents the perception consumers have of a good or service, the amount of information at disposal will make the field of representation more or less accurate while the attitude will bring a positive or negative connotation to the equation (Rodrigues et al., 2017).
Figure 2 – Three-dimensional representation of knowledge
Figure 2 Three-dimensional representation of knowledge, Source: Rodrigues et al., 2017, p.228
Also, researchers in social psychology have seen this theory of social representation as “a flexible conceptual framework that enables us to understand and explain the way individuals and groups elaborate, transform, and communicate their social reality“ (Rateau et al., 2012).
In this study, this theoretical framework was used in order to identify the underlying motivations for people in the canton of Vaud to buy fruits and vegetables through short food supply chains and their perception of such food supply systems. In this case, it aimed at understanding if frequent and non-frequent users of SFSCs have a common and shared understanding or representation of locally grown fruits and vegetables.
2.2.3 Central Core Theory
The central core theory which was initially formulated by Jean-Claude Abric in 1976 is a theory derived from social representation theory. The central core theory is considered to be a structural approach of social representations (Rodrigues et al., 2017; Abric, 1976).
According to Abric (1976), social representation is composed of two main components which are the central core and peripheral elements.
The central core is “directly linked and determined by historical, sociological, and ideological conditions” and is “strongly marked by the collective memory of the group and the system of norms to which it refers”. In other words, the central core is the result of a consensus. (Abric, 1976).
On the other hand, the peripheral elements are flexible and allow individual and past experiences to be expressed. The peripheral elements are also known to be sensitive to the current context (Abric, 1976).
Abric (2003), introduces the four zones into which social representation can be divided. The resulting framework in figure 2 allows for a visual representation of the central and peripheral elements given specified importance and frequency cut-off values.
Figure 3 – Structural frequency-importance matrix of social representation
Figure 3 Structural frequency-importance matrix of social representation, Source: Rodrigues et al., 2017, p.228)
2.2.4 Data analysis
The data analysis of the free word association task for this study closely followed the procedure used by Rodrigues et al. (2017) in “Eating flowers? Exploring attitudes and consumers’ representation of edible flowers”.
This paper used the following techniques of lemmatization and categorization to analyze the frequency and importance of elicited words.
2.2.4.1 Linguistic corpus reduction: lemmatization and categorization
The first stage of the analysis of the free word association tasks is called “lemmatization”
which is, according to the Cambridge dictionary,
“the process of grouping inflected forms together as a single base form”. In other words, this process groups word by their lemma (root) in order to facilitate the count of words and thus, the analysis of such data.
The second stage is the categorization. This process is more subjective and consists in categorizing the lemmatized words. Categories are connotated either positively or negatively in order to obtain meaningful categories leading to actionable and insightful information about the central core and peripheral elements.
2.2.4.2 Frequency and Importance analysis
Frequency and importance analysis allows the allocation of category to a specific quadrant of the matrix of social representation from figure 2.
To do so, cut-off values have to be defined. Following Wachelke and Wolter (2011), the importance cut-off values is defined as 50% of the frequency of the modal category. The importance cut-off value is inspired by Abric (2003) and is computed by averaging the importance value across categories (Rodrigues et al., 2017). However, as in this study participants were not asked to rank the evoked words from the most to the least important, the evoked words were attributed a score based on their positions in the elicitation exercise (e.g. 1st word evoked: 3, 2nd word evoked: 2, 3rd word evoked: 1). Based on those cut-off values, categories are visually placed onto the matrix composed of the following four elements:
• Central core: high-frequency and high-importance elements • First periphery: high-frequency and low-importance elements • Second periphery: low-frequency and low-importance elements • Contrasting elements: low-frequency and high-importance elements
This analysis is useful to describe shared representation which people in the canton of Vaud have of locally produced fruits and vegetables and articulate a go-to market strategy for suppliers which is more in accordance with this representation.
Peripheral elements are as rich in information as the central core as they also communicate what is not collectively shared or what is not important. This information is
of high value when developing a marketing strategy as it tells us where not to focus to target massively for instance.
2.2.4.3 Polarity Index
In this study, the polarity index was computed by category and was used to describe and understand the implicit attitude of the social representation (Rodrigues et al., 2017). The following formula was used to compute the polarity index:
𝑃 =𝑁( )− 𝑁
(+ 𝑁(
Where, 𝑃 is the polarity index, 𝑁() is the number of time the word category 𝑖 was assigned a positive value, 𝑁(+ is the number of time the word category 𝑖 was assigned a negative value and 𝑁( is the total number of time the word category was listed.
The index ranges from -1 to +1. If P is negative, the word category has on average a negative connotation. If P is positive, the word category has on average a positive connotation
3. Results
This section of the report presents the results of the various analyses performed and make extensive use of data visualization through charts.
3.1 Survey
Given that the population of interest is composed of Short Food Supply Chains users only, the selected sample contained 458 participants which were filtered based on their answer to the question: “Have you ever bought any item through SFSCs?”. Only those answering “yes” were kept.
Also, to differentiate between frequent users (FUs) and non-frequent users (NFUs), a dummy variable was introduced which took on the value of 1 if individuals had a frequency of purchase through SFSCs of 4 and 5 (4=Once a week, 5=A few times per week) and 0 otherwise.
Moreover, to test if there is any statistically significant difference in the mean of the two groups (FUs and NFUs), t-tests are performed under the null hypothesis that there is no difference in the mean.
As stated, self-selection played an important role on the sample and it is therefore not surprising to see that the sample is composed of approximately twice as much frequent users than non-frequent users as shown in figure 4.
Figure 4 – Frequent vs non-frequent users of SFSCs
3.1.1 Demographics
As part of the demographics, participants were asked about their gender, age, education, yearly income before tax, size of the household and status. When it made sense, the distinction between frequent and non-frequent users was illustrated and described. The gender distribution of the sample is unbalanced with three times as much women than men. Women represent 75% of the sample, men 24% and those identifying as “other” 1% as shown in figure 5.
Figure 5 – Gender distribution
Again, considering the self-selection bias affecting the sampling method, it appears that women tend to be more interested in topics related to local food consumption than men.
66% 34%
Frequent users Non-frequent users
75% 24% 1% Female Male Other
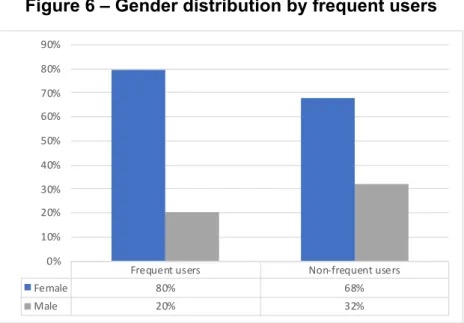
Indeed, figure 6 shows that the proportion of women frequent users is larger than the proportion of men.
Figure 6 – Gender distribution by frequent users
A Chi-square test of independence was performed to test the null hypothesis of independence between the two categorical variables (“frequent user” and “gender”). This test showed at 99% confidence that both variables are dependent.
Furthermore, a t-test was performed to understand if there is any statistically significant difference in the mean of the variable “frequent users” by gender (male or female). T-test results are significant at 99% confidence showing that there are on average more women frequent users than men. The results of the Chi-square and t-test can be found in appendix 3.
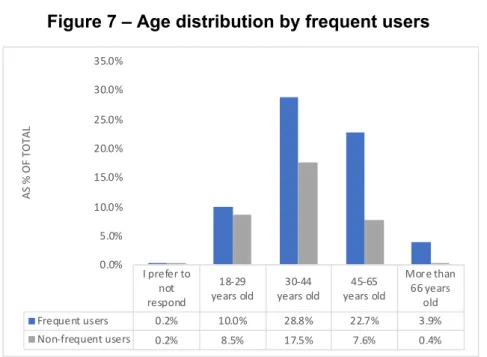
Figure 7 shows the age distribution of the sample for both categories; FUs and NFUs. The modal category of the sample is the “30-44 years old” one with 46.3% of respondents, followed by the “45-65 years old” with 30.3% respondents. Combined, those two age categories represent 76.6% of the sample.
To test whether there was a statistical significance of age between frequent and non-frequent users, a t-test was performed and the results, which can be found in appendix 4, were statistically significant at 99% confidence (p-value = 0.0000) showing a higher mean in the variable “age” for frequent users.
Frequent users Non-frequent users
Female 80% 68% Male 20% 32% 0% 10% 20% 30% 40% 50% 60% 70% 80% 90%
Figure 7 – Age distribution by frequent users
Figure 8 shows the distribution of yearly income before tax. The modal category is “CHF 50’000 – CHF 80’000” with a 36% proportion of the sample falling into this category.
Figure 8 – Distribution of yearly income before tax
The sample seems to cover a wide range of income considering the spread of the categories. A t-test was performed to test if there was any statistically significant difference in the mean of frequent and non-frequent users with regards to the income. Results have proven insignificant which show that frequent and non-frequent users have on average corresponding level of yearly income before tax. The results can be found in appendix 5.
Regarding the status of the participants in figure 9, most of them reported to be either married or living with a partner. Those two categories represent 71%.
I prefer to not respond
18-29
years old years old30-44 years old45-65
More than 66 years old Frequent users 0.2% 10.0% 28.8% 22.7% 3.9% Non-frequent users 0.2% 8.5% 17.5% 7.6% 0.4% 0.0% 5.0% 10.0% 15.0% 20.0% 25.0% 30.0% 35.0% AS % O F TO TA L I prefer to not
declare Under CHF50'000 CHF 50'000 -CHF 80'000 CHF 80'000 -CHF 120'000 CHF 120'000 -CHF 170'000 CHF 170'000More than
Total 10% 17% 36% 26% 8% 2% 0% 5% 10% 15% 20% 25% 30% 35% 40% AS A % O F TO TA L
Figure 9 – Status
Level of education is another important factor which can sometimes greatly influence the consumption behavior of individuals. In this case, the majority of the sample is composed of highly educated people with 64% having an education level ranging from Bachelor to PhD degrees. Considering that the survey was also shared through university networks, those results are not unexpected.
However, t-test results were not statistically significant showing no mean difference between FUs and NFUs in terms of education level. T-test results can be found in appendix 6.
Figure 10 – Education level
The last demographics to be considered is the size of the household of the participants. Participants were asked to give the size of their household in number of individuals. However, it is important to note that household of size 5 can as well mean two parents and three children than 5 roommates.
Married Living with a
partner Single, nevermarried Divorced orseparated Widowed
Total 41% 30% 18% 8% 2% 0% 5% 10% 15% 20% 25% 30% 35% 40% 45% AS % O F TO TA L 38% 29% 26% 6% 2% Master and PhD
Upper secondary education
University level
Primary level and lower secondary education
The sample is well distributed between the different household size as shown in figure 11. The majority of the sample’s household is composed of 2 members, followed by 4 and 3. Those results seem coherent given the fact that most participants stated being either married or living with a partner.
Figure 11 – Household size
Furthermore, an interesting dynamic to be discussed is how household size could impact if a consumer of SFSC is frequent or not. One may think that the larger a household is, the more chances of being a non-frequent consumer are. To support this hypothesis, the need for convenience could be invoked.
However, t-test results showed no significant difference in the mean of frequent users with regards to the size of the household. The t-test results can be found in appendix 7.
3.1.2 Purchasing behavior
During the survey, participants were mainly asked questions about their purchasing behavior. For instance, about the percentage of food expenditures represented by fruits and vegetables, the location and timing of their purchase, through which channels they buy as well as the drivers of their decisions. Participants were also asked to compare their experience of short food supply chains to the experience of conventional food chains (e.g. retailers).
Figure 12 shows the share of food expenditures fruits and vegetables represent in a consumption basket. Visually, it can be seen that frequent users seem to allocate a higher share of their groceries to fruits and vegetables. To confirm this hypothesis, a t-test was performed which showed at 99% confidence level (p-value = 0.0000) that frequent users spend on average a higher share on fruits and vegetables. Frequent users
1 14% 2 36% 3 19% 4 22% 5 8% More than 5 1% 1 2 3 4 5 More than 5
would spend an average of 20-30%, while non-frequent users would spend 10-20%. The results can be found in appendix 8.
Figure 12 – Fruits and vegetables as percentage of food expenditures
Figure 13 shows that most people travel an average distance of 0-2 km from their home to their place of purchase. It also shows that frequent users are closer to the place of purchase than non-frequent users.
After running a t-test to statistically prove if the mean average distance is different for frequent users than frequent users, it has been proven at 90% confidence that non-frequent users have an average distance which is on average higher than non-frequent users. This shows that frequent users are on average closer to the place of purchase which could be explained by the fact that they might be better informed of the closest SFSCs alternatives around them compared to non-frequent users. The t-test results can be found in appendix 9.
Figure 13 – Average distance from home to place of purchase
0-10% 10-20% 20-30% 30-40% More than40% Frequent users 2% 10% 20% 22% 13% Non-frequent users 2% 10% 13% 6% 3% 0% 5% 10% 15% 20% 25% AS % O F TO TA L 0-2 km 2-4 km 4-6 km 6-8 km More than 8km Frequent users 33% 16% 9% 4% 3% Non-frequent users 16% 8% 5% 4% 2% 0% 5% 10% 15% 20% 25% 30% 35% AS % O F TO TA L
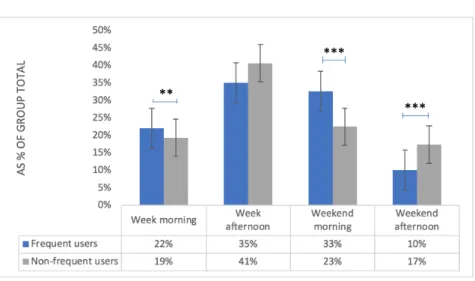
Another aspect of the purchase behavior which is of interest is the timing of the purchase, in other words, when is the purchase taking place throughout the week. Participants could answer among 4 propositions; during the week in the morning, during the week in the afternoon, during the weekend in the morning or during the weekend in the afternoon (afternoons mean up to the closing of the stores).
Figure 14 reveals interesting patterns. There was a statistical significant difference in the mean when comparing frequent users to non-frequent users for specific timing of purchase namely, during the week in the morning, during the weekend in the morning and during the weekend in afternoon. The results of the t-test can be found in appendix 10.
The fact that the mean number of participants purchasing fruits and vegetables is higher for frequent users during the week and the weekend in the morning is a valuable piece of information for producers who wonder when is the best time to sell their products.
Figure 14 – Timing of purchase by frequent users
T-test: *** p<0.01, ** p<0.05, * p<0.1
To have a better understanding of which supply chains are favored by frequent and non-frequent consumers when it comes to buying fruits and vegetables, figure 15 shows if participants selected different channels for their usual grocery shopping versus their purchase of fruits and vegetables only.
What can be observed is that the majority of the respondents buy their groceries and fruits and vegetables at the same place; traditional retailers (Migros, Coop, Aldi, etc.). However, second and third positions are occupied by “farmers markets” and “farmer’s baskets”.
The number of non-frequent users purchasing fruits and vegetables through retailers is on average higher compared to frequent users. The same holds for online purchase of fruits and vegetables which should be taken into account when formulating marketing strategies to attract new customers. On the contrary, frequent users are, on average, more likely to purchase fruits and vegetables through farmers markets, farmer’s baskets and farm shops. T-test results can be found in appendix 11.
Figure 15 – Channels for purchase of fruits and vegetables by frequent
users
T-test: *** p<0.01, ** p<0.05, * p<0.1
Nevertheless, it is necessary to understand if the frequency of purchase through short food supply chain can have an effect on the complementarity of traditional and short food chains.
Figure 16 – SFSC frequency vs traditional retailer
No Yes
Never 0% 2%
A few times per year 2% 28%
Once a month 5% 20%
Once a week 63% 42%
A few times per week 30% 7%
0% 10% 20% 30% 40% 50% 60% 70% % O F G RO U P TO TA L
Figure 16 shows that the modal frequency of purchase of fruits and vegetables is once a week which is sensible considering that fruits and vegetables are perishable commodities.
Furthermore, 93% of those not buying fruits and vegetables through traditional retailers buy through SFSCs either once a week or a few times per week, whereas only 49% of the other group (“Yes”) do.
A t-test was performed to check if the average difference of purchase frequency is statistically different between the two groups. The results, which can be found in appendix 12, showed a mean frequency of purchase of 4.22 for the group “No” and 3.23 for the group “Yes”. Those values correspond to a frequency of once a week and once a month respectively.
Having a clearer understanding of the how and when people buy through SFSCs, it remains of crucial importance to understand why they would favor those food chains over others and what are the driving forces of their decisions.
Table 1 shows how frequent and non-frequent users of SFSCs ranked the following 8 reasons that led them to buy through SFSCs. The t-test results are displayed for frequent users when having a statistically higher mean than non-frequent users.
Table 1 Reasons to buy through SFSCs
Frequent users Non-frequent users
Local production (16%) *** Freshness of products (19%)
Freshness of products (16%) *** Local production (17%)
Quality of products (15%) *** Quality of products (14%)
Environment (15%) *** Geographical proximity (13%)
Promotion of agriculture (12%) *** Environment (12%)
Geographical proximity (11%) ** Promotion of agriculture (10%)
Social proximity (11%) *** Social proximity (10%)
Price (5%) Price (6%)
Despite not being in the same order, the top 3 reasons leading FUs and NFUs to buy through SFSCs are the same. Also, both groups ranked “Social proximity” and “Price” as being the last reasons for their purchase decision.
Interestingly, it can be highlighted that consumers in the sample put high value on the product they buy rather than matters of proximity, environment and promotion of agriculture. These results seem to support the fact that SFSCs are characterized by having a high degree of value-laden information and quality products.
However, consumers seem to be less driven by the possibility to build a relationship or having more interactions with the producers.
Mean differences between frequent and non-frequent users were statistically significant for all the reasons to buy through SFSCs except for “Price”. Frequent users reported higher mean than non-frequent users, especially for the following reasons: “Environment”, “Product quality”, “Promotion of agriculture” and “Local production”. Results of the t-tests can be found in appendix 13.
Table 2 shows the elements which were deemed “Fairly important” or “Very important” by users of SFSCs.
On the one hand, a tendency to focus on product attributes (bio label) and quality is observed but on the other hand, “Distance from home” and “Social interaction” seem to contradict the ranking of “Geographical proximity” and “Social proximity” of table 2. The elements with the lowest frequency, however, are somewhat consistent. Indeed, “Reputation”, “Price”, and “Size of the farm” are present in almost all categories as the last 3 elements of importance when choosing a SFSC.
The contradictions mentioned above give indications on the elements which are the drivers of consumption through SFSCs and those which are considered when choosing a SFSC over another.
The main reasons to buy are the locality of the production, the quality and freshness of the products. However, when consumer need to make a decision of whether to buy fruits and vegetables at the local farmers market downtown or go to a farm shop, they do take into account the distance needed to get there.
Table 2 – Importance of elements when choosing a SFSC
T-tests were performed to check whether some elements were on average more important for frequent users compare to non-frequent users when choosing a SFSC. For frequent users, elements which were on average more important are the bio label, the knowledge of the producer, the product quality and the social interaction. On the other hand, elements which were on average more important for non-frequent users when choosing a SFSC are the price and the variety of products. The t-test results can be found in appendix 14.
Frequent users Non-frequent users
Fairly important Very important Fairly important Very important
Distance from home (19%) Product quality (47%) Distance from home (18%) Product quality (46%) Product quality (17%) Bio label (16%) Product quality (17%) Distance from home (17%)
Social interaction (12%) Distance from home (12%) Word of mouth (14%) Social interaction (7%)
Bio label (11%) Social interaction (7%) Knowledge of producer (10%) Word of mouth (6%)
Variety of products (11%) Word of mouth (5%) Social interaction (10%) Knowledge of producer (6%)
Word of mouth (9%) Knowledge of producer (5%) Variety of products (10%) Price (6%) Knowledge of producer
(7%) Variety of products (4%) Bio label (8%) Bio label (5%) Reputation (7%) Reputation (3%) Reputation (7%) Variety of products (4%)
Price (5%) Price (1%) Price (6%) Reputation (3%) Size of farm (1%) Size of farm (0.3%) Size of farm (1%) Size of farm (1%)
Participants were also asked to compare short food supply chains to traditional food supply chains on different given points such as “Product range”, “Convenience”, Freshness of products, “Social interaction”, “Price” and “Overall experience”. Figure 17 shows the rating for non-frequent users.
Figure 17 – SFSC vs traditional food chains for NFUs
The “Overall experience” of SFSCs seems to be better appreciated. “Social interaction” and “Freshness of the products” are also components which compare better. However, “Price”, “Product range” and “Convenience” are elements that compare worse.
The elements which compare worse may be what is missing in non-frequent users’ purchasing experience. Also, those elements may also explain the reason why they aren’t frequent consumers of SFSCs.
Interestingly, frequent users of SFSCs do not have the same opinion of how SFSCs compare to traditional food chains. The results from figure 18 are surprising with “Price” being the element which compares better in first position.
“Overall experience”, “Social interaction” and “Freshness of products” are the elements which compare “Slightly better” or “Better” the most for both FUs and NFUs. Nevertheless, as seen in table 1, “Social interaction” isn’t one of the main reasons leading people to buy through SFSCs. Product attributes however, definitely seem to be
0% 20% 40% 60% 80% 100% 120% Convenience Product range Price Freshness of products Social interaction Overall experience
Convenience Product range Price Freshness ofproducts interactionSocial experienceOverall
Worse 14% 15% 10% 0% 4% 1%
Slightly worse 36% 43% 28% 2% 4% 4%
Similar 28% 26% 40% 12% 17% 19%
Slightly better 15% 6% 13% 61% 46% 40%
important at all levels. The “Overall experience” is also much more appreciated and considering the increased importance given to customer experience these days, it can only be an advantage for SFSCs actors.
Figure 18 – SFSC vs traditional food chains for FUs
While frequent users compare on average “Convenience”, “Price” and “Product range” better than non-frequent users, both groups show no statistical significant difference in the mean of “Freshness of product” and “Social interaction”. T-test results can be found in appendix 15. 0% 20% 40% 60% 80% 100% 120% Product range Convenience Freshness of products Social interaction Overall experience Price
Product range Convenience Freshness of
products interactionSocial experienceOverall Price
Worse 8% 1% 0% 1% 1% 3%
Slightly worse 42% 20% 2% 4% 2% 25%
Similar 20% 36% 7% 8% 3% 37%
Slightly better 15% 29% 75% 71% 78% 15%
3.2 Probit model: who is a frequent user of SFSCs?
Building on the previous findings, this section presents the results of the probit model. This model is used to predict probabilities of an event happening. In other words, which elements influence the chances of someone being a frequent user of SFSCs.
Table 3 probit regression output – Frequent user
Variables Frequent user
Age 0.391***
(0.121) Comparative rating of convenience 0.449***
(0.0914) Comparative rating of price 0.189**
(0.0836) Frequency of purchase of fruits and vegetables 0.751*** (0.148) Familiarity with the concept of SFSC 0.616* (0.351) Percentage of fruits and vegetables expenditure 0.287***
(0.0847)
Price -0.253**
(0.107) Reason to buy through SFSCs: Local production 0.524** (0.241) Reason to buy through SFSCs: Environment 0.635***
(0.192) Reason to buy through SFSCs: Freshness of products 0.580** (0.245) Usually buy groceries through farmers markets 0.360** (0.182) Usually buy groceries through farmer’s baskets 0.901***
(0.299) Usually buy groceries through retailers 0.930** (0.442) Usually buy fruits and vegetables through farmer’s baskets 0.873***
(0.309) Usually buy fruits and vegetables through farm shops 0.539* (0.325) Usually buy fruits and vegetables through retailers -1.983***
(0.322) Vegetarian/vegan 1.059*** (0.340) Constant -6.915*** (1.108) Prob > chi2 Pseudo R2 Observations 0.0000 0.5353 458
Standard errors in parentheses *** p<0.01, ** p<0.05, * p<0.1
The interpretation of the coefficient can be somehow tricky. The coefficients represent the increase in the z-score for a one-unit change in the independent variable.
For instance, the coefficient for the variable “Age” is 0.391 which means that for a one-unit increase in the variable “age” (which is measured on a scale of 0 to 4), the z-score increases by 0.391 and thus, the probability of being a frequent user of SFSC increases.
Put simply, the older one gets, the more likely he or she is to consume frequently through SFSCs.
As shown in figure 19, the proportion of frequent users increase with the age, while the proportion of non-frequent users decreases.
Figure 19 – Proportion of FUs vs NFUs by age group
Regarding the variable “Price”, the coefficient is negative, and the variable is categorical taking on values of 0 or 1. In this case, the interpretation of the coefficient is to be understood as follows; if participants deem the price as being an important element in choosing a SFSC, they are less likely to be a frequent user.
Figure 20 – Proportion of FUs vs NFUs vs importance of price
Furthermore, it can be clearly observed from figure 20 that the proportion of frequent users is much higher for participants having answered “Not at all important” or “Slightly important” to the question: “When choosing a SFSC, how important is the price in your decision?”.
I prefer to not respond
18-29 years
old 30-44 yearsold 45-65 yearsold
More than 66 years old Frequent users 50% 54% 62% 75% 90% Non-frequent users 50% 46% 38% 25% 10% 0% 10% 20% 30% 40% 50% 60% 70% 80% 90% 100% Not at all
important importantSlightly importantFairly Important importantVery Frequent users 79% 75% 51% 64% 45% Non-frequent users 21% 25% 49% 36% 55% 0% 10% 20% 30% 40% 50% 60% 70% 80% 90%
Other explanatory variables which have relatively high impacts on the probability of being a frequent user of SFSCs are the ones related to the channels used to buy groceries and/or fruits and vegetables. People who claimed buying their fruits and vegetables usually in retailers are far less likely to frequently buy them through SFSCs. However, those who claimed buying their groceries and fruits and vegetables usually through farm shops and/or farmer’s baskets are more likely to be frequent users. Those results are intuitive and expected but still shows that more than fruits and vegetables only can be bought through those short food supply chains.
Also, the frequency of purchase of fruits and vegetables and the percentage of expenditure it represents in a grocery consumption basket are two variables increasing the probability of being a frequent user. The more frequent the purchase of fruits and vegetables and the more money spent on those, the more likely consumers will buy frequently through SFSCs.
Another set of variables which has an influence on the likelihood of being a frequent user comes from the question: “What was the reason leading you to buy through SFSCs?” (CATA). Table 1 already ranks the reasons by frequency however, three main reasons are statistically significant in the probit regression model; “Environment”, “Local production”, “Freshness of products”.
From the model output, it seems that the better one rates the elements “Convenience* and “Price” comparatively to traditional food chains, the more likely one is to be a frequent user of SFSCs. Even though convenience wasn’t the most well rated elements, it does confirm the fact that frequent users have a better perception of SFSCs. This perception might not be objectively true, but only subjective. Indeed, SFSCs aren’t usually known to be more convenient than traditional food chains as they require more efforts from the consumer to be found and reached.
Lastly, two additional variables which have not been previously described resulted to be statistically significant in the probit model; “Vegetarian/vegan” and “Familiarity with the concept of SFSC”. The variable “Vegetarian/vegan” identifies vegetarians or vegans as opposed to not being part of one of those groups. The variable “Familiarity with the concept of SFSC” identifies who was familiar with the concept of short food supply chains prior to taking the survey. Both have positive coefficients which means that vegetarians/vegans and people who were previously familiar with this topic are more likely to be frequent user.
While some variables brought additional information with regards to what influences the probability of being a frequent user of SFSCs, others confirmed what was previously highlighted.
Other elements which are useful when using probit models are the average marginal effects of each variable on the probability of the event of interest occurring. As explained before, in a probit model, the coefficients represent the increase in the z-score for a one-unit change in the independent variable. Although the increase in the z-score is constant, the resulting change in the probability isn’t. For this reason, it is interesting to look at the average marginal effect of each predictors.
Figure 21 – Average marginal effects of predictors
Figure 21 illustrates each variable’s average marginal effect on the probability of being a frequent user. Although focusing on the average effect may not be truly meaningful in some cases, it comes in handy in this study as most of the variables have binary outcomes.
The most important effects come from the variables “Usually buy fruits and vegetables through retailers” and “Vegetarian/vegan”. We can interpret the average marginal effects for those variables as follows; a one-unit increase in the variable “Usually buy fruits and vegetables through retailers” (0à1) leads to an average decrease in the probability of being a frequent user of approximately 33%. A one-unit increase in the variable
-. 4 -. 2 0 .2 .4 Ef fe ct s o n Pr(F re q u e n tu se r) Age Price F&V thro ugh reta ilers Comp ariso n of co nve nien ce F&V % o f exp endi ture Loca l pro duct ion Comp ariso n of price Veg etari an/ve gan Gro cery at fa rme r's ma rke ts Gro cery thro ugh baske ts SF SC fami liarit y Gro cery at re taile r Envi ronme nt F&V thro ugh baske ts Fre shne ss of pro duct s F&V thro ugh farm shop s F&V Fre quen cy of purch ase Average Marginal Effects with 90% CIs
“Vegetarian/vegan” (0à1) leads to an average increase in the probability of being a frequent user of approximately 18%. The average marginal effects can be found in appendix 16.
Some variables in the model have more than two possible outcomes. For instance, “Age”, “Fruits and vegetables as percentage of expenditure” and “Frequency of purchase of fruits and vegetables” use scales. For those variables it does make sense to understand the average marginal effect of each possible outcome.
Figure 22 – Average marginal effects of “Age”
Figure 22 shows the average marginal effects of each age group. It can be observed that the probabilities reach a plateau at 45-65 years old. Moving from one age category to the next (e.g. 18-29 à 30-44 years old, 30-44 à 45-65 years old) leads to an average probability increase of approximately 10%. However, moving from “45-65 years old” to “more than 65 years old” leads to an average decrease in the probability of being a frequent user of approximately 1%. The results from the category “I prefer to not respond” are not statistically significant as the confidence interval at 90% contains the value of 0. This is due to the very small sample size for this category (2 participants). Average marginal effects for “Age” can be found in appendix 17.
When proceeding to the same analysis for the variable “Fruits and vegetables percentage of expenditure”, more or less the same pattern than for the variable “Age” can be observed. As shown in figure 23, a plateau is reached at “30-40%”. A slight increase in the probability follows from belonging to the category “More than 40%” (+1%).
-. 5 0 .5 1 Pr(F re q u e n tu se r) I pre fer to n ot re spo nd 18-2 9 ye ars old 30-4 4 ye ars old 45-6 5 ye ars old Mo re t han 66 ye ars old
What is your age?
Also, the confidence interval for the first category “0-10%” is much larger than for the other outcomes. This comes from the fact that far fewer participants (16) have picked this answer. Average marginal effects for “Fruits and vegetables percentage of expenditure” can be found in appendix 18.
Figure 23 – Average marginal effects of “Fruits and vegetables percentage
of expenditure”
The last variable contained in the model for which non-binary outcomes are possible is “Frequency of purchase of fruits and vegetables” which states the frequency at which participants buy fruits and vegetables. The average marginal effect increases with the frequency of purchase as shown in figure 24. Average marginal effects for “Frequency of purchase of fruits and vegetables” can be found in appendix 19.
Assuming that the individual purchasing is also the one consuming, this finding means that people who eat more fruits and vegetables are more likely to frequently use SFSCs. Although this hypothesis may sound obvious, the person purchasing might be different from the one consuming. Unfortunately, no questions on the frequency of consumption was asked in the survey and as a result, this hypothesis can’t be tested.
Additionally, not one respondent has answered “never” which means that fruits and vegetables are consumed and/or purchased by virtually everyone. As a result, the market potential for SFSCs actors is immense and promising if the right marketing strategy is applied and the consumer profile well understood.
.4 .6 .8 1 Pr(F re q u e n tu se r) 0-1 0% 10-2 0% 20-3 0% 30-4 0% Mo re t han 40 %
fruits and vegetables as % of food expenditure Adjusted Predictions of fvpercentexp with 90% CIs
Figure 24 – Average marginal effects of “Frequency of purchase of fruits
and vegetables”
The probit model presented in table 4 can also be used to classify who is a frequent consumer of SFSC and who is not. The predictive power of the classifier resulting from the model can be seen in figure 25.
The probability cut-off value of 0.7 was used. The classifier exhibits a sensitivity rate of 87.38%. This means that it identifies a frequent user of short food supply chains 87 times out of 100 (true positive rate). On the other hand, the specificity rate is slightly higher with 94.90% of the non-frequent users identified correctly (true negative rate). Overall, the model can correctly predict who is a frequent user versus who is not 89.96% of the time.
Figure 25 – Classifier based on probit model
0 .5 1 Pr(F re q u e n tu se r) A f ew time s p er ye ar On ce a mo nth On ce a we ek A fe w t ime s p er w eek
How often do you buy fruits and vegetables?