HAL Id: hal-02607453
https://hal.inrae.fr/hal-02607453
Submitted on 16 May 2020
HAL is a multi-disciplinary open access
archive for the deposit and dissemination of sci-entific research documents, whether they are pub-lished or not. The documents may come from teaching and research institutions in France or abroad, or from public or private research centers.
L’archive ouverte pluridisciplinaire HAL, est destinée au dépôt et à la diffusion de documents scientifiques de niveau recherche, publiés ou non, émanant des établissements d’enseignement et de recherche français ou étrangers, des laboratoires publics ou privés.
Marielle Montginoul, A. Vestier
To cite this version:
Marielle Montginoul, A. Vestier. Smart metering: a water-saving solution? Consider communication strategies and user perceptions first. Evidence from a French case study. Environmental Modelling and Software, Elsevier, 2018, 104, pp.188-198. �10.1016/j.envsoft.2018.02.006�. �hal-02607453�
1
“Smart metering: a water-saving solution? Consider communication strategies
and user perceptions first. Evidence from a French case study.”
Marielle Montginoula, Arnaud Vestierb
a Irstea – UMR G-Eau, 361 rue JF Breton, BP 5095, 34196 Montpellier Cedex 5 Montpellier
France, Phone: 33 4 67 04 63 04, Fax: 33 4 67 16 64 40, [email protected] b Montpellier Méditerranée Métropole, Direction de l’Eau et de l’Assainissement, 50 place
Zeus, 34000 Montpellier, France, [email protected]
Abstract
Smart water meters are increasingly being installed by French water utility companies and made available to users free of charge. However, households are not taking advantage of this technology in spite of the benefits it theoretically offers. This article investigates factors that may explain this technology low adoption rate, focusing on the first two steps in the process of adoption: providing information and fostering good intentions. It describes a natural field experiment conducted in a residential suburb in which 261 households were officially informed about the new smart metering service and 77 of them were then surveyed to identify potential barriers to the adoption of smart meters. We analyse the prevailing social representations of the words “water” and “smart metering”. Although respondents seem more interested in, than opposed to, this new technology, its adoption rate remains low, particularly among heavy water consumers and flat renters.
Keywords: Smart water meters; household survey; France; social representation
1 Introduction
In a context of increasing water scarcity, France’s “Grenelle” environmental laws strongly encourage water authorities to improve network efficiency and reduce water leaks. Some authorities divide their water networks into sub-areas of water distribution, and equip them with smart meters. Water authorities are then able to read them remotely and in real time. Some water authorities go further by providing all water subscribers with smart meters. In this last case, authorities can keep information given by smart meters; but, in some cases, they add a customer application, permitting water users to monitor (free of charge) their daily water consumption and set up alerts (sent via SMS or email) to inform them when water consumption exceeds a pre-defined threshold.
When this customer application is provided, it might appear to offer a win-win solution: smart water meters are able to provide water managers and users with information on real-time consumption (Kendel and Lazaric, 2015), allowing them to both detect leaks and save water. Indeed, smart meters are viewed as a “promoter of environmentally significant behaviour”
2 (Midden et al., 2007). For instance, Davies et al. (2014) found that in Sydney (Australia) households with in-home displays installed had achieved lasting reductions in their water consumption compared to the control group (initially by an average of over 6.8%, and after three years, by 6.4%). There are also a number of other advantages for both water users (reduced cost, fewer disturbances) and water managers (productivity gains, ability to determine water pricing by taking into account water scarcity and other management constraints) (Commission de Régulation de l'Energie, 2011; Darby, 2010; Tyszler and Bordier, 2013).
All these reasons could prompt water demand modellers to predict high take-up rates for the new smart meter service: a standard cost-benefit analysis at a water user level suggests the service would have substantial benefits for users while costing them very little, and only in terms of their time (time taken to register, set up alerts, and monitor water consumption). But the results show that this technology, at least in France, is not being widely adopted by water users, as demonstrated by the very low registration rate. For instance, only 2% of the 23,000 water users supplied by Syndicat Mixte Garrigues Campagne (SMGC) (a water authority located in the south of France) had signed up for the service. Moreover, when municipal users are not included, this rate is closer to 1%. A similar rate has also been observed for a big public water authority supplying 150 municipalities around Paris (SEDIF: Syndicat des Eaux d’Ile de France). The town of Mulhouse in the north-east of France had the highest adoption rate (8%).
This article aims to explain why this rate is so low by exploring the factors determining smart meter take-up: could it be explained by the fact that users, and households in particular, are not being well enough informed, or that they have misgivings about this new technology? To find out, a natural field experiment was conducted in a residential suburb of an urban area (Montpellier, in the south of France).
The first part of this paper presents the framework chosen to analyse the adoption of smart meters. The second part describes the methodology and the case study. The third part details results and discusses the main findings. The last part offers some conclusions.
2 A framework with which to analyse smart meter adoption by households
The initial adoption of a new service can be broken down into three steps (Figure 1): information is provided, favourable intentions are created, and finally, users proceed to the behaviour itself. In this article, we focus on the first two steps in this process: the information and intention creation phases, assuming that households will register only if they have been
3 informed of the characteristics and potential benefits of the service, and have developed a positive attitude towards the service and the possibility of using it.
Figure 1. Theory of planned behaviour, adapted from Ajzen (1991)
2.1 Information: a prerequisite condition
Informing users is a prerequisite, but often overlooked, condition for take-up. Water managers too frequently assume that sending a leaflet describing what a newly installed smart meter can do is enough to prompt the action required to allow for its proper use (registering over the internet, for instance). This information step has to be done well if it is to have a significant impact and encourage a higher sign-up rate (short-term objective), or allow a lasting change in behaviour (long-term objective). Following the Lasswell communication model (Lasswell, 1948), five questions have to be answered carefully: “Who [the
communicator] says What [the message] to Whom [the receivers] in Which channel with
What effect”?
- Who? The message communicated needs to be conveyed by a legitimate person (Fischer-Lokou et al., 2004). Users may be concerned about how an institution might use the information it collects on them, how legitimate this data collection is from a legal standpoint, and whether their data will be protected, as well as a number of related issues. As a result, the French public are generally mistrustful of the private companies that manage water provision in certain areas. Anything they try to communicate is met with a certain amount of scepticism. It then becomes problematic for these companies to market new services, as users will tend to question their motives and may suspect that this boils down to financial gain (Capel, 2003).
- What? The message should clearly state that the new system is intended to help households detect leaks when these occur inside private properties (houses, gardens, apartment buildings), and better monitor their water use with a view to reducing their
4 consumption, and thus their bill. The message should highlight what the benefits are for the manager as well as for households. On the technical side of it, the information communicated should present the smart meter device, as well as the related service provided through the internet platform, in a simple and practical way, explaining how to use it and answering users’ main questions and concerns.
- In which channel? Face-to-face communication is usually more effective than written communication especially where disseminating information and winning people over to a concept are concerned (Fischer-Lokou et al., 2004). Fischer-Lokou et al. (2004) also note the interest of non-verbal means of communication. Especially in the case of written communication, inclusive language (for instance using “we” rather than “you”) allows communicators “to link a social identity to a new behaviour by stressing that this new
behaviour is a normative part of ‘who we are’” (Seyranian et al., 2015). This is generally
considered to be a helpful technique for improving the likelihood of producing the desired behaviour, in spite of the fact that in some cases no differences in behaviour were noted, as occurred during the Seyranian et al. (2015) experiment.
Communication can directly target customers through written supports such as letters, emails and/or flyers, or through face-to-face communication which can be done by meter inspectors for instance (Figure 2). Another strategy consists in reaching customers indirectly via the media, municipal authorities or consumer associations. These actors will re-disseminate it through their own information channels (including social networks), with a possible higher impact than direct communication would have. Raising school children awareness is another strategy to reach customers through their children.
5 Figure 3 describes the different communication channels used by selected French water authorities surveyed in February 20151 to reach their users following the installation of a
smart meter. The authorities typically used several methods of communication, most often in combination. Some of the information was aimed directly at customers, targeting all customers2, just new ones, or the whole community; other messages were aimed at
representatives of local authorities, such as mayors, who were used as a method of relaying the information to the target population.
CODAH: Communauté d’Agglomération Havraise; SEDIF: Syndicat des Eaux d’Ile de France; SMGC: Syndicat Mixte Garrigues Campagne.
Figure 3. Communication channels used by selected French water authorities to inform water users of the smart meter service
These messages informed users of the existence of the smart meter service, described practical ways of accessing it, and answered their most frequently asked questions concerning public health, subscription costs, and personal data and privacy protection. They also included arguments on the user benefits to be derived from this service (such as simplifying procedures or more accurate water bills). Flyers made the following arguments: “simplify your water consumption management. Control your consumption. Receive alerts in
the event of a leak” (CODAH); “to manage your water consumption: smart meters come to you. Smart meters: comfort and a wider range of services, with no additional cost to you! […] Saving more: reduced consumption allowing users to save money” (Mulhouse); “a range of benefits: better control of water consumption – a convenient and simple service […] Use less and reduce your water bill” (SEDIF); “You can control your water consumption in order to better manage it” (SMGC). Messages given through indirect communication depend on the
support: official web sites describe deeply the process, as for direct communication channel;
1 These water authorities have been selected after being designed by water experts as precursors in
France in the development of smart meters. There sizes are really diverse in terms of number of inhabitants and of districts: Metz is a small district with 30,000 subscribers; the SEDIF comprises 149 districts around Paris and 560,000 subscribers. The communication channels do not seem linked with these dimensions.
22 This channel is systematically adopted: authorities join to water bill a flyer informing subscribers on
the new service and the manner to connect to the customer application. Sometimes (for instance for SMGC), the information is resent few years later.
6 local press and radio simply the message, emphasing on the advantages for water users, and on the public health neutrality of this new technology; local meetings are organized at municipality level or at neighbourhood councils’ level usually during the evening to discuss directly with water users and reply to their question; sometimes Mayors pass the message during official events (like traditional New Year ceremony).
2.2 Favourable intentions: a prerequisite condition
Being informed about the existence of smart meters, their associated services and the potential benefits for individual users and the wider community, is not enough to encourage individuals to adopt this new technology. A change in behaviour is also dependant on users’ intention to take action based on their positive perceptions of the technology.
This intention step in the adoption process follows the theory of planned behaviour (Ajzen, 1991), which describes three factors that affect an individual’s likelihood of having favourable intentions (Figure 1):
1. Personal attitudes towards the behaviour, that is, the “inward disposition oriented more or
less favourably towards the targeted behaviour” (Barbier, 2013). With regards to smart
meters, attitudes towards both water and the technology itself must be analysed. User attitudes towards this new technology are indeed highly influenced by perceptions of the resource (water, the real object of consumption) itself, and their use of smart meters can be seen as just a means of improving water consumption. We can also assume that if a water user views smart meters as a threat to their individual freedoms, he or she will not adopt it. When mistrust or rejection are the primary attitudes towards smart metering, “the
innovation’s supporters need to start a process of “enlisting” water users in order to build interest in smart meters, through ethical, economic or environmental arguments” (Rego
Teixeira, 2014).
2. The subjective norm or perceived social pressure. “The more persuaded a user is that
others, and especially those who are personally meaningful to him, will expect him to adopt the intended behaviour, the more his intention to do so will be reinforced” (Barbier,
2013). That is why Lafaye et al. (2013) recommend “introducing smart meters as a
corporate purpose whose use is rewarding and can be claimed”. For instance, users
linked through social networks can share and speak about their smart meter experiences. 3. The perceived behavioural control, that is, the perceived difficulty of adopting the intended behaviour (again with regards to both water and the technology itself), which is affected by two conditions (Darby, 2010):
The user must feel able to control the new technology. Rego Teixeira (2014) highlights the importance of the support provided to users to help them
7 understand and learn to use their smart meter. She recommends paying particular attention to the communication format (messages) and channels service providers use to interact with users.
Users must then be able to translate the information provided by smart meters into actions aimed at changing their water consumption. Previous surveys conducted which looked at smart electricity meters emphasised the importance of householders’ ability to interpret smart meter readings if they were to take any further action towards reducing their energy consumption: “there is a clear need
for improving householders’ working knowledge (as opposed to ‘information’)”
(Darby, 2010). Indeed, previous studies show that individuals have limited cognitive abilities to analyse consumption data (Egan et al., 1996; Kempton and Layne, 1994), that is, to understand whether or not a certain level of consumption is normal compared with the average user, and know how to proceed in order to reduce water consumption (“turning off, using less, using more carefully,
improving performance, and replacement or use of alternative appliances”)
(Darby, 2010).
In such a situation, “the challenge is to elicit useful information from the [..] data that will be
available once smart metering is under way” (Darby, 2010). Anderson and White (2009),
Darby (2010) and Karjalainen (2011) describe the main functions that smart meter services should provide if they are to be correctly used and widely adopted. They recommend to “keep it simple” and to convey information in monetary terms (“everyone understands
money”). It is better favouring experiences over theoretical explanations (“a rate explained is complex; a rate experienced is intuitive”). Smart meters services should provide consumption
historical data to facilitate the detection of break in trend. And, if possible, they should allow analysing consumption at each consumption point.
To determine attitudes, in this article we use the social representation theory. This theory is based on the seminal work done by Durkheim (1898), who referred to ‘collective representations’, assuming that people share common perceptions of concepts that they transmit and reproduce. Moscovici (1961) went further, introducing the concept of social representation, which comes from the self-experimentation of each person (subject), as well as the social and ideological system that he or she is a member of. “Representations guide
us in collectively naming and defining the different aspects of our everyday reality, of interpreting and passing judgement on them and, when appropriate, of making a stand and defending them” (Jodelet, 1991). Abric (1976) asserts that social representation exists and is
8 characterised by coherence and stability, and which are thus resistant to change) and peripheral elements (with more personal components).
This social representation can be estimated using the hierarchical evocations method (Abric, 2003; Vergès, 1992) to highlight perceptions spontaneously expressed by people with regards to a specified concept. This method consists of asking respondents to give a defined number of words or groups of words (three in our case) that best illustrate their impression of the concept (for example “smart metering”), and to rank them in order of importance. Asking subjects to rank words or groups of words makes them self-producers and responsible for their own corpus treatment. There are therefore no subjective interpretations made by the interviewer.
This material is then analysed following two steps. First of all, concepts are evaluated in terms of the degree to which they are shared by the surveyed population. To assess occurrences, two indicators are calculated: the scarcity index and the diversity index. The scarcity index represents the proportion of words or groups of words cited only once. The diversity index measures the diversity of answers for each concept. These indexes are based on raw responses (that is, without having reduced the number of words or groups of words by grouping together terms with similar meanings). They are both between zero and one. The more they tend towards zero, the higher the consensus, and the more accurate the social representation.
The second step consists of constructing the social representation from the (three) words/groups of words generated for each concept. Thresholds have to be defined with a view to formulating and testing hypotheses (Table 1): according to Vergès (1992), if more than 10% of respondents associate a word or a group of words with a concept, this word represents a quantitative centrality. A qualitative centrality is arrived at by calculating the average weight of each word or group of words. In this way, words or groups of words perceived as important benefit from a high qualitative centrality.
Level of importance
High Low
Frequency of occurrence
High (≥ 10%) The core: quantitative and qualitative centrality area First perimeter
Low (<10%) Contrasting elements Second perimeter
Table 1. Analysis of hierarchical evocations
The combination of these two notions allows for the concept’s social representation to be characterised, by highlighting central elements that seem to be shared and considered as ranking highly in importance. In particular, the core can be compared with contrasting
9 elements, which were ranked highly but only by a minority of the respondents. This can reveal the existence of subgroups sharing an representation that differs significantly from that of the majority of the surveyed population (Zouhri and Weiss, 2014). Words less commonly shared or highly ranked, located in the first and second perimeters, complete the social representation.
3 Methodology and case study
A natural field experiment was conducted in a residential suburb of Montpellier, in the south of France, to explain the reasons for the low sign-up rate observed in the country.
The analysis is based on a sample of 261 households who were equipped with smart meters in January 2015. They were officially informed in June-July of the associated services available online: information on daily water consumption, and the possibility of setting up alerts which would generate an email or SMS in the event of over-consumption (hereafter referred to as the “information campaign”).
Special care was taken to provide this information by following the communication model’s recommendations and testing the two methods of individual communication that are generally assumed to be the most effective (post and face-to-face). Households were personally notified of this new (free of charge) service by the municipal authority in charge of the water supply (Montpellier Méditerranée Métropole, hereafter referred to as 3M) rather than the private water company operating the network and the meters (Veolia). Half of them were informed face to face (pilot group – the even-numbered houses), and the other half by letter (control group – the odd-numbered houses). No direct demonstration or help with registration were provided, but all of them received a leaflet explaining the smart metering service provided by 3M (presenting the device, detailing the practical steps required to use the smart meters’ associated services, and giving answers to the most frequently asked questions). The objective was to resolve the issues of lack of communication and householders’ inability to effectively manage this new technology.
At least 15 days after this information was provided to the control group (households informed by post), and immediately following the face-to-face meeting in the case of the pilot group, a household survey was conducted. The aim was to analyse the relationship between households and their water service (perception of water prices, computer skills, whether or not they currently paid their water bill through the website), identify social representations of water and smart meters, and collect household characteristics (size of household, housing type, socio-economic category, etc.). The underlying assumption was that significantly more
10 households in the pilot group would sign up for smart meter services than in the control group.
This survey used the social representation theory, as previously explained. To do so, respondents were asked to give three words or groups of words which best illustrate their conception of “water” (the object of consumption) and “smart metering”, and to rank them in order of importance. Since three words were elicited, a decision was made to assign a high rank only to the first word or group of words (i.e. <2) and a low rank to the last ones (i.e. low rank ≥2) to estimate the level of importance of this word for users (Table 1). A further question was asked which was not included in the hierarchical evocations method but which was used to help us better interpret the words given by respondents and prioritize them on a scale from -3 (word or groups of words perceived by the respondent as totally negative) to +3 (totally positive).
Thirty per cent of the 261 households were surveyed (60 living in a house, 17 in an apartment) (Table 2), with an average of 2-3 people living in each household. 27% of households surveyed lived in rented accommodation. 27% of those living in a house (78% of the total surveyed) watered their lawn, 20% watered vegetables in their garden, and 60% had a private swimming pool. Water from the public network was not the sole water source used to satisfy outdoor needs: 12% had installed a rainwater harvesting system and 33% had invested in a borehole. 31% of the respondents were currently retired, 47% were or had previously been managers and 31% were employees. The average age of each respondent was 54.
11
House Apartment Total
Households (number) 60 17 77
Household’s characteristics:
People per household (number)
Renters (proportion) 2.8 8% 94% 2.5 27% 2.7
Number (and proportion) of households that:
Water a lawn
Water a vegetable garden Have a swimming pool Harvest rainwater Have a borehole 16 (27%) 12 (20%) 36 (60%) 7 (12%) 20 (33%) Respondents’ characteristics: Age Occupational status Active Retired Other
Profession (current or previous) None Managerial position Business owners Intermediate profession Employee 56 57% 35% 8% 2% 57% 3% 13% 25% 50 65% 18% 18% 6% 12% 12% 18% 53% 54 58% 31% 10% 3% 47% 5% 14% 31%
Table 2. Characteristics of the surveyed population
The sample appears to be representative of the targeted population and its consumption (Figure 4).
12
Figure 4. Average daily water consumption per customer (in litres)
When divided by the number of inhabitants, the observed water consumption level is consistent with what is commonly observed in France: an average of 150 litres per inhabitant per day (Figure 5). There is also evidence of economies of scale, with household size having an impact on individual consumption levels (Figure 6)3.
3 Figure 6 shows only the water consumption data for those respondents living in a house, due to the
small amount of data collected for those living in an apartment. Figures must be treated with caution due to the size of the data on some groups.
13
Figure 5. Average daily water consumption per capita (in litres) for the household characteristics surveyed (the number in brackets refers to the number of observations)
Figure 6. Average daily water consumption per capita (in litres) by household size (those living in houses only) (the number in brackets refers to the number of observations)
14 Average water consumption is higher in houses (160 litres) than in apartments (100 litres per person). The difference is particularly noticeable during summer, when water is being put to outdoor use: those in apartments used on average 149 litres, while those in houses used 289 litres. Swimming pools appear to increase consumption only in summer, whereas boreholes decreased both summer and winter (albeit less so) consumption.
4 Results and discussion
4.1 A low registration rate
In order to activate the service, households need to register on the internet and set up alerts. The registration rate more than one month after the information campaign is still low, even if it is slightly higher than the rates seen in other French cities (5% instead of the 2% commonly observed in other French districts where the system is in use). Contrary to the initial hypothesis, there was no significant difference observed between the two modes of communication (four registrations as a result of face-to-face communication, and six as a result of postal). It is also worth noting that two households registered for this new service before having been informed (the service was activated a few months before being publicised to households).
This low rate does not seem linked to poor computer skills: on a scale of one to seven, only 27% of the respondents claimed to have poor computer skills (less than 4). It can therefore be assumed that users have the required skills to use this new technology, particularly since the leaflet explained step by step the procedure for registering for smart meter services. The reasons for this low registration rate have therefore to be found elsewhere. Let us now explore whether this could be due to negative social representations of this new device and its service, or the fact that households do not feel the need to save water (the object of consumption) or use it efficiently.
4.2 No unified social representation for the concepts “water” and “smart metering”
First of all, the aim is to identify whether perceptions of these concepts were shared by the households interviewed. Both concepts evoked a range of different responses (Table 3): 30% of words or groups of words were cited only once (scarcity index), while the number of different answers is also high, in particular for smart metering (diversity index). These findings can be interpreted as a lack of social representation. They can be explained by the fact that “water” can conjure up various images for various people, as it can provide them with a range of different day-to-day experiences (daily use, need, cost, even suffering in the case of flooding for instance, etc.) and produce a range of different associations (pleasure, biodiversity, purity, etc.). “Smart metering”, on the other hand, is not as well known, since it is
15 a relatively new device. This would explain why subjects may have greater difficulty associating it with other words or groups of words.
Scarcity index Diversity index
Calculation method
Number of answers cited only once Total number of answers
Number of different answers Total number of answers
Water 0.3 0.46
Smart
metering 0.36 0.52
Table 3. Scarcity and diversity indexes for water and smart metering
The difficulty in establishing a social representation is only partly confirmed by the second step of the analysis, conducted using the hierarchical evocations method, which we will turn to now.
4.3 “Smart metering” viewed in a positive light
“Water” was most specifically associated with “life” and “washing” (Table 4). With a low priority but high frequency, respondents connected water with “pleasure and/or relaxation”. Their prime concerns focused on water as an essential resource, and its potential to fulfil their basic needs, such as those surrounding food and health. Once these vital aspects are satisfied, notions of pleasure and relaxation appear. All these associations suggest a positive perception (the average ranking is higher than 2 on a scale of -3 to +3). The contrasting elements area casts water under a different light, with associations less positively oriented: reliance on it to satisfy basic needs (drink, food), thirst and water shortage. The second perimeter provides a larger number of associations connected to what water can do for us, but also its intrinsic characteristics and associated behaviours.
The core area reflects associations relating water to basic needs; other words are related to the problem of water preservation (‘water scarcity’, ‘reducing water waste’, ‘scarce and precious’) or its cost. At least 37% of the associations therefore refer to notions related to the need to save water or use it efficiently. It can thus be concluded that households are aware of the need to monitor their water consumption.
16
Words associated with water Frequency of
occurrence
Average
ranking Average scale
Core area
Life 12% 1.11 2.9
Washing 12% 1.81 2.7
First perimeter
Pleasure and/or relaxation 12% 2.42 2.2
Contrasting elements
Food and drink 9% 1.75 2.5
A need 7% 1.69 2.7 Thirst 2% 1.50 0.8 Liquid 1% 1.50 0.0 Water shortage 3% 1.86 -2.6 Second perimeter Nature 6% 2.46 1.8 Purity 5% 2.00 2.4 Freshness 5% 2.50 1.8 Water saving 4% 2.20 2.0 The environment 3% 2.57 1.9 Abundance 3% 2.17 1.0 Watering 2% 2.40 0.8
Scarce and precious 2% 2.00 1.4
Quality 1% 2.00 2.7
Drinking water 1% 2.00 2.3
Banal 0% 3.00 0.0
Water cost 4% 2.30 -1.8
Poor water quality (limestone content, unusual
taste/odour) 2% 2.50 -0.5
Flooding/pollution 1% 2.50 -3.0
Inequity of sharing 1% 2.00 -2.5
Waste 1% 2.50 -1.5
Less and less natural 0% 3.00 -2.0
Table 4. Social representation of water for households surveyed
“Smart metering” was spontaneously linked to positive associations (Table 5): useful, simple, improved consumption monitoring, allows for the detection of overconsumption or leaks in real time. The contrasting area reveals, as it did for water, a more nuanced view, pointing to the advantages (reduces water waste, improves bill management) but also the drawbacks for society (unemployment due to the fact that meter inspectors are no longer needed) or for the users themselves (need to be connected to the internet). Other negatives, such as being constantly monitored and feelings of distrust, are only mentioned in the second perimeter, by small numbers of respondents and with a low ranking.
17
Words associated with “smart metering” Frequency of occurrence
Average
ranking Average scale
Core area
Useful 18% 1.49 1.94
Alert (real-time, leakage or overconsumption) 13% 1.88 2.29
Improved consumption monitoring 11% 1.77 2.05
Simple 10% 1.95 1.58 Contrasting elements Water saving 4% 1.57 2.00 Bill management 1% 1.00 2.00 Effective 1% 1.50 2.00 Indifference 1% 1.50 2.00 Unemployment 4% 1.75 -3.00 Useless 3% 1.40 -1.60
A need to be connected to the internet 1% 1.00 -3.00
Second perimeter
Modernity 6% 2.00 2.00
Responsiveness 4% 2.25 2.00
Reassuring 4% 2.63 1.86
Control over consumption or leaks 4% 2.14 1.86
Communication 3% 2.50 0.75
Reliable 3% 2.60 0.80
A bill based on real consumption 2% 2.00 3.00
Autonomy 2% 2.67 0.67
Remotely 2% 2.67 0.33
Computerization 2% 2.33 0.33
Assistance 1% 2.00 3.00
Have to be paid by water manager 1% 2.00 3.00
Environmentally friendly 1% 2.00 1.50 Impersonal 1% 3.00 0.00 Website presentation 1% 3.00 0.00 Constant monitoring/“surveillance” 2% 2.67 -2.33 Communications’ technologies 1% 3.00 -1.50 Manipulation 1% 2.00 -3.00 Privatization 1% 2.00 -3.00 Expensive 1% 3.00 -3.00 Distrust 1% 3.00 -3.00
Table 5. Social representation smart metering for households surveyed
Water users appear to have a positive attitude towards smart metering, rather than a suspicious or hostile one (Figure 7). But there are many steps in the smart metering process (measurement, transfer of data, processing/analysis, and feedback, as classified by Boyle et al. (2013)) that can provoke concerns over health and privacy. The way that data is transmitted can lead to fears over health issues caused by the wireless technology
18 (electromagnetic waves) (Koehle, 2011). It can also be difficult to ensure that personal data is protected during the last three steps in the process, leading to hacked data or misuse4.
There has been a rise in the number of anti-smart meter groups active in various countries such as the UK, the USA and Australia, set up with the aim of defending the right to privacy and fighting against the “attack on Freedom, Privacy, and Big Brother’s Control of our Lives” (Koehle, 2011). In France, such groups started appearing with the introduction of the smart electricity meter (“Linky”) (Frasque, 2016; Leloup and Van Eeckhout, 2016), and since 2016 have even been active in some municipalities where they oppose water metering (though these did not exist at the time of the experiment). It is therefore a surprise to see such a positive (albeit spontaneously elicited) attitude towards this new technology: people do not see smart water meters as a threat to privacy.
Figure 7. Summary of findings concerning users’ attitude toward smart metering
4.4 Families with gardens and apartment renters more likely to register for smart meter services
A cluster analysis (using the Ward method) was carried out to make a typology of households in terms of their attitudes to smart water meters, and reveal which users are more likely to adopt the smart metering system. To do so, we linked the different ordered associations cited by respondents when asked to define smart metering on the one hand,
4 It is possible to overpass this problem, for instance by storing household measurements at home in a
private network and only allow water/energy authorities to collect aggregated data that impedes to discover house-level consumption patterns (e.g. shower activities, laundry …). Several movements are working in Europe to encourage (energy) regulators and policy-makers to guarantee privacy (Smart Grid Task Force, 2014. European distribution system operators for smart grids - Data Management: The role of Distribution System Operators in managing data, p. 21.). They propose for instance the creation of a “neutral market facilitator” which is an independent agency responsible to data management, transforming personal data into aggregate information transmitted to the water/energy authorities (Expert Group 1 Standards and Interoperability 2016. My Energy Data. European Smart Grids Task Force, p. 74.).
19 with the household characteristics which may influence perceptions of smart meters on the other hand. The following components were included (as active variables) in the analysis:
Words associated with “water” and “smart meter”, their rank and their intrinsic value (on a scale of -3 to +3);
Socio-demographic information relating to the respondent (gender, year of birth, occupational status and profession) and their household (size);
Characteristics of the property (type, and whether it had a lawn, vegetable garden, swimming pool or alternative water source such as a rainwater harvesting system or borehole);
Average water consumption (m3/month) (observed between January and July);
A dummy variable representing whether or not the respondent had read the letter (for households having been informed by post) before the survey;
A dummy variable representing whether or not the respondent uses the water company (Veolia) website to pay their bills;
A dummy variable representing whether not they are the member of the household in charge of paying water bills;
Their perceived level of computer skills;
Their perception of water bills in comparison to their income, and water prices compared to those associated with other services (telephone, electricity).
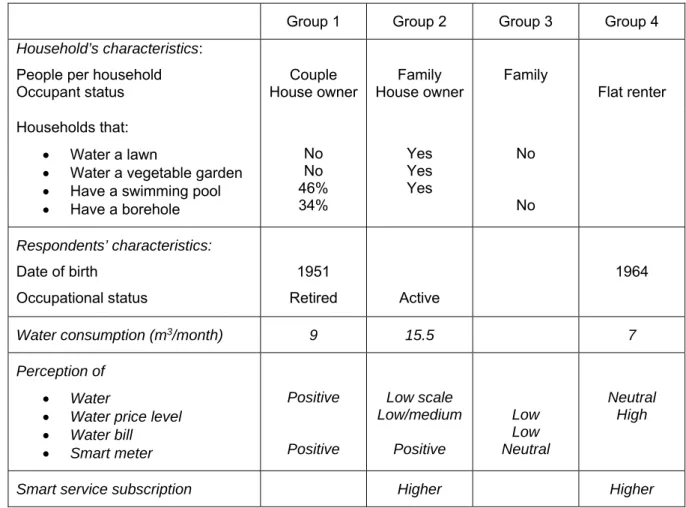
A hierarchical cluster analysis has been applied to the ten first axes of the multiple correspondence factor analysis (MCFA) identified as the most explanatory. This method allows all components introduced as active variables in the MCFA to be taken into account. In this case, the most relevant classification (by distinguishing words associated with “smart metering”) divides respondents into four classes (Table 6):
The first group is mainly composed of couples, who own their own house, are mostly retired, and have neither a lawn nor a vegetable garden. 46% of them had a swimming pool and 34% had a borehole. They consume on average 9 cubic metres per month, then lesser than the average (11). This is the group with the highest positive perception of water (2 on average). They often associate water with reducing waste, and none of them associated it with abundance. Smart metering is also positively perceived (1.25 on average) because it allows water consumption to be monitored (but not because it is easy to implement or improves communication).
The second group is composed of working families (made up of 3.7 people on average), who own their own house, and use water outside. They had the highest water consumption. They associate water with abundance. However, this group is also
20 composed of people who view water with a low scale level (1 on average compared with 1.7 for the entire surveyed population): 12% of the respondents associated water with words ranked as “-3”, that is, totally negative (for example, poor quality, flooding, cost and scarcity). Those who declared strong computer skills associated smart metering with simplicity and a means of facilitating communication. They judged the price of water as low or medium compared to other prices for similar services (such as electricity).
The third (small) group is made up of people who had difficulty relating three words to each item and were not able to scale them. These were families (made up of 3.1 people on average) without a lawn or borehole who considered either the price of water (compared to other services) or their water bill low.
The last group is composed of apartment renters. They consumed less than the average for the sample (on average 7 cubic metres per month, and 35% of them used only between 2 and 6 cubic metres per month). Respondents had not entered retirement, were primarily female, and stated that they had read the information letter. They were usually the person in charge of paying the household’s water bill and considered the price of water high compared with other prices for similar services. They often associated water with words ranked as 0 (on a scale between -3 to +3). Only the words “pleasure and/or relaxation” stand out when describing “water”. These respondents found it difficult to associate a third word with “smart metering”.
21
Group 1 Group 2 Group 3 Group 4
Household’s characteristics:
People per household
Occupant status House owner Couple House owner Family Family Flat renter Households that:
Water a lawn
Water a vegetable garden Have a swimming pool Have a borehole No No 46% 34% Yes Yes Yes No No Respondents’ characteristics: Date of birth Occupational status 1951 Retired Active 1964
Water consumption (m3/month) 9 15.5 7
Perception of
Water
Water price level Water bill Smart meter Positive Positive Low scale Low/medium Positive Low Low Neutral Neutral High
Smart service subscription Higher Higher
Table 6. Clustering results underlying the main characteristics of the four groups based on statistical tests
Two of the groups (2 and 4) were more likely to subscribe to the smart metering service. This corresponds to the heaviest (collective) water network users (families with gardens and strong computer skills) with the lowest income (apartment renters with low water consumption and estimating the price of water as high). A high water bill therefore seems to be a key element in explaining the low take-up rate for the smart metering service. However, the cluster analysis suggests that being informed about an unpredicted leak (which it is assumed affects all water users) is not a trigger of behaviour. Moreover, contrary to expectations based on the assumption that there will be “more water conservation if [people are more] more environmentally concerned” (Fielding et al., 2012), there has been no link found between respondents’ concern for the environment and the registration rate.
5 Conclusion
The smart water meter network is expanding. However, water users are not registering for related services, even where this could help them to better monitor and possibly reduce their water consumption, and detect leaks. This article has attempted to assess the reasons for this low adoption rate by conducting a natural field experiment in a residential suburb. Our
22 assumptions were that this rate would depend on two factors: to what extent users had been informed about the service, and whether or not they had favourable intentions of registering for it.
The first factor was controlled in the experiment by the chosen information channel (a personalised letter, sometimes with additional face-to-face communication). The second was controlled using different methods: the perceived behavioural control was assumed to be strong due to the leaflet detailing the registration process, as well as the high declared level of computer skills. Attitudes (and to a lesser degree, subjective norms) were analysed through a survey aimed at determining householders’ attitudes towards smart metering (and thus the new service) as well as water (which is the object of consumption).
The low adoption rate observed more than one month after the information campaign does not appear to be due to a negative opinion of smart metering, as most of the words related to this concept were positively oriented. It could therefore be linked to a lack of incentive, which only appears in the last step of the process (i.e. the behaviour itself): people don’t really fear the prospect of an unpredicted leak. In France there is a law (“Decree n° 2012-1078 of 24th
September 2012 concerning billing in the event of a water leak in a private residence after the water meter”) which protects water users by ensuring that they will not be billed for the water lost due to a leak as long as the household repairs the leak within a maximum period of one month from the date that they were informed about it by the water manager. This would explain the fact that the only situation where we observe a higher adoption rate is in households where the water bill represents a non-negligible part of their budget. Households then seem driven more by economic motivations than by risk insurance, which is already more or less taken into account elsewhere.
To conclude, the two first steps (providing information and creating favourable intentions) can be viewed as necessary conditions, but are not sufficient on their own to incentivise water users even to just become better informed of their water consumption. Therefore, the last step – “action” – also has to be well designed: there is a need to reinforce water users’ awareness of the critical importance of water conservation, following the hypothesis that “people have a disinclination to engage in pro-environmental behaviours because they have a knowledge deficit” (Seyranian et al., 2015). This reinforcement can also be achieved through incentives (such as time-of-day pricing) or by giving feedback (Schleich et al., 2013). For modellers, this study shows the importance of not focusing on economic motives alone (through a cost-benefit analysis) to model water demand, except when the services are viewed positively and their users are well informed. Modellers would then gain from
23 collaborating with those in the field of psychosocial sciences in order to better estimate their demand function.
Software and data availability
Three data bases are used in this article: a csv data base of water meter daily indexes for each subscriber provided by IBM, partner of the “Research and Development Project number 4” supported by Montpellier Méditerranée Métropole – PRD4; a xls data base informing on the customer registration provided by Veolia, partner of the PRD4; and a cvs data base built by the authors from data collected during the household survey.
Data bases and calculations were computed using R software ( ). Authors wrote their own scripts to calculate daily water consumption and social representations. Libraries ade4 and FactoMineR facilitated the cluster analysis.
Acknowledgements
This work was supported by Montpellier Méditerranée Métropole (Research and Development Project number 4 – PRD4), and by the –Agence Française pour la Biodiversité - AFB (Research project on the potential of smart meters to improve water management – Action number 72 of the Research Program Irstea-AFB 2016-2018”). The authors would like to thank Anne Morisse (CODAH), Philippe Espinel (SEDIF), Sophie Maïboroda (SEDIF), Benjamin Vacarie (SEDIF), Christian Moreno (SMGC), Joëlle Gaboriau (ville de Mulhouse), Serge Folegnani (Veolia) and Laurent Richard (Veolia) for sharing their insights on smart meters. Thanks also to Anne-Laure Collard (Irstea), Andrew Morris and Jean-Daniel Rinaudo (Brgm) for their in-depth reading and comments.
6 References
Abric, J.‐C., 1976. Jeux, conflits et représentations sociales. Université de Provence.
Abric, J.‐C., 2003. L’analyse structurale des représentations sociales, In: Moscovici, S., Buschini, F. (Eds.), Les méthodes des sciences humaines. Presses Universitaires de France: Paris, pp. 375‐392. Ajzen, I., 1991. The theory of planned behavior. Organizational Behavior and Human Decision Processes 50(2) 179‐211.
Anderson, W., White, V., 2009. Exploring consumer preferences for home energy display functionality. Centre for Sustainable Energy: Bristol, UK, p. 50. Barbier, R., 2013. Le consommateur d’eau : esquisse de portrait. Revue SET 10 28‐35. Boyle, T., Giurco, D., Mukheibir, P., Liu, A., Moy, C., White, S., Stewart, R., 2013. Intelligent Metering for Urban Water: A Review. Water. Capel, H., 2003. Faire parler les réseaux : le cas de l’eau, In: Schneier‐Madanes, G., de Gouvello, B. (Eds.), Eaux et réseaux ‐ Les défis de la mondialisation. Éditions de l’IHEAL: Paris, pp. 322‐344. Commission de Régulation de l'Energie, 2011. Dossier d’évaluation de l’expérimentation Linky, p. 32. Darby, S., 2010. Smart metering: what potential for householder engagement? Building Research & Information 38(5) 442‐457.
24 Davies, K., Doolan, C., Van Den Honert, R., Shi, R., 2014. Water‐saving impacts of smart meter technology: An empirical 5 year, whole‐of‐community study in Sydney, Australia. Water Resources Research 50(9) 7348‐7358.
Durkheim, É., 1898. Représentations individuelles et représentations collectives. Revue de Métaphysique et de Morale VI.
Egan, C., Kempton, W., Eide, A., Lord, D., Payne, C., 1996. How Customers Interpret and Use Comparative Graphics of Their Energy Use.
Expert Group 1 Standards and Interoperability 2016. My Energy Data. European Smart Grids Task Force, p. 74.
Fielding, K.S., Russell, S., Spinks, A., Mankad, A., 2012. Determinants of household water conservation: The role of demographic, infrastructure, behavior, and psychosocial variables Water Resources Research 48(10) W10510.
Fischer‐Lokou, J., Guéguen, N., Lépy, N., 2004. Effets de la communication par réseaux informatiques versus en face‐à‐face sur la représentation réciproque des négociateurs et leur prise de décision. Bulletin de Psychologie 57(5) 525‐533.
Frasque, H., 2016. Linky : faut‐il avoir peur des nouveaux compteurs ?, La Gazette: Montpellier, p. 14. Jodelet, D., 1991. L'idéologie dans l'étude des représentations sociales, In: Aesbischer, V., Deconchy, J.P., Lipiansky, R. (Eds.), Idéologies et représentations sociales. DelVal: Fribourg.
Karjalainen, S., 2011. Consumer preferences for feedback on household electricity consumption. Energy and Buildings 43(2–3) 458‐467.
Kempton, W., Layne, L.L., 1994. The consumer's energy analysis environment. Energy Policy 22(10) 857‐866.
Kendel, A., Lazaric, N., 2015. The diffusion of smart meters in France. A discussion of the empirical evidence and the implications for smart cities. Journal of Strategy and Management 8(3) 231‐244. Koehle, O., 2011. Just say no to big brother's smart meters ‐ The latest in bio‐hazard technology In: ACR Reproductions (Ed.): CA, USA, p. 155.
Lafaye, E., Vandenbroucke, S., Maresca, B., 2013. Les compteurs intelligents: vecteurs de changements comportementaux? Instruments de la maîtrise de la demande d’énergie, p. 95.
Lasswell, H.D., 1948. The structure and function of communication in society, In: Bryson, L. (Ed.), The communication of ideas: a series of addresses. Harper: New York, pp. 37‐51.
Leloup, D., Van Eeckhout, L., 2016. Faut‐il se méfier des compteurs Linky ? Le Monde.
Midden, C.J.H., Kaiser, F.G., Mac Calley, L.T., 2007. Technology's Four Roles in Understanding Individuals' Conservation of Natural Resources. Journal of social issues 63(1) 155‐174.
Moscovici, S., 1961. La psychanalyse, son image, son public. Presses Universitaires de France, Paris. Rego Teixeira, A., 2014. Le "smart‐metering" en Suisse romande : conditions sociales d'acceptation et d'appropriation, Faculté d'économie et de management. Université de Genève, p. 115.
Schleich, J., Klobasa, M., Gölz, S., Brunner, M., 2013. Effects of feedback on residential electricity demand—Findings from a field trial in Austria. Energy Policy 61 1097‐1106.
Seyranian, V., Sinatra, G.M., Polikoff, M.S., 2015. Comparing communication strategies for reducing residential water consumption. Journal of Environmental Psychology 41(0) 81‐90.
Smart Grid Task Force, 2014. European distribution system operators for smart grids ‐ Data Management: The role of Distribution System Operators in managing data, p. 21.
Tyszler, J., Bordier, C., 2013. Les compteurs électriques communicants : une meilleure gestion du réseau, un effet incertain sur la maitrise de la demande en énergie. PointClimat 31 1‐8.
Vergès, P., 1992. L'évocation de l'argent : une méthode pour la définition du noyau central d'une représentation. Bulletin de Psychologie 45 203‐209.
Zouhri, B., Weiss, K., 2014. Représentations sociales des pesticides et changements de pratiques chez les agriculteurs et étudiants français. Université de Nîmes/Aix‐Marseille, p. 42.