HAL Id: hal-01778293
https://hal-amu.archives-ouvertes.fr/hal-01778293
Submitted on 14 May 2018HAL is a multi-disciplinary open access archive for the deposit and dissemination of sci-entific research documents, whether they are pub-lished or not. The documents may come from teaching and research institutions in France or abroad, or from public or private research centers.
L’archive ouverte pluridisciplinaire HAL, est destinée au dépôt et à la diffusion de documents scientifiques de niveau recherche, publiés ou non, émanant des établissements d’enseignement et de recherche français ou étrangers, des laboratoires publics ou privés.
Dense and structured representations of U-Shape fibers
connectivity in the central sulcus
Alexandre Pron, Lucile Brun, Christine Deruelle, Olivier Coulon
To cite this version:
Alexandre Pron, Lucile Brun, Christine Deruelle, Olivier Coulon. Dense and structured representa-tions of U-Shape fibers connectivity in the central sulcus. IEEE International Symposium on Biomed-ical Imaging, Apr 2018, Washington DC, United States. �hal-01778293�
DENSE AND STRUCTURED REPRESENTATIONS OF U-SHAPE FIBER CONNECTIVITY
IN THE CENTRAL SULCUS
A.Pron, L.Brun, C.Deruelle, O.Coulon
Institut de Neurosciences de la Timone, UMR 7289, Aix-Marseille Université, CNRS, Marseille, France
ABSTRACT
U-shape fibers are superficial white matter fibers connecting adjacent gyri. In this paper, we present a method to characterize the connectivity of U-shape fibers coursing around the central sulcus. Pre- and post-central gyral crests are semi-automatically drawn and used to build a connectivity space that is identical between subjects. This group space provides a dense representation of the short-range connectivity between the two gyri, as well as a structured representation after clustering.
Index Terms— central sulcus, connectivity
1. INTRODUCTION
Although main fiber bundles of the brain have been intensively studied during the last ten years, less is known about superficial white matter and more precisely about short associations fibers. Recent technical progress in diffusion MRI, the modality commonly used to probe white matter, have made feasible to access the structure of these fibers. Few studies have investigated such fibers and most of them concentrate on the central sulcus area, a sulcus with little variability across subjects and a well-known functional organization [1], [2]. Such studies have tried to characterize the U-shape fibers connecting the pre- and post-central gyri around the central sulcus, either at the entire sulcus level, or locally based on predefined regions of interests (ROIs). In [3], tracks were selected from a whole-brain deterministic tractogram using nine ROIs in the pre-and post-central gyri. A similar approach was used in [4] with six ROIs. The connectivity between ROIs was assessed through fiber count, normalized by the white matter volume within each ROI. In [5], associations fibers are clustered into four categories at the whole brain level. Connectivity profile of these fibers was assessed with respect to drawn sulcus fundi and gyral crest and the connectivity of sharp U-shape fibers was assessed globally between gyri as the number of fibers connecting pairs of gyri. Recently, a clustering technique dedicated to short association fibers was introduced in [6] and used to build a specific atlas from seventy subjects.
1https://surfer.nmr.mgh.harvard.edu/fswki/
In this paper, we introduce a method to characterize the structure of U-shape fibers around the central sulcus in a local and continuous manner, providing a dense description of the U-shape fiber distribution, independent of any ROI-based seed. This distribution is characterized at the group level after extracting U-shape bundles and representing each tract as a point in a local connectivity space based on its extremities. This group-level connectivity space is defined from a parameterization of the pre- and post-central gyral crest lines.
This new representation not only provides a dense description of the short association fibers connecting both gyri but can also be clustered into bundles in order to provide a more structured description. The method was applied on the left central sulcus of ten subjects from the Human Connectome Project dataset.
2. MATERIAL AND METHODS 2.1. Dataset
Ten subjects from the publicly available Human Connectome Project dataset were used in this study. All individual were right-handed males aged of 25-30 years. Scans were acquired using a modified version of Siemens Skyra 3T scanner (Siemens, Erlangen, Germany) with a maximum gradient strength of 100mT/m, slew rate of 200T/m/s and a 32-channel head coil.
T1-weighted scans were acquired using 3D MPRAGE sequence (TR/TE=2400/2.14ms, flip angle=8°, FOV=224x224 mm², resolution=0.7 mm isotropic). Diffusion-weighted images were acquired using a spin-echo EPI sequence consisting of 3 shells (b=1000, 2000 and 3000 s/mm²) of 90 diffusion weighted volumes each and 6 interleaved non-weighted b0 volumes (TR/TE = 5520/89.5ms, resolution=1,25mm isotropic, FOV= 210x180mm², 111 axial slices, multiband factor=3, partial Fourier = 6/8, echo spacing=0.78ms). Each direction was acquired twice with reversed-phase encoding.
2.2. Preprocessing
T1-images were segmented using Freesurfer1 and imported
into Brainvisa2 to obtain grey/white matter interface meshes.
Diffusion-weighted scans were preprocessed using the
Diffuse toolbox3, an in-house Brainvisa toolbox [7] wrapping
FSL4 and Dipy [8] functions. Scans were corrected for subject
motion and susceptibility artefacts. Corrected diffusion images and T1-images were non-linearly registered, then the white matter meshes could be brought into the diffusion space. Local Multi Shell Multi Tissue (MSMT) model parameters were estimated in Mrtrix5. MSMT impulsionnal
response was first estimated for each subject using dhollander method [9] with default parameters. Whole brain deterministic tractography based on the MSTM model was performed using the Mrtrix SD_Stream algorithm [10] with the following parameters: 50 million seeds, random placement in grey and white matter volume, Runge-Kutta 4th
order integration, 45° angle, constrained by anatomical tissues and cropping at grey-white matter interface [11]. Resulting tractograms were filtered with the SIFT algorithm [12] .
2.3. Pre- and post-central gyrus crest lines delineation
The left pre-central and post-central gyral crest were drawn semi automatically onto each subject’s left white matter mesh using the SurfPaint module [13] in BrainVisa after manually choosing their end points (see Fig. 2). Each of the two lines was isometrically parametrized from the ventral to the dorsal extremity, such as to obtain a reference 1-D coordinate system [0-100], as described in [14].
2.4. Hand-knob alignement reparameterization
In order to provide a better correspondence of the pre- and post-central gyri across subjects than the simple [0-100] parameterization, we reparameterized both crest lines to enforce the matching of a specific structure, the hand-knob, following the same procedure as in [14]. The hand-knob is a part of the central sulcus with a characteristic inverted omega shape, known to locate the primary hand motor area reliably across subjects [2].
The location of the most posterior extension of the hand-knob was located manually on the white matter mesh of each individual. The plane orthogonal to the inertia plane of the central sulcus and passing through the hand-knob extension was computed. The pre-central and post-central hand-knob landmarks were then chosen as the closest vertex to this plane on each of the two crest lines.
These two landmarks were then forced the same coordinate across subjects following the procedure in [1]. Specifically, each crest line was reparameterized using the following affine transformation: 𝑖𝑓 0 ≤ 𝑦 ≤ 𝑦𝑖 𝑦𝑛𝑒𝑤=𝑦𝑚 𝑦𝑖 . 𝑦 𝑖𝑓 𝑦𝑖< 𝑦 ≤ 100 𝑦𝑛𝑒𝑤=100 − 𝑦𝑚 100 − 𝑦𝑖 . 𝑦 + 100 . 𝑦𝑚− 𝑦𝑖 100 − 𝑦𝑖
3https://github.com/MecaLab/Brainvisa-Diffuse 4https://fsl.fmrib.ox.ac.uk/fsl/fslwiki
Fig. 1. Schematic 2D representation of affine transform on a gyral crest line: subjects hand-knob coordinates 𝒚𝒊
and 𝒚𝒋 are transported to group mean hand-knob
coordinate 𝒚𝒎.
where 𝑦𝑖 is the hand-knob coordinate for subject 𝑖 and 𝑦𝑚 is the corresponding mean coordinate across subjects. After reparametrization, the hand-knob landmark has coordinate 𝑦𝑚 across all subjects (Fig. 1). Both pre-central and post-central crest lines are processed independently.
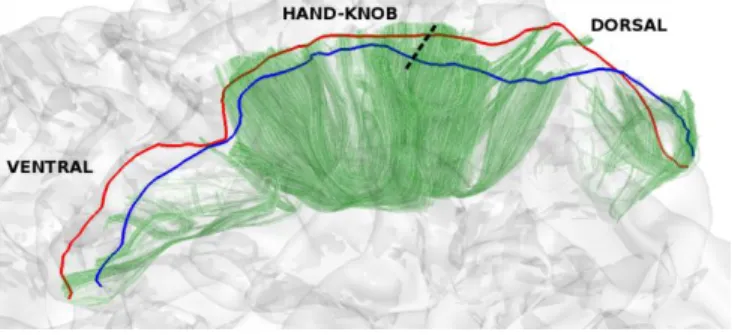
Fig. 2. Dorso-ventral view of one subject: pre- (red), post- (blue) central gyri crests and resulting U-shape streamlines (green) behind the left white matter mesh. Hand-knob position is marked with the dotted line.
2.5. Short U-shape fibers selection
U-shape fibers are connecting the pre- and post-central gyri, passing below the sulcus fundus. U-shape streamlines were selected from the whole tractogram as follows. If 𝑠 and 𝑒 are respectively the starting and ending vertices of a streamline in the tractogram, and 𝑑𝑠𝑝𝑟𝑒, 𝑑𝑠𝑝𝑜𝑠𝑡, 𝑑𝑒𝑝𝑟𝑒, 𝑑𝑒𝑝𝑜𝑠𝑡 the Euclidian distances between 𝑠 (𝑒) and the pre (post-) central gyral crestlines, then the selection conditions is expressed as:
𝑈𝑠ℎ𝑎𝑝𝑒𝑓𝑖𝑏𝑒𝑟𝑠= { 𝑓 ∈ 𝐹 / (𝑑𝑠𝑝𝑟𝑒< 𝑑𝑠𝑝𝑜𝑠𝑡) . (𝑑𝑒𝑝𝑟𝑒 > 𝑑𝑒𝑝𝑜𝑠𝑡) + (𝑑𝑠𝑝𝑜𝑠𝑡 ≤ 𝑑𝑠𝑝𝑟𝑒) . (𝑑𝑒𝑝𝑟𝑒 ≤ 𝑑𝑒𝑝𝑜𝑠𝑡) }
where 𝐹 stands for whole-brain tractogram, + and . stands for the OR and AND boolean operators. This first criterion insures that tracts are indeed going from one gyrus to another. In addition, tracks extremities (s and e) were associated with their respective closest mesh vertices. A geodesic distance map from the two gyral crest was then computed on the mesh. To insure only short U-shape streamlines connecting adjacent gyri are kept, a threshold of t =16 mm was set on the geodesic distance map. Streamlines whose closest vertices were further than t from the gyral crests were discarded, insuring that remaining streamlines go up in the gyri close enough to their crest line. This threshold was empirically found to include most fibers connecting the two gyri while removing spurious streamlines in the tractogram (Fig. 2.).
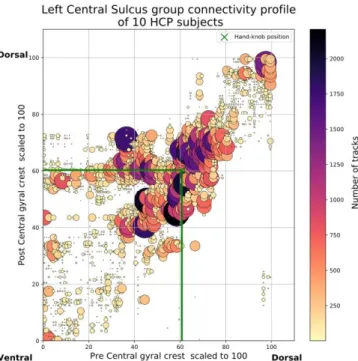
Fig. 3. Group connectivity profile into the dense group connectivity space. Each marker aggregates the streamlines over unitary bins to ease visualization. Size of the marker is proportional to the number of streamlines. Group hand-knob position is plotted by green cross.
2.6. Group connectivity space
Each U-shape fiber selected during the previous step is associated with the pre- and post-central coordinates corresponding to its extremities (closest vertices on the gyral crest lines). Therefore each streamline corresponds to a point in the [0;100]x[0;100] space defined by the parametrization (section 2.2), and hereafter called ‘group connectivity space’. Because the parameterization is common to all subjects, so is the group connectivity space, and all U-shape streamlines of
all subjects can be plotted in this space, with a total of 361241 streamlines for the ten subjects.
Fig. 4. Discrete and structured representation of group connectivity space achieved with k-medoids, k=5. Centroids are represented as orange dots, group hand-knob position is plotted by grey cross.
2.7. Fiber clustering
The group connectivity space provides a multi-subject, continuous representation of U-shape fibers. However, in order to get a structured and simplified representation of this space we then cluster the group connectivity space using the k-medoids [15] algorithm with 1000 initializations and 300 iterations each, to ensure clusters stability. The number of clusters was empirically set to k=5. In this way, fibers that have similar starting and end points are clustered together in bundles defined by the cortical areas they connect.
3. RESULTS AND DISCUSSION
We presented a method to study connectivity profile of U-shape association fibers underneath the central sulcus. We introduced a continuous square domain common to all subjects by parameterization of the pre- and post-central gyral crests. In this continuous domain, a U-shape fiber connecting the two gyri is represented by a point. This group connectivity space is presented in Fig. 3. We observed a group connectivity variable density along the central sulcus from the ventral to the dorsal extremities. The denser and most numerous connections represented by larger disks are essentially located near to the hand-knob position, i.e. in the [60;80]x[60;80] domain.
A dense but smaller connectivity is also observed in the dorsal area i.e. in the [90;100]x[90;100] domain, while we observed sparse connectivity in the ventral area i.e.
[0;40]x[0;40] domain. These observations are similar to the functionally coherent (hand, foot and face area) tracts obtained and confirmed by dissection in [3]. In addition, we observe connections between the ventral pre-central gyri and the middle part of the post-central gyri. It may correspond to an extension of face superior U-tract described in [3] but also to previously undetected fibers or tractography artefacts. This connectivity organization is confirmed by the clustering shown in Fig.4. Obtained clusters, three around the hand-knob area, one in the extreme ventral region and one in the extreme dorsal region define bundles that are similar to those described in [3].
By using a continuous parametric domain based on adjacent gyral crest lines, we provide a continuous description of structural connectivity along central sulcus without introducing priors by choosing region of interest location along sulcus. This method, applied on high diffusion data quality, suggests a discrete organization of the connectivity along the central sulcus which is coherent with the literature. However, we found some additional short-range associations connections that need to be further investigated.
Further work will concentrate on several points: the use of a micro-structure informed filtering method such as COMMIT [16] in order to reduce the number of biologically erroneous tracts and improve the quality of the tractogram; a study on a much larger group of subjects, such as the entire HCP900 database; and finally a groupwise clustering technique based on individual connectivity space representations in order to takes into account inter-subject variability. Finally, other sulci such as the temporal superior sulcus or the Calcarine sulcus.
4. ACKNOWLEDGEMENTS
Data were provided by the Human Connectome Project, WU-Minn Consortium (Principal Investigators: David Van Essen and Kamil Ugurbil; 1U54MH091657) funded by the 16 NIH Institutes and Centers that support the NIH Blueprint for Neuroscience Research; and by the McDonnell Center for Systems Neuroscience at Washington University.
A.P is supported by a grant from Aix-Marseille University.
5. REFERENCES
[1] O. Coulon, F. Pizzagalli, G. Operto, G. Auzias, C. Delon-Martin, and M. Dojat, “Two new stable
anatomical landmarks on the Central Sulcus: definition, automatic detection, and their relationship with primary motor functions of the hand,” in Engineering in
Medicine and Biology Society, EMBC, 2011 Annual International Conference of the IEEE, 2011, pp. 7795–
7798.
[2] T. A. Yousry et al., “Localization of the motor hand area to a knob on the precentral gyrus. A new
landmark,” Brain: a journal of neurology, vol. 120, no. 1, pp. 141–157, 1997.
[3] M. Catani et al., “Short frontal lobe connections of the human brain,” Cortex, vol. 48, no. 2, pp. 273–291, Feb. 2012.
[4] E. Magro, T. Moreau, R. Seizeur, B. Gibaud, and X. Morandi, “Characterization of short white matter fiber bundles in the central area from diffusion tensor MRI,”
Neuroradiology, vol. 54, no. 11, pp. 1275–1285, Nov.
2012.
[5] T. Zhang et al., “Characterization of U-shape
streamline fibers: Methods and applications,” Medical
Image Analysis, vol. 18, no. 5, pp. 795–807, Jul. 2014.
[6] C. Román et al., “Clustering of Whole-Brain White Matter Short Association Bundles Using HARDI Data,” Frontiers in Neuroinformatics, vol. 11, Dec. 2017.
[7] A. Pron, L. Brun, J. Sein, C. Deruelle, and O. Coulon, “Diffusion MRI: assessment of the impact of
acquisition and preprocessing methods using Brainvisa-Diffuse toolbox,” in NeuroFrance, Bordeaux, 2017. [8] E. Garyfallidis et al., “Dipy, a library for the analysis of
diffusion MRI data,” Frontiers in Neuroinformatics, vol. 8, Feb. 2014.
[9] T. Dhollander, D. Raffelt, and A. Connelly,
Unsupervised 3-tissue response function estimation from single-shell or multi-shell diffusion MR data without a co-registered T1 image. 2016.
[10] J.-D. Tournier, F. Calamante, and A. Connelly, “MRtrix: Diffusion tractography in crossing fiber regions,” International Journal of Imaging Systems and
Technology, vol. 22, no. 1, pp. 53–66, Mar. 2012.
[11] R. E. Smith, J.-D. Tournier, F. Calamante, and A. Connelly, “Anatomically-constrained tractography: Improved diffusion MRI streamlines tractography through effective use of anatomical information,”
NeuroImage, vol. 62, no. 3, pp. 1924–1938, Sep. 2012.
[12] R. E. Smith, J.-D. Tournier, F. Calamante, and A. Connelly, “SIFT: Spherical-deconvolution informed filtering of tractograms,” NeuroImage, vol. 67, pp. 298–312, Feb. 2013.
[13] A. Le Troter, D. Rivière, and O. Coulon, “An Interactive Sulcal Fundi Editor in BrainVisa,” presented at the 17th International Conference on Human Brain Mapping, Organization for Human Brain Mapping, 2011.
[14] C. Bodin, S. Takerkart, P. Belin, and O. Coulon, “Anatomo-functional correspondence in the superior temporal sulcus,” Brain Structure and Function, Jul. 2017.
[15] L. Kaufman and P. J. Rousseeuw, Eds., Finding
Groups in Data. Hoboken, NJ, USA: John Wiley &
Sons, Inc., 1990.
[16] A. Daducci, A. Dal Palu, A. Lemkaddem, and J.-P. Thiran, “COMMIT: Convex Optimization Modeling for Microstructure Informed Tractography,” IEEE
Transactions on Medical Imaging, vol. 34, no. 1, pp.