First International Conference on Bio-based Building Materials
June 22nd - 24th 2015 Clermont-Ferrand, France
BACTERIAL CALCIFICATION IN CEMENT PASTES AND MORTARS
CONTAINING MINERAL ADMIXTURES
Z. Bundur*, 1, R. Ferron2, M.J. Kirisits2 1
Ozyegin University, Department of Civil Engineering, Cekmekoy, 34794 Istanbul, Turkey. 2 The University of Texas at Austin, 301 East Dean Keeton Street, C1748, Austin, TX 78712, USA
*Corresponding author; e-mail: zeynep.basaran@ozyegin.edu.tr
Abstract
Recently, interest in using biomineralization for self-healing applications in cement-based materials has gained broader attention in the field. Biomineralization is a biochemical process in which microorganisms stimulate the formation of minerals, and in this particular case calcium carbonate (CaCO3). However, one of the main challenges in biomineralization applications for cement-based materials is that the cell death or insufficient metabolic activity to precipitate CaCO3 may occur when the cells are inoculated in the cement paste matrix. Concerns regarding the viability of the microorganisms within the restrictive and high pH environment of cement-based materials have led to researchers to propose incorporation of endospores rather than metabolically active (vegetative) cells or encapsulation of the endospores. However, a priori encapsulation of the microorganisms might be unnecessary, especially if the bacteria can form endospores. With the proper selection of bacteria and nutrient medium, vegetative microorganisms might also be able to survive for extended periods. This paper summarizes the results of a study undertaken to investigate the influence of vegetative bacteria, Sporosarcina
pasteurii (S. pasteurii), when it is incorporated with its growth medium in cement paste. In
addition the influence of incorporation of mineral admixtures (Limestone filler and C- type fly ash) on strength of biomineralized mortar was investigated. The efficiency of this vegetative inoculation approach was evaluated using thermogravimetric analysis (TGA), ethanol exchange porosity and compressive strength testing of the biomineralized mortars and metabolic state analysis of S. pasteurii cells by using the Most Probable Number (MPN). The results showed that the vegetative cells were able to induce CaCO3 within the cement paste, which led to a decrease in porosity and an increase in compressive strength. The increase in compressive strength was more pronounced when mineral admixtures were incorporated. Moreover, S.
pasteurii cells were found viable in mortar samples up to 330 days. Keywords:
Biomineralization, compressive strength, calcium carbonate, porosity, viability
1 INTRODUCTION
Factors affecting durability of concrete structures are generally associated with each other. A primary issue regarding concrete durability is surface cracks. These cracks can provide pathways for harmful chemicals to ingress, create durability problems and can lead to loss of structural integrity [Mehta 2006]. Common repair and restoration methods such as patching with shotcrete, applying various coatings and sealants require time and cost to repair cement-based structures, and in most cases immediate recovery is not possible. In addition, these conventional methods are generally suitable for large cracks. However, for small and deep cracks it will be difficult for the repair
agent to penetrate through the inner parts of the crack and provide full recovery in the system [Wang 2012]. Furthermore, depending on the structure access to the damaged regions may be difficult, or even impossible, to get to with external applications.
Recent research suggests that it might be possible to develop a bio-based cement-based material that can self-heal microscale cracks [Wang 2014; Wiktor 2011]. Self-healing is the ability of concrete to heal the cracks
without any external application. Use of
biomineralization is a novel technique to provide self-healing in cement-based materials. Biomineralization is a biochemical process in which microorganisms stimulate the formation of minerals [Mann 2001; Stocks-Fischer 1999; Mitchell 2006; Sarda 2009]. In this system, calcium carbonate (CaCO3) is induced by
leveraging the metabolic activity of microorganism and self-healing is obtained by sealing of the cracks with CaCO3 precipitate [De Muynck 2010; Ghosh 2005; Kumar 2011]. This system is also known as microbial induced calcium carbonate precipitation (MICCP) [Mann 2001].
Even though, biomineralization can be seen in nature, cement-based systems can be challenging due to their complex structure. One of the main challenges in biomineralization applications in cement-based materials is the restrictive environment (e.g., high pH, low nutrient concentrations), which might result in cell death or dormancy. Microorganisms can exist in either a viable (vegetative or endospore) state or dead state. It should be noted that only some microorganisms have the ability to form endospores. The mechanism
within the cement-based system is still open to
discussion. Bachmeier et al. has suggested that free urease enzyme could induce CaCO3 formation, if this is the case, the free urease enzyme might continue to induce precipitation even after the cell dies [Bachmeier 2002]. If the cell can survive within cement paste, one of possible viable state of the microorganisms is an “endospore”. Endospores are metabolically inactive state of microorganisms, which is formed under restrictive environment such as nutrient depletion, desiccation, and extreme temperatures [Buchanan 1974]. Endospores enable a bacterium to remain dormant for extended periods [Buchanan 1974]. At last, a viable bacterium can be at a vegetative cell, which is alive and metabolically active. However, vegetative cells are more sensitive to environmental stress than are endospores. Thus, the metabolic state of the cells within cement-based materials is crucial for biomineralization to occur.
Concerns regarding the viability of microorganisms in cement-based materials have led researchers to propose various techniques to encapsulate the microorganisms prior to inoculating them into cement paste matrix [Bang 2001; Bang 2010; Wiktor 2011; Jonkers 2010]. However, with the proper selection of microorganism, nutrients, and inoculation approach, the inoculated microorganisms might survive for extended periods without undertaking the extra processing steps needed for encapsulation. Achal et al. [Achal 2011] observed that microorganism could survive in fly-ash-modified mortar for 28 days when they were introduced a nutrient medium (i.e., water containing a carbon source and other nutrients) and then mixing the bacteria-nutrient-medium with cement. Use of mineral admixtures are commonly seen in typical concrete mixtures thus cement-based materials including mineral admixtures may have different physical and chemical properties such that their pore hydration kinetics may differ from material that do not include any mineral admixtures. This study evaluates the potential for inoculation of vegetative S. pasteurii cells as an internal admixture for pastes containing mineral admixtures. S. pasteurii is an endospore-forming, alkaliphilic bacterium and is the most commonly used microorganism for biomineralization applications in cement-based materials [De Muynck 2010]. Metabolic state of microorganisms was determined along with the TGA and compressive strength test to determine whether this approach was successful. The results of this study will provide an insight for future use of this biological admixture as a self-healing agent.
2 MATERIALS 2.1 Bacteria Growth
American Type Cell Cultures S. pasteurii (Miquel) Yoon et al. (ATCC® 6453TM) was used in this study [Yoon 2001]. The microorganisms were grown in a liquid Urea-Yeast Extract (UYE) medium that was prepared according to instructions for ATCC 1376 medium [ATCC 2014] and contained 0.13 M Tris base, 10 g of urea, and 20 g of yeast extract per liter of distilled deionized (DDI) water. 20 g of agar was added to a liter of liquid UYE medium when solid media was necessary. The pH of the medium was adjusted to 9. Then, the cells were grown aerobically at 30°C with shaking (150 rpm) in 600 mL of UYE medium. Over time, 1-mL sample aliquots were removed for optical density measurements at 600 nm (OD600) using a BioTek Synergy™ HT plate reader (Winooski, VT, United States) and used for viable plate counts on solid UYE-medium. A correlation between the OD600 readings and viable plate counts was established and this was used to determine the number of cells in proceeding cement paste and mortar mixing.
2.2 Cementitious Materials
Texas Lehigh Type I/II (Buda, TX) Portland cement was used for all cement paste and mortar mixtures. Table 1 shows the mass percentage distribution for oxides; Type I/II cement has 3.2% free lime content, and 77.3% of the free lime is calcium carbonate. Figure 1 shows the particle size distribution (PSD) of Texas Lehigh Type I/II Portland cement and the mean particle size of the cement (d50) was determined as 23.2 µm [Bundur 2015]. In selected mixes, cement was partially replaced by Limestone filler (LSF) and C- type Parish Fly Ash (C-FA). The oxide composition for C- FA is also shown in Table 1.
Tab 1: Oxide composition for Texas Lehigh I/II Portland cement [Texas-Lehigh 2009] and C type
Parish fly ash (% composition by weight). Oxides Texas Lehigh I/II Cement C-Type Parish Fly Ash CaO SiO2 65.0 20.5 27.5 33.1 Al2O3 4.5 18.1 Fe2O3 3.0 6.65 MgO 1.6 5.45 SO3 2.6 2.71 LOI 2.4 0.4 C3A 7.0 - Na2O Equivalent 0.79 2.11 Free Lime% 3.2 - 0 2 4 6 8 10 12 14 0.1 1 10 100 V ol um e of p ar tic le s (% ) Particle Size (µm)
2.3 Aggregates
For mortar samples Colorado River sand was used. The gradation of sand was determined according to ASTM C136 Standard Test Method for Sieve Analysis for Fine and Coarse Aggregate [ASTM 2006]. The fineness modulus of Colorado River sand was calculated as 2.37. According to ASTM C128-07 Standard Test Method for Density, Relative Density (Specific Gravity) and Absorption of Fine Aggregate [ASTM 2007], the absorption capacity of the sand and the specific gravity were determined as 0.65%, and 2.62 respectively. Figure 2 shows PSD for sand.
0 10 20 30 40 50 60 70 80 90 100 0.01 0.1 1 10 P er ce nt P as si ng ( % ) Sieve openning (mm) Fig. 2: PSD for Colorado River Sand 3 EXPERIMENTAL METHODS
3.1 Most Probable Number (MPN) Analysis Sample preparation:
Three different cement paste mortar samples were prepared for MPN analysis. A set of Neat mortar samples was prepared by mixing distilled water and cement. Nutrient mortar samples were prepared by mixing UYE medium and cement. For the Bacterial
mortar samples, the bacterial culture was mixed with
cement. The solution to cement ratio (s/c) for all mortars was 0.50 (w/w). The solution portion of the s/c ratio refers to the aqueous component used to prepare the paste and is considered a general term applicable to all the pastes. Thus, the solution portion for the Neat
mortar, Nutrient mortar, and Bacterial mortar are
distilled water, UYE medium, and the bacterial culture, respectively. For the Bacterial Mortar, the S. pasteurii concentration in the initial bacterial culture (Day-0) was determined by MPN method as 1x10⁶ MPN/mL. The MPN technique provides an estimate of the number of viable cells, which includes vegetative cells and endospores. The number endospores were determined by pasteurizing the samples at 80oC for 15 minutes. Thus, the vegetative (metabolically active) cell concentration in the initial bacterial culture was determined by subtracting the number of endospores from the number of viable cells. For the initial bacterial culture, 99.6% of the viable cells were found to be vegetative cells.
The sand to cement mass ratio was 1:4 for all mortar mixes. Neat Mortar, Nutrient Mortar and Bacterial
Mortar samples were prepared according to a modified
ASTM C305 Standard Practice for Mechanical Mixing of Hydraulic Cement Pastes and Mortars of Plastic Consistency [ASTM 2011].The ASTM C305 procedure was modified by replacing the mixing water with either UYE medium (for the Nutrient Mortar) or the bacterial culture grown in UYE medium (for the Bacterial
Mortar). For the Bacterial mortar, the bacteria were
cultured in UYE medium according to the procedure described in Section 2.1, and then the bacterial culture was mixed with cement and sand. Right after mixing, the mortar samples were cast into 5.08 x 5.08 cm cube molds. The specimens were initially cured at 100% relative humidity at room temperature (25 °C) for 24 h. Then the molds were removed, and the specimens were submerged in UYE medium- CaO until testing occurred.
To determine the viable and vegetative cell concentration for an older sample, a 330-day old sample was tested. The old set of sample was prepared by a bacterial culture with a S. pasteurii concentration of 2x10⁶ CFU/mL (1 x10⁶ CFU/g of cement). The samples were kept in UYE medium-CaO solution up to 56 days, and then samples were kept in water until the testing.
Viable and vegetative S. pasteurii concentration was enumerated via MPN analysis at 1, 7, 28 and 330 days after mortar mixing.
Experimental procedure:
At the time of testing, the samples were removed from their curing environment and then ground into a powder with a mortar and a pestle. The mortar and pestle were sterilized with ethanol prior to use. The powder was then suspended in fresh UYE-medium at pH 12 to minimize possible pH shock since an immediate change in pH may induce cell death. Then the resulting suspension was sonicated (MISONIX XL 2020 probe sonicator, Farmingdale, New York) for 2 minutes to release bound cells from the mortar substrate. The suspension was allowed to settle for 10 min, and the supernatant was transferred into a sterile tube and vortexed for 1 min. Similarly, the number endospores was determined by pasteurizing the samples at 80oC for 15 minutes and the vegetative cell concentration in the initial bacterial culture was determined by subtracting the number of endospores from the number of viable cells. Triplicate serial dilutions were prepared with UYE medium (pH 12) in test tubes. The tubes were incubated at 30°C for 3 days, and growth of the cells in the test tubes was monitored via OD600 after the incubation period was completed. Cell concentrations were estimated from the duplicate MPN values by statistical analyses [Sutton 2010].
3.2 Thermogravimetric Analysis (TGA) Sample preparation:
Three different cement paste samples were prepared for TGA. A set of Neat paste samples was prepared by mixing distilled water and cement. Nutrient paste samples were prepared by mixing UYE medium and cement. The solution to cement ratio (s/c) for all pastes was 0.50 (w/w). For the Bacterial paste, the S.
pasteurii concentration in the inoculum was estimated
to be 8 x 10⁶ CFU/mL. The samples were mixed by hand for 2 min. Following mixing, samples were cast in Φ1 cm x 3cm cylindrical molds. The samples were initially cured at 100% relative humidity at room temperature for 24 h. Then, the molds were removed, and the samples were submerged in UYE medium saturated with lime (CaO) solution until testing occurred. Duplicate mixes for each sample were prepared.
Experimental procedure:
At the time of testing, the samples were removed from the UYE medium- CaO curing. Immediately after removing the samples from the medium; they were crushed and pulverized such that they were finer than 53µm size. The powdered cement paste was ground with ethanol to stop hydration until it completely dried (Zhang & Scherer 2011). Prepared specimens were kept in a vacuum desiccator for 24 hours. TGA was conducted on the paste samples with Mettler Toledo TGA/DSC Analyzer (Schwerzenbach, Switzerland). The analysis was conducted by increasing the temperature from 40oC to 1200oC. Decomposition of calcium hydroxide (CH) was determined between
450oC-550oC and CaCO3 decarbonation was
measured between 700oC-900oC [Alarcon-ruiz 2005].
3.3 Ethanol Porosity Sample preparation:
For the ethanol exchange method, the mortar samples were prepared similar to the procedure stated in Section 3.1. For the analysis, Neat mortar and
Bacterial mortar samples were cast into Φ3 cm x 2 cm
small cylindrical molds. Similar to the previous procedures, the specimens were initially cured at 100% relative humidity at room temperature (25 °C) for 24 h. Then the molds were removed, and the specimens were submerged in UYE medium-CaO until testing occurred. The test was conducted on 7 and 28 day old samples.
Experimental procedure:
At the day of testing, the saturated samples were removed from the curing solution, immediately dried with a towel (into a SSD state) and weighed using a digital analytical balance (OHAUS Explorer digital scale, Parsippany, New Jersey). Then, the samples were fully submerged into ethanol. Periodically, the samples were removed from ethanol, dried to a SSD state, and weighed. The sample mass was recorded until the equilibrium mass was obtained. Porosity was calculated by considering the weight change and the specific gravities of pore water (SG: 1) and ethanol
(SG:0. 789). Triplicate samples were tested at each time period.
3.4 Compressive Strength Sample preparation:
Similar to MPN, three sets of mortar mixes were prepared for the compressive strength test. The S.
pasteurii concentration in the liquid culture used to
prepare this mortar was estimated to be 3 x 10⁶ CFU/mL. The Neat mortar, Nutrient mortar and
Bacterial mortar samples were prepared according to
the procedure stated in Section 3.1.
To investigate the influence of mineral admixtures on compressive of biomineralized mortar, 20% (by mass) of the cement was replaced with limestone filler (LSF) or Class C fly ash (C-FA) for selected mixes. In order to determine if the inoculated vegetative bacterial cells can compensate the reduction in compressive strength typically seen when these mineral admixtures are added, a weight replacement of cement content was preferred rather than addition to these minerals. Right after mixing, the mortar samples were cast into 5.08 x 5.08 cm cube molds. The specimens were initially cured at 100% relative humidity at room temperature (25 °C) for 24 h. Then the molds were removed, and the specimens were submerged in UYE medium- CaO until testing occurred. Compressive strength testing was conducted at 1, 7, 28, 56 and 90 days after the samples were mixed.
Experimental procedure:
At the day of testing, the samples were removed from the UYE medium-CaO curing. Then the samples were brought into saturated surface dry (SSD) condition by a towel. The Compressive strength test was conducted with triplicate samples at 1,7, 28, 56 and 90 days according to ASTM C 109/C 109M Standard Test Method for Compressive Strength of Hydraulic Cement Mortars (Using 2-in. or [50-mm] Cube Specimens) [ASTM 2009]. The loading rate was kept between 0.9 and 1.8 kN/s.
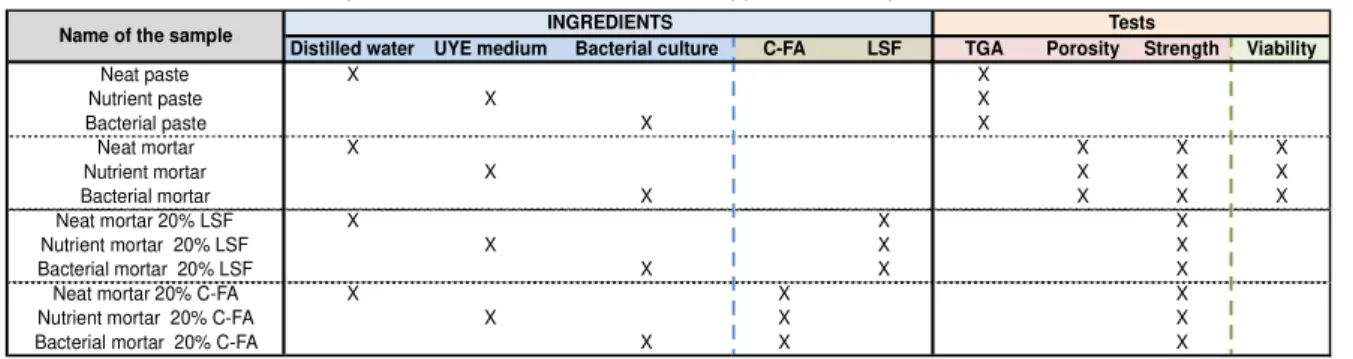
Table 2 below summarizes the mixes prepared and tests conducted for this work.
Tab. 2: Summary of mixes and tests; C-FA: C- Type Parish Fly Ash, LSF: Limestone filler
Distilled water UYE medium Bacterial culture C-FA LSF TGA Porosity Strength Viability
Neat paste X X Nutrient paste X X Bacterial paste X X Neat mortar X X X X Nutrient mortar X X X X Bacterial mortar X X X X Neat mortar 20% LSF X X X Nutrient mortar 20% LSF X X X Bacterial mortar 20% LSF X X X
Neat mortar 20% C-FA X X X
Nutrient mortar 20% C-FA X X X
Bacterial mortar 20% C-FA X X X
INGREDIENTS Tests
Name of the sample
4 RESULTS AND DISCUSSION
4.1 Viability of S. pasteurii within cement-based materials
Table 3 below summarizes the total viable and vegetative cells in Bacterial mortar sample. The viability percentage was obtained by dividing the viable cell concentration at time t by the viable cell concentration at time 0. The vegetative cell concentration was estimated by subtracting the endospore concentration from the total viable cell
concentration at time t and the vegetative cell percentage remaining was determined by dividing this value by the total viable cell concentration at time t. Control samples of the Nutrient mortar and Neat
mortar samples did not yield any detectable turbidity,
and the OD600 readings were close to UYE medium without any microorganisms. This means that if there were any microorganisms present, the concentration was lower than the detectable limit, 1x10² MPN/mL, and thus it could not be enumerated. As it is mentioned in Section 3.1, 99.6% of the viable cells were found to
be vegetative thus the quantity of endospores was negligible compared to the initial fraction of vegetative cells that were mixed in Bacterial mortar sample.
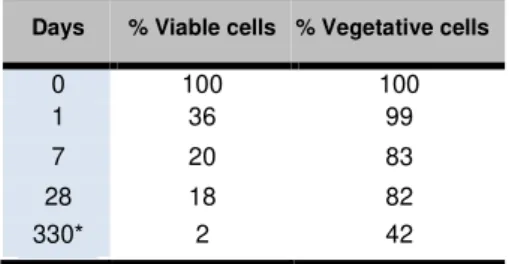
Tab.3: Estimated viable S. pasteurii viable and vegetative cell percentage of in Bacterial mortar.
Days % Viable cells % Vegetative cells
0 100 100
1 36 99
7 20 83
28 18 82
330* 2 42
* Note that the initial cell concentration for the 330-day
old sample was 2 x 10⁶ CFU/mL and samples were kept in water after a 56-dy lime-UYE medium curing. At Day-1, the total viable cell retention in Bacterial
mortar was determined as 36% and 99% of these
viable cells were found to be vegetative cells. Thus, the results suggest that the vegetative cells tend to die, rather than forming endospores. Similar trend was observed at Day-7, while the total viable cell retention decreased 20% and 83% of these viable cells were vegetative.
One of the key questions with respect to MICCP in cement-based materials is “what is the extended
period of viability of the bacteria within cement-based materials?” Compared to the 1% viability retention
seen at 4 months when endospores was used [Jonkers 2010] and the 0.1% viability after 28 days when vegetative B. megaterium was introduced in mortar [Achal 2011], the vegetatively inoculated S. pasteurii cells showed extended time period for viability. MPN analysis done on 330-days old Bacterial mortar showed that 2% of viable cell retention and approximately 42% of the total viable cells were vegetative cells (0.84% with respect to initial inoculum). This corresponds to 4 x10⁴ MPN/mL, which is a considerable number of cells especially considering that the samples were cured in water after 56 days and were not exposed to any additional nutrient sources (other than what was originally added) during this period.
4.2 Influence of S. pasteurii on CaCO3 content
within cement paste
TGA results indicated that there was a considerable increase in CaCO3 content at every age of testing in the Bacterial paste sample when compared to the Neat
paste and Nutrient paste samples. Figure 3 shows the
mass percentages of CH and CaCO3 calculated from the mass losses obtained from TGA. The values presented were obtained by averages of triplicates of samples and the error bars present standard deviations. Our studies have shown that calcite was the defined polymorph of CaCO3 obtained from all the cement paste samples tested in this study (Basaran Bundur et al. 2015).
At Day-1, there was a decrease in CH content in both
Bacterial paste and Nutrient paste samples compared
to Neat paste sample. Previously, our studies have shown that the induction period for both Nutrient paste and Bacterial paste samples were longer than the Neat
paste samples [Bundur 2015]. The initial setting time
was delayed with the addition of UYE medium to
Nutrient paste and this was particularly due to the
addition of yeast extract of the medium. Moreover, the presence of vegetative cells in the Bacterial paste
sample made the delay in initial setting more predominant [Bundur 2015].
The decrease in CH content in both Nutrient paste and
Bacterial paste samples might be attributed to this
extended induction period in hydration. In contrast, the opposite trend was observed in the CaCO3 content such the inoculated vegetative S. pasteurii cells improved the CaCO3 mass by 22% in the Bacterial
paste compared to the Neat paste.
At Day-7 the CH content in the Bacterial paste was slightly higher than the Day-1 Bacterial paste CH value. However, the Day-7 CH content in the Bacterial
paste was still considerably lower than the Day-7 Neat paste. No changes were seen in the Day-1 value of the
CH content of the Neat paste and Nutrient paste versus their Day-7 values. Compared to the Neat
paste, there was a 42% increase in the 7 day CaCO3 content of the pastes when bacteria was incorporated (i.e. compare the Bacterial paste with the Neat paste in Figure 3b). At both Day-1 and Day-7, the influence of UYE medium (i.e., the Nutrient paste sample) on CaCO3 content was substantially lower compared to bacterial culture (i.e., the Bacterial paste sample).
4 5 6 7 8 9 10 11 12 13 14 1 7 28 C al ci um H yd ro xi de m as s % Time (Days)
Neat paste Nutrient paste Bacterial paste
4 5 6 7 8 9 10 11 1 7 28 C al ci um C ar bo na te m as s (% ) Time (Days)
Neat paste Nutrient paste Bacterial paste
Fig. 3: (a) Calcium hydroxide (CH) content and (b) calcium carbonate (CaCO3) content in neat paste, nutrient paste and bacterial paste at 1, 7 and 28 days.
Bars show average, and error bars represent one standard deviation. A s/c of 0.50 was used.
Vegetative inoculation method provides extracellular carbonate ions due to hydrolysis of urea, thus when mixed with cement, S. pasteurii cells induced the CaCO3 precipitation. It should be noted that the influence of microorganisms on CaCO3 precipitation was particularly observed at Day-1. Although the CaCO3 content was higher in Bacterial paste sample compared to Neat paste and Nutrient paste samples at 28 days, the rate decayed and initial precipitation rate governed the total mass percentage of CaCO3 in 28 days.
4.3 Influence of S. pasteurii on porosity of cement-based materials
The ethanol porosity method aims to measure the porosity in terms of % volume by calculating the porosity from the mass change in mortar samples. The dry weight of the mortar samples was subtracted from the measured saturated weights and the % (v/v) porosity was calculated using the mass difference and SGethanol. Table 4 below summarizes the ethanol exchange porosity for Bacterial mortar and Neat mortar samples at Day-7 and Day-28.
Tab. 4: Ethanol Porosity Volume (%) of the Bacterial mortar and Neat mortar samples at 7 and 28 days (average ± st.dev %). Results presented are average
of triplicates of samples. Ethanol porosity (%)
Sample 7 days 28 days
Neat mortar 32 ± 4 20 ± 2
Bacterial mortar 25 ± 1 15 ± 2
Incorporation of vegetative S. pasteurii cells decreased the ethanol exchange porosity of Bacterial mortar by 21% compared to Neat mortar at Day-7 and by 24% compared to Neat mortar at Day28. Relationship between the porosity and viability might be a mutual balance such that an increase in pore space increased the retained vegetative cell concentration and it is these vegetative cells that are metabolically active and producing the CaCO3 that is reducing the porosity. The higher viable cell concentration and the vegetative cell percentage in the Bacterial mortar at Day-7 sample may be correlated to the relatively higher porosity of the Bacterial mortar samples at Day-7. Then the decrease in viability from Day-7 to Day-28 might be attributed to the decrease in porosity of the sample from Day-7 to Day-28.
4.4 Influence of S. pasteurii on compressive strength of mortar
Figure 4 displays the compressive strength test results for mortar samples. Figure 4a shows the influence of UYE medium on compressive strength of mortar with and without replacement of LSF and C-FA; and Figure 4a shows the effects of vegetative S. pasteurii cells on compressive strength of mortar with and without replacement of LSF and C-FA.
As shown in Fig. 4a, at Day-1, Nutrient mortar samples (i.e., Nutrient mortar, Nutrient mortar 20% LSF, and
Nutrient mortar 20% C-FA) displayed a lower
compressive strength than all the Neat mortar samples (i.e., Neat mortar, Neat mortar 20% LSF, and Neat
mortar 20% C-FA). As mentioned previously, this could
be attributed to the delay in the initial setting, which lead to a decrease in CH content [Bundur 2015]. Moreover, the compressive strength of Nutrient mortar was lower than Neat mortar at any day of testing (see Fig. 4a). This decrease was amplified when mineral admixtures were incorporated to the system. 20% LSF and 20% C-FA replacement lead to a considerable strength reduction in Nutrient mortar sample compared to Neat mortar sample, particularly after Day-7 (see
Nutrient mortar 20% LSF and Nutrient mortar 20%
C-FA samples in Fig. 4a).
Incorporation of vegetative S. pasteurii cells in the bacterial culture (i.e. Bacterial mortar in Fig 4b) also resulted in a decrease in the Day -1 strength compared to Neat mortar sample (see Fig. 4b). The compressive strength of Bacterial mortar was even lower than that of Nutrient mortar at Day-1. Even though, there was an
increase in CaCO3 content in the Bacterial paste compared to both Neat paste and Nutrient paste at
Day 1 (see Fig. 3b), the delay in hardening of the Bacterial mortar sample lead to lower strength
compared to Neat mortar and Nutrient mortar samples [Bundur 2015]. At Day-7, the presence of S. pasteurii cells, not only compensated the reduction in strength caused by the UYE medium; it also increased the compressive strength of Bacterial mortar above that of the Neat mortar. This could be partially attributed the greater amount of CaCO3 in the Bacterial paste compared to both Neat paste and Nutrient paste (see Fig. 3b) and reduction in the porosity of the Bacterial
mortar sample compared to Neat mortar sample (see
Tab. 4).
From Day-1 to Day- 7, the rate of strength gain was greater in the Bacterial mortar sample than the rate of strength gain in the Neat mortar and Nutrient mortar samples. However, at later ages, the rate of strength gain in the Bacterial mortar decreased, and the strength values were on par with Neat mortar and
Bacterial mortar by Day 56. The rate of strength gain
decreased slightly after 28 days, may be partly related to the changes in the viability of the bacteria in
Bacterial mortar. The total viable cell concentration
decreased to 20% at Day-28 and dropped to 2% at Day-330 (see Tab. 3). The compressive strength of
Bacterial mortar slightly decreased from Day-56 to
Day-90, which was not observed neither in Neat mortar and Nutrient mortar samples. Ramachandran et al. [Ramachandran 2001] noticed a similar phenomena and suggested that this could be due to degradation of killed cells in pore structure leading to a higher porosity compared to early ages.
The compressive strength of Bacterial mortar slightly decreased from Day-56 to Day-90, which was not observed neither in Neat mortar and Nutrient mortar samples. Ramachandran et al. [Ramachandran 2001] saw similar behavior and suggested that this could be due to a reduction in the porosity of the older mortars caused by degradation of killed cells in pore structure leading to a higher porosity compared to early ages.. As expected the compressive strength of all mortar samples decreased when 20% LSF was introduced to the mix. Previous researches have defined a 5% optimum addition of LSF to cement-based mixes. Above 5%, LSF may fill the interparticle voids that exist among the cement particles and the excess LSF behaves as a soft fine aggregate grain, reducing the strength of the material [Bederina 2011]. Particularly in this study, a weight replacement of cement content was preferred rather than addition to determine if the inoculated vegetative bacterial cells would be able to compensate for the reduction in compressive strength typically seen when LSF is added above the optimum level. As discussed previously, incorporation of bacterial cells increased the compressive strength in
Bacterial mortar compared to both the Neat mortar and Nutrient mortar at Day-7. With 20% LSF replacement,
the microorganisms were still able to compensate for the reduction due to the UYE medium (see Nutrient
mortar 20% LSF sample in Fig. 4a), and the
compressive strength of Bacterial mortar 20% LSF was on par with the Neat mortar 20% LSF (see Fig. 4b).
0 5 10 15 20 25 30 35 40 45 50 55 1 7 28 56 90 C om pr es si ve S tr en gt h (M P a) Days Neat mortar Nutrient mortar Neat mortar 20% LSF Nutrient mortar 20% LSF Neat mortar 20% C-FA Nutrient mortar 20% C-FA
0 5 10 15 20 25 30 35 40 45 50 55 1 7 28 56 90 C om pr es si ve S tr en gt h (M P a) Days Neat mortar Bacterial mortar Neat mortar 20% LSF Bacterial mortar 20% LSF Neat mortar 20% C-FA Bacterial mortar 20% C-FA
Fig. 4: (a) Influence of UYE medium on the compressive strength of mortar. (b) Influence of bacterial culture on the compressive strength of mortar. An s/c of 0.50 was used. LSF: Limestone filler;
C-FA: C type Parish Fly ash. Bars show the average compressive strength (based on triplicate mortar samples), and error bars represent one standard
deviation.
Another mineral admixture used in this study was a class C fly ash. As it was expected the influence of fly ash was noticeable at Day-28 in Bacterial mortar and
Neat mortar samples, however there was not any
strength increase in Nutrient mortar 20% C-FA compared to Nutrient mortar sample even after 90 days. Similar to the behavior observed in the mortars containing LSF, inoculated vegetative cells in Bacterial
mortar 20% C-FA were able to compensate for the
reduction due to the use of UYE medium (Nutrient
mortar 20% C-FA), but they could not increase the
strength of Bacterial mortar 20% C-FA sample to that of the Neat mortar 20% C-FA. Similarly, Achal et al. [Achal 2011] suggested that the influence of microorganisms on fly ash amended mortar and concrete decreased with increasing fly ash content [Achal 2011]. The authors showed that at 28 days, the increase in the compressive strength of bacterial mortar was 21% compared to neat mortar without any fly ash, however this rate decreased to 14% when 20% F type fly ash was incorporated to both mortar samples. Similarly Day et al. [Day 2002] has suggested that in MICP applications for crack remediation, neither lime nor fly ash were effective materials in improving stiffness of the mortar after cracking compared to polyurethane membranes. This was postulated due to the higher porosity of polyurethane membranes compared to lime and fly ash fly ash. This increased access to nutrients enhanced
the growth of the bacteria, thus leading to a higher CaCO3 precipitation [Day 2002]. Similar to LSF, 20% C-FA replacement tends to decrease the porosity and permeability of Bacterial mortar. From Figures 4a and b, it can be seen that in general the addition of the mineral admixtures did not adversely affect the structural development of the bacterial mortar and that if the strength behavior of the bacterial mortar containing the mineral admixture was similar to the neat mortar containing the mineral admixture that it is likely due to the nutrient media (i.e. for example, compare the compressive strength of Neat mortar,
Nutrient mortar 20% LSF in Figure 4). 5 CONCLUSION
In the presented study, it was seen that when vegetative cells were directly added to cement paste, some of the inoculated cells died, and some remained in a vegetative (i.e., metabolically active) state. 2% of the inoculated vegetative S. pasteurii cells were found viable in mortar that was 330-days old, while 42% of these cells were vegetative; to our knowledge, this is
the longest survival period recorded for
microorganisms in cement-based materials without a
priori encapsulation. TGA showed a substantial
increase in CaCO3 content when vegetative cells were incorporated into cement paste. Results obtained from ethanol exchange porosity and the compressive strength test showed that vegetatively inoculated S.
pasteurii cells reduced the porosity and increased the
strength of the mortar; this influence appears to be related to the viable cell concentration, particularly vegetative cell percentage.
6 ACKNOWLEDGEMENT
Authors acknowledge Sungwoo Bae for his contirbution to the microbiological experiments.
7 REFERENCES
[Achal 2011] Achal, V.; Pan, X. ; Özyurt, N.; Improved strength and durability of fly ash-amended concrete by microbial calcite precipitation. Ecological Engineering, 2011, 37, 4, 554–559.
[Alarcon-ruiz 2005] Alarcon-ruiz, L.; Platret, G.; Massieu,E.; Ehrlacher, A.; The use of thermal analysis in assessing the effect of temperature on a cement paste. Cement and Concrete Research, 2005, 35, 609–613.
[ASTM 2007] ASTM Standard C128-07a: Standard Test Method for Density , Relative Density (Specific Gravity), and Absorption. ASTM International, 2007, West Conshohocken.
[ASTM 2009] ASTM Standard C 109/C 109M: Standard Test Method for Compressive Strength of Hydraulic Cement Mortars (Using 2-in. or [ 50-mm] Cube Specimens). ASTM International 2009, West Conshohocken.
[ASTM 2006] ASTM Standard C136-06: Standard Test Method for Sieve Analysis of Fine and Coarse Aggregates. ASTM International, 2006, West Conshohocken.
[ASTM 2011] ASTM Standard C305-11: Standard Practice for Mechanical Mixing of Hydraulic Cement Pastes and Mortars. ASTM International, 2011, West Conshohocken.
[ATCC, 2014] ATCC medium: 1376 Bacillus pasteurii
NH4-YE medium, ATCC, 2014.
[Bachmeier 2002] Bachmeier, K.L.; Williams, A.E.; Warmington, J.R.; Bang, S.S.; Urease activity in microbiologically-induced calcite precipitation. Journal
of biotechnology, 2002, 93, 2, 171–81.
[Bang 2010] Bang, S.S.; Lippert J.J; Yerra, U; Mulukutla, S. et al.; Microbial calcite, a bio-based
smart nanomaterial in concrete remediation.
International Journal of Smart and Nano Materials,
March 2010, 1, 1, 28–39.
[Bang 2001] Bang, S.S.; Galinat, J.K.; Ramakrishnan, V.; Calcite precipitation induced by polyurethane-immobilized Bacillus pasteurii. Enzyme and microbial
technology, 2001, 28, 4, 404–409.
[Bundur 2015] Basaran Bundur, Z.; Kirisits, M.J.; Ferron, R.D.; Biomineralized cement-based materials: Impact of inoculating vegetative bacterial cells on hydration and strength. Cement and Concrete
Research, January 2015, 67, 237–245.
[Bederina 2011] Bederina, M.; Makhloufi, Z.; Bouziani, T.; Effect of Limestone Fillers the Physic-Mechanical Properties of Limestone Concrete. Physics Procedia, 2010, 21,28–34.
[Buchanan 1974] Buchanan, R.E.; Gibbons, N; Cowan, S.; Holt, J.G. Bergey’s Manual of Determinative
Bacteriology. 8th Edition, 1974,The Williams& Wilkin
Company.
[Day 2002] Day, J.L.; Ramakrishnan, V.; Bang, S.S.; Microbiologically induced sealant for concrete crack remediation,2002,1-8.
[Ghosh 2005] Ghosh, P.; Mandal, S.; Chattopadhyay, B.D.; Pal, S.; Use of microorganism to improve the strength of cement mortar. Cement and Concrete
Research, 2005, 35, 1980 – 1983.
[Jonkers 2010] Jonkers, H.M.; Thijssena, A.; Muyzerb, G; Copuroglu,O; Application of bacteria as self-healing agent for the development of sustainable concrete.
Ecological Engineering, 2010, 36, 2, 230–235..
[Kumar 2011] Kumar R. V.; Bhuvaneshwari, B.; Maheswaran, S.; Palani, G. S. et al.; An overview of techniques based on biomimetics for sustainable development of concrete. Current Science, 2011 101, 6, 741–747.
[Mann 2001] Mann, S.; Biomineralization: Principles
and Concepts in Bioinorganic Materials Chemistry.
2001, Oxford, New York.
[Mehta 2006] Mehta, P.K.; Monteiro, P.J.M.; Concrete:
microstructure, properties and materials. 3rd Edition,2006, McGraw-Hill, New York.
[Mitchell 2006] Mitchell, A.C.; Ferris, F.G.; The Influence of Bacillus pasteurii on the Nucleation and Growth of Calcium Carbonate. Geomicrobiology
Journal, 2006, 23, 213–226.
[De Muynck 2010] De Muynck, W.; De Belie, N.; Verstraete, W.; Microbial carbonate precipitation in construction materials : A review. Ecological Engineering, 2010, 36,118–136.
[Ramachandran 2001] Ramachandran, S.K.;
Ramakrishnan, V.; Bang, S.S.; Remediation of Concrete Using Micro-Organisms. ACI Materials
Journal, 2001, 98, 3–9.
[Sarda 2009] Sarda, D.; Choonia, H. S.; Sarode, D. D.; Lele, S. S.; Biocalcification by Bacillus pasteurii urease : a novel application. Journal Of Industrial
Microbiology, 2009, 36, 1111–1115.
[Stocks-Fisher 1999] Stocks-Fischer, S.; Galinat, J.K.; Bang, S.S.; Microbiological precipitation of CaCO 3.
Soil Biology and Biochemistry, 1999, 31, 1563–1571.
[Sutton 2010] Sutton, S.; The Most Probable Number Method and Its Uses in Enumeration, Qualification, and Validation. Journal of Validation Technology, 2010, 16, 3, 35–38.
[Texas-Lehigh 2009]. Texas - Lehigh Type I/II Cement, Texas-Lehigh Cement Company, 2009, Buda, TX. [Wang 2012] Wang, J.; Tittelboom, K. V.; De Belie, N; Verstraete, W; Use of silica gel or polyurethane immobilized bacteria for self-healing concrete.
Construction and Building Materials, 2012, 26,1, 532–
540.
[Wang 2014] Wang, J.Y.; Snoeck, D.; Vlierberghe, S. V.; Verstraete, W et al.; Application of hydrogel encapsulated carbonate precipitating bacteria for approaching a realistic self-healing in concrete.
Construction and Building Materials, 2014, 68, 110–
119.
[Wiktor 2011] Wiktor, V.; Jonkers, H.M.; Quantification of crack-healing in novel bacteria-based self-healing concrete. Cement and Concrete Composites, 2011, 33,763–770.
[Yoon 2001] Yoon, J. H.; Lee, K. C.; Weiss, N. ; Kho, Y. H. et al.; Sporosarcina aquimarina sp. nov., a bacterium isolated from seawater in Korea, and transfer of Bacillus globisporus (Larkin and Stokes 1967), Bacillus psychrophilus (Nakamura 1984) and Bacillus pasteurii (Chester 1898) to the genus Sporosarcina as Sporosa. International journal of
systematic and evolutionary microbiology, 2001, 51,
1079–86.
[Zhang 2011] Zhang, J.; Scherer, G.W.; Comparison of methods for arresting hydration of cement. Cement