HAL Id: hal-02417469
https://hal.sorbonne-universite.fr/hal-02417469
Submitted on 18 Dec 2019
HAL is a multi-disciplinary open access
archive for the deposit and dissemination of
sci-entific research documents, whether they are
pub-lished or not. The documents may come from
teaching and research institutions in France or
abroad, or from public or private research centers.
L’archive ouverte pluridisciplinaire HAL, est
destinée au dépôt et à la diffusion de documents
scientifiques de niveau recherche, publiés ou non,
émanant des établissements d’enseignement et de
recherche français ou étrangers, des laboratoires
publics ou privés.
Micro-Vasculature
Rachel E. Climie, Antonio Gallo, Dean S. Picone, Nicole Di Lascio, Thomas
T. Van Sloten, Andrea Guala, Christopher C. Mayer, Bernhard Hametner,
Rosa Maria Bruno
To cite this version:
Rachel E. Climie, Antonio Gallo, Dean S. Picone, Nicole Di Lascio, Thomas T. Van Sloten, et al..
Measuring the Interaction Between the Macro- and Micro-Vasculature. Frontiers in Cardiovascular
Medicine, Frontiers Media, 2019, 6, pp.169. �10.3389/fcvm.2019.00169�. �hal-02417469�
doi: 10.3389/fcvm.2019.00169
Edited by: Isabella Sudano, University Hospital Zürich, Switzerland Reviewed by: Damiano Rizzoni, University of Brescia, Italy Belen Ponte, Geneva University Hospitals (HUG), Switzerland *Correspondence: Rachel E. Climie [email protected]
Specialty section: This article was submitted to Hypertension, a section of the journal Frontiers in Cardiovascular Medicine Received: 17 September 2019 Accepted: 07 November 2019 Published: 22 November 2019 Citation: Climie RE, Gallo A, Picone DS, Di Lascio N, van Sloten TT, Guala A, Mayer CC, Hametner B and Bruno RM (2019) Measuring the Interaction Between the Macro- and Micro-Vasculature. Front. Cardiovasc. Med. 6:169. doi: 10.3389/fcvm.2019.00169
Measuring the Interaction Between
the Macro- and Micro-Vasculature
Rachel E. Climie
1,2,3*, Antonio Gallo
4,5, Dean S. Picone
3, Nicole Di Lascio
6,
Thomas T. van Sloten
1,7, Andrea Guala
8, Christopher C. Mayer
9, Bernhard Hametner
9and
Rosa Maria Bruno
11INSERM, U970, Paris Cardiovascular Research Center (PARCC), Paris Descartes University, Paris, France,2Baker Heart
and Diabetes Institute, Melbourne, VIC, Australia,3Menzies Institute for Medical Research, University of Tasmanian, Hobart,
TAS, Australia,4Cardiovascular Prevention Unit, Department of Endocrinology and Metabolism, Pitié-Salpêtrière Hospital,
Paris, France,5Laboratoire d’imagerie Biomédicale, INSERM 1146 - CNRS 7371, Sorbonne University, Paris, France, 6Institute of Clinical Physiology, National Research Council, Pisa, Italy,7Cardiovascular Research Institute Maastricht and
Department of Internal Medicine, Maastricht University Medical Centre, Maastricht, Netherlands,8Department of Cardiology,
Hospital Universitari Vall d’Hebron, Vall d’Hebron Institute of Research, Barcelona, Spain,9AIT Austrian Institute of
Technology GmbH, Center for Health & Bioresources, Biomedical Systems, Vienna, Austria
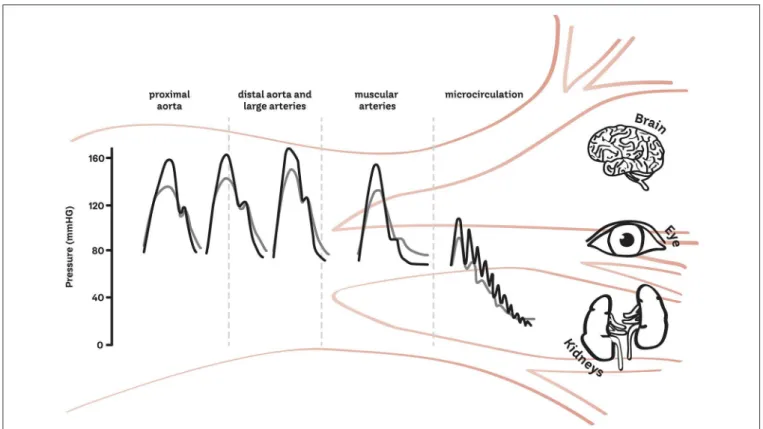
Structural and functional dysfunction in both the macro- and microvasculature are
a feature of essential hypertension. In a healthy cardiovascular system, the elastic
properties of the large arteries ensure that pulsations in pressure and flow generated by
cyclic left ventricular contraction are dampened, so that less pulsatile pressure and flow
are delivered at the microvascular level. However, in response to aging, hypertension,
and other disease states, arterial stiffening limits the buffering capacity of the elastic
arteries, thus exposing the microvasculature to increased pulsatile stress. This is thought
to be particularly pertinent to high flow/low resistance organs such as the brain and
kidney, which may be sensitive to excess pressure and flow pulsatility, damaging capillary
networks, and resulting in target organ damage. In this review, we describe the clinical
relevance of the pulsatile interaction between the macro- and microvasculature and
summarize current methods for measuring the transmission of pulsatility between the
two sites.
Keywords: methods, microvascular, macrovascular, wave intensity analysis, brain, kidney, retina
INTRODUCTION
High blood pressure (BP; hypertension), is the leading modifiable risk factor for the global
burden of disease (
1
) and accounts for 9.4 million deaths worldwide each year (
2
), mostly
due to cardiovascular disease (CVD) (
3
). Associated with raised BP is structural and functional
dysfunction in both the macro- and microvasculature. In the macrovasculature this manifests
as an increase in intima–media thickness (IMT) (
4
–
7
), accompanied by lumen enlargement
(
5
–
7
) and increased stiffness in proximal elastic arteries (
8
) but not in distal muscular arteries
(
4
–
6
). In the microvasculature, vasoconstriction, eutrophic remodeling (characterized by increased
media-to-lumen ratio or wall-to-lumen ratio with no change in cross-sectional wall area) (
9
),
alterations in distensibility, decreased vasodilatory reserve and rarefaction are evident in those with
essential hypertension (
10
–
12
). Such changes in the vessels are likely to play a contributory role to
hypertension-related organ damage and elevated CVD risk.
In a healthy cardiovascular system, the elastic properties of
the large arteries ensure that pulsations in pressure and flow
generated by cyclic left ventricular contraction are dampened,
so that less pulsatile pressure and flow are delivered at the
microvascular level. However, in response to aging (
13
,
14
),
hypertension and other disease states such as dyslipidemia
and diabetes mellitus (
15
,
16
), arterial stiffening limits the
buffering capacity of the elastic arteries, thus exposing the
microvasculature to increased pulsatile stress (
17
,
18
). This
is thought to be particularly pertinent to high flow/low
resistance organs such as the brain and kidney, which may
be sensitive to excess pressure and flow pulsatility, damaging
capillary networks and resulting in target organ damage (
19
–
24
) (Figure 1). However, to our knowledge, few studies (
25
–
27
) have examined the macro- and micro-vasculature directly
to determine whether there is transmission of pulsatility.
This is an opportunity for future work as understanding
the interaction between the macro- and microvasculature
will provide targets for future treatment and management
strategies aimed at limiting the pulsatility transmission to target
organs, thus reducing target organ damage and ultimately
improving clinical outcomes. In this review, we describe the
clinical relevance of the pulsatile interaction between the
macro- and microvasculature and summarize current methods
for measuring the transmission of pulsatility between the
two sites.
FIGURE 1 | Schematic of the transmission of pulsatility from the macro to the micro-vasculature. The gray line represents the healthy vasculature and the black represents the increase in pressure and pulsatility which may occur with age or in disease states.
CLINICAL RELEVANCE OF THE
PULSATILE INTERACTION BETWEEN THE
MACRO- AND MICRO-VASCULATURE
The function of the aorta is to receive blood from the left ventricle
and supply it to the systemic circulation. The proximal aorta
achieves this by expanding during systole, which is made possible
due to the highly elastic wall structure. The reservoir effect of the
aorta allows a portion of the stroke volume ejected during systole
to be temporarily stored and then propelled to the systemic
circulation during diastole via recoil of the elastic arterial wall.
Otherwise known as the Windkessel effect, this allows the aorta
to provide continuous blood flow to the systemic circulation
throughout the cardiac cycle and ensures the pulsatility of flow
is reduced by the buffering effect of the reservoir (
18
). However,
this reservoir function is highly dependent on (a) the stiffness
and (b) the geometry of the arteries (
28
,
29
), and is reduced in
disease states.
(a) Arterial stiffness refers to the level of arterial compliance
and vessel wall properties. A stiffer aorta will have a reduced
reservoir capacity and a larger proportion of the ejected
stroke volume will flow through the arterial system during
systole, resulting in both intermittent pressure and flow as
well as excessive pressure and flow pulsatility. This may
contribute to target organ damage via remodeling, capillary
rarefaction, and microvascular ischemia (
30
). The gold
standard method to non-invasively quantify arterial stiffness
is carotid-femoral pulse wave velocity (cfPWV). cfPWV is
the quantification of time delay between carotid and femoral
waveforms, divided by the distance covered. Other methods
for measuring PWV in the large arteries exist including
cuff-based techniques and phase-contrast magnetic resonance
imaging (MRI). Moreover, other parameters, such as
aortic strain and distensibility may provide an alternative
description of large artery stiffness (
31
).
(b) The enlargement of the large arteries (i.e., thoracic aorta
and common carotid artery) with aging and hypertension
is generally due to the fracture of the load-bearing elastin
fibers due to the fatiguing effect of both the steady and
pulsatile tensile stress. Vascular smooth muscle cell (VSMC)
growth and apoptosis may also be involved, as the cyclic,
pulsatile strain on the vessels is also a determinant of
gene expression and growth of VSMCs in vitro (
32
,
33
).
The enlargement of large proximal arteries is suggested
to be a compensating mechanism, ensuring that a certain
level of arterial compliance is maintained (
29
,
34
,
35
).
However, when excessive (aneurysm), it may lead to major
adverse aortic events such as dissection and rupture (
36
).
Interestingly, the effect of pulsatile mechanical load on
arterial remodeling has been observed in large elastic arteries
but not in more distal, muscular arteries (radial). Large artery
dimension and shape can be quantified non-invasively by
MRI and ultrasound.
The Brain
Recent work suggests that aortic stiffness and pulsatile
hemodynamics are related to cerebral small vessel disease
development (
30
,
37
–
41
). Cerebral small vessel disease is
a range of neuroimaging findings (including white matter
hyperintensities and lacunes of presumed vascular origin,
cerebral microbleeds, perivascular spaces, and total cerebral
atrophy) thought to arise from disease affecting the perforating
cerebral arterioles, capillaries and venules, and the resulting
brain damage in the cerebral white and deep gray matter
(
42
). In the Age, Gene/Environment Susceptibility (AGES)—
Reykjavik study, higher aortic stiffness was associated with an
increase in flow pulsatility transmission to the cerebrovascular
circulation (
30
). In middle-aged and older adults, aortic stiffness
and pressure pulsatility were associated with progression of
neurovascular disease and cognitive decline (
43
). The association
between mean blood flow and its pulsatility and mild cognitive
impairment was also reported in a cross-sectional study (
44
)
based on 4D flow MRI, the reference technique for flow
evaluation especially in complex vascular territories, such as
inside the skull. Additionally, excess pressure, analogous to left
ventricular flow, was related to gray matter atrophy in healthy
subjects (
45
).
The Kidney
The relationship between arterial stiffness and pulsatility in
the kidneys has been demonstrated in several observational
studies [summarized in (
46
)]. These studies evaluated the
association between arterial stiffness and chronic kidney disease
progression, with conflicting results in those with type 2
diabetes (T2D) (
47
,
48
), hypertension (
49
), elderly (
50
), healthy
middle-aged (
51
,
52
), and young adults (
53
). Interestingly, in
both middle age and elderly subjects, an increase in brachial
pulse pressure was associated with accelerated renal function
decline (
50
,
52
) and in patients with T2D, excess pressure
was related to exercise-induced albuminuria (
24
). However,
the most convincing evidence on the clinical relevance of the
macro-microvascular interaction for kidney function comes
from a cross-sectional analysis of the AGES study cohort (
54
).
In 367 older adults aged 72–92 years, a mediation analysis
demonstrated that 34% of the relationship between aortic
stiffness and estimated glomerular filtration rate (eGFR) was
mediated by increased pulsatility index in the renal artery,
assessed via MRI flow waveform measurements. Aortic stiffness
was found to induce kidney damage mostly by means of an
increased flow pulsatility transmission (
54
). Interestingly, high
pulsatility mediates PWV-induced eGFR decline but the effect on
microalbuminuria accrual is less clear. Thus, it is conceivable that
the deleterious macro- microvascular interaction in diseases such
as T2D may be responsible for the increasingly higher prevalence
of normoalbuminuric/eGFR decline, an emerging phenotype
in contemporary epidemiology of diabetic nephropathy (
55
).
However, this hypothesis needs to be tested in future studies.
The Retina
The retina is a unique site where the microcirculation can
be imaged directly, providing an opportunity to study in vivo
the structure and pathology of the human circulation. The
retina is characterized by a dual blood supply: the inner
layers are supplied by the retinal arteries derived from the
central retinal artery; the outer retina, being avascular, depends
on choroidal circulation (
56
). These two vascular systems
being completely independent, present specific anatomical and
physiological characteristics, resulting in higher perfusion rate
in the choroidal vasculature and higher resistance at the inner
retinal level (
57
). As a consequence, the outer retinal layers may
be more exposed, and damaged by increased flow pulsatility
related to increased large artery stiffness, although this hypothesis
needs to be confirmed. Large artery stiffness has been shown
to be related to diabetic retinopathy (
58
), age-related macular
degeneration (
59
) and retinal microvascular impairment (
60
,
61
). Exaggerated pulsed retinal capillary flow, in contrast to
unchanged mean retinal capillary flow, and stiffer wall properties
of retinal arterioles has been observed in patients with treated
resistant hypertension compared with patients with grade 1–
2 hypertension (
62
). Furthermore, retinal PWV discriminated
between patients with mild hypertension and those with normal
or high normal BP (
63
,
64
) and may be related to large
artery PWV.
THE MACROVASCULATURE AND
PULSATILE HEMODYNAMICS
With advancing age, there is gradual degradation and fracture
of the elastin fibers in the arterial wall, leading to dilation, and
stiffening of large elastic arteries (aorta, carotid). In a study of
aortic sections from a range of animal species, a higher number of
cardiac cycles across the lifespan (heart rate x age) were associated
with greater disorganization of elastin, demonstrating how the
stress of each heart beat gradually alters arterial wall structure
causing loss of aortic buffering function (
65
), in a process often
assimilated to material fatigue due to cyclic stress. Thus, aortic
stiffness seems to precede, and induce, pulse pressure elevation
and hypertension (
66
–
69
). In parallel, sustained increases in BP
lead to changes to smooth muscle cell organization and the
extra-cellular matrix, resulting in greater arterial stiffness (
70
,
71
).
The relation between vessel geometry and distensibility and
local pulse pressure is highly debated. In a multivariable analysis
of a cohort of normotensive, and treatment-naïve hypertensive
patients, common carotid artery diameter and carotid IMT were
positively related to carotid pulse pressure, as well as heart rate
and age (
7
). Accordingly, a cross-sectional MRI study of 100
apparently healthy adults showed aortic dilation, elongation,
and reduced curvature in older age. Each of the geometric
changes were strongly related to higher systolic BP (
72
,
73
).
In contrast other data, such as the 16-year follow up from the
Framingham Heart Study and the 20-year follow-up from the
Healthy Coronary Artery Risk Development in Young Adults
study (
74
,
75
), support the notion that higher central aortic pulse
pressure is associated with lower aortic diameter (
76
–
78
). Finally,
an MRI study in young-middle aged adults with isolated systolic
hypertension (and thus elevated pulse pressure), suggested that
it is rather the mismatch between aortic stiffness and diameter,
which could explain elevated pulsatility (
77
).
An emerging determinant of increased transmission of
pressure and flow pulsatility at the microvasculature level
occurring with age and risk factors is the reduced impedance
mismatch between large and medium-sized muscular arteries.
The impedance is the relationship between pressure and flow.
In the context of large arteries, the characteristic impedance
is often used to quantify the amount of reflection generated
from the passage of a wave. At a location where characteristic
impedance changes, often called impedance mismatch, a reflected
wave is generated. Larger and more elastic vessels have lower
characteristic impedance. According to the so-called stiffness
gradient hypothesis, in healthy young individuals, when aortic
stiffness is lower than that of medium-sized muscular conduit
arteries, some suggest that partial pressure wave reflections
are generated at the transition of these segments, resulting in
attenuated pulse pressure transmission and possible protection of
microcirculation (
34
,
79
). By increasing large but not small artery
stiffness, aging and risk factors limit or even reverse this gradient,
attenuating distal reflection and thus increasing the amount
of forward pressure wave transmitted to the microcirculation,
potentially leading to increased organ damage. This hypothesis
was supported by a prospective study in dialysis patients and
demonstrated that a reduced stiffness gradient is associated
with increased cardiovascular events (
80
). Furthermore, a
reduced stiffness gradient was observed in patients with T2D
(
81
). However, others have shown that aortic-brachial stiffness
gradient had little or no impact on wave reflection (evaluated as
augmentation index) and left ventricular hypertrophy (
82
).
THE MICROVASCULATURE AND
PULSATILE HEMODYNAMICS
The microcirculation has long been thought to only be
representative of peripheral vascular resistance (i.e., steady
state, as expressed as the ratio between mean arterial pressure
and cardiac output). However, the pulsatile component of the
BP curve (i.e., pulse pressure) influences the entire arterial
tree, including small arteries. Vasoconstriction of the arterioles
may increase the amplitude of wave reflection, resulting
in an increase in central (aortic) pulse pressure. However,
an alternate explanation for an increase in central pulse
pressure may be an increase in the forward compression
wave (
83
–
85
). Conversely, endothelial cells, and pericytes in
the microvasculature may respond to increased pulsatile flow
by compensatory mechanisms, such as increased production
of nitric oxide and activation of cyclooxygenase-2, which are
concomitant with endothelin-1 and prostacyclin decrease (
86
).
When nitric oxide availability in the microcirculation is reduced
in conditions such as increased oxidative stress (as in aging
and hypertension) or hyperglycemia (as in T2D), the impact
of large artery flow pulsatility in the microcirculation may be
greater (
87
). The microcirculation also represents the very early
site of expression of CVD, by means of a chronic inflammation
state. The overexpression of reactive oxygen species leads to an
increased myogenic tone and is responsible for microvascular
remodeling in hypertension (
88
). This inflammatory state may
be also modulated by peculiar flow conditions, such as an
atheroprotective flow that was shown to induce miRNAs, which
are involved in the downregulation of pro-inflammatory and
upregulation of anti-inflammatory molecules (
89
).
CROSS TALK BETWEEN THE
MACRO-AND MICRO-VASCULATURE MACRO-AND
METHODS TO MEASURE THE
INTERACTION
To investigate the interaction between the macro- and
microvasculature, knowledge of the fluid dynamics between
these regions in the human body is essential. Following the wave
transmission approach, arterial pressure, and flow are the result
of superimposing forward and backward traveling waves. Thus,
it is desirable to quantify waves traveling in the forward direction
from large to small arteries, as well as to quantify reflected waves
traveling from the microcirculation back into larger arteries
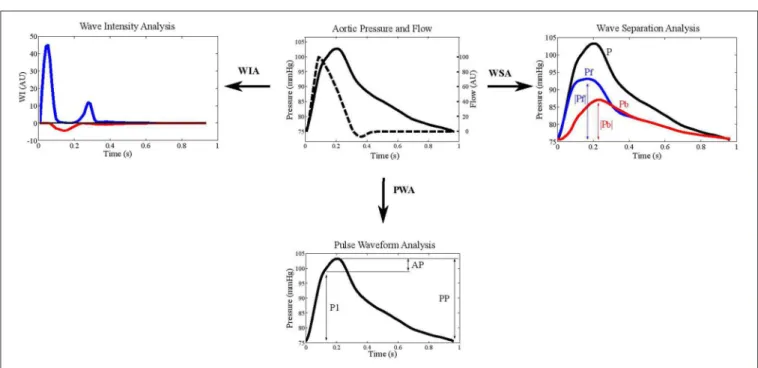
(Figure 2).
Augmentation index (AIx), defined as the difference between
the shoulder on the pressure wave and systolic pressure divided
by pulse pressure, has been widely used as a measure of
wave reflections (
29
) (Figure 2). An advantage of AIx is its
non-dimensionality, requiring neither calibration of BP nor
measurement of blood flow velocity. BP waveforms can be
obtained using non-invasive tonometry at the location of the
carotid- or radial arteries, or by oscillometric BP recordings at
the brachial level (
90
); however the validity of AIx as a measure
of reflection is uncertain as it is also influenced by PWV and other
FIGURE 2 | Example aortic pressure and flow waveforms depicted in wave intensity analysis (WIA), wave separation analysis (WSA), and pulse wave analysis (PWA). The blue lines indicate forward pressure (Pf) and the red lines represent backward pressure (Pb). Augmentation index is calculated as augmented pressure (AP) divided by pulse pressure (PP).
factors. It has been suggested that AIx may be more indicative of
arterial compliance and reservoir function than wave reflection
(
91
). Indeed, in healthy individuals, no relationship between AIx
and the “gold standard” measures of wave reflection calculated
from pressure and flow data were found (
85
). Furthermore,
using a computational model of the circulation, it was recently
demonstrated that myocardial shortening velocity and large
artery stiffness are the main determinants of AIx (
92
). Thus,
despite AIx being used extensively in cardiovascular research
and its predictive value for cardiovascular outcomes (
93
),
the available evidence suggests that AIx may not suitably
represent the interaction between macro-and microvasculature
and supports the use of wave separation and intensity techniques
(
94
,
95
). Following the wave transmission approach, methods
for the separation of pressure, and flow waveforms into their
forward and backward components have been presented, and
indices for the quantification of meaningful descriptors have been
developed (
96
).
Wave Separation Analysis
Westerhof et al. introduced the impedance method for
wave separation analysis (
28
) (Figure 2). Assuming a stable
cardiovascular condition, the characteristic impedance Z
cis
estimated in the frequency domain as high frequency limit of the
input impedance. Subsequently, forward (P
f) and backward (P
b)
traveling pressure can be expressed, based on measured pressure
(P) and flow (Q), as:
P
f=
(P + Z
∗cQ)/2
P
b=
(P − Z
∗cQ)/2
where P is pressure and Q is volume flow.
Alternatively, wave separation can also be performed in
the time domain. In this case, wave speed instead of wave
characteristic impedance is required. Usually, the amplitudes
of P
fand P
bor their ratio P
b/P
f, also denoted as reflection
magnitude, are used as indices for the quantification of the
pressure waves (
97
). Reflection magnitude showed a strong
predictive value both for cardiovascular events and new-onset
heart failure in a large community sample (
98
). In particular,
P
famplitude has been associated with increased cardiovascular
event incidence, beyond traditional risk factors and arterial
stiffness (
99
).
Wave Intensity Analysis
Wave intensity analysis (WIA) is increasingly employed in the
study of the cardiovascular system, providing additional, and
complementary information to the standard vascular evaluation
(Figure 2). Wave intensity represents the instantaneous power
carried by the pulse wave per unit cross sectional area traveling
from the heart to the periphery. The energy associated with this
wave is the result of the kinetic energy related to the blood flow
and the potential energy linked to the expansion of the arterial
wall (
97
).
The WIA implementation requires the acquisition of the
pressure and the flow velocity waveforms at a specific arterial
site. The wave intensity signal is then obtained by multiplying
the time derivative of pressure by the time derivative of blood
velocity (
100
). As a consequence, absolute wave intensity values
can characterize the traveling waves in terms of direction,
discriminating between forward waves originating from the heart
and backward ones arising from reflections sites. Furthermore,
since different changes in pressure and flow velocity lead to the
compression or the expansion of the vessel, both the forward and
the backward fronts can be characterized in terms of compression
and expansion waves (
101
).
The WIA signal in the aorta (
101
) presents a first positive
and prevailing peak in the early systolic phase, caused by the
simultaneous increasing of pressure and flow velocity originating
from left ventricle ejection (
102
). This local maximum is followed
by a small negative peak, generated by concomitant increase in
pressure and decrease in blood flow and is representative of the
backward compression wave originating from the reflection of
the forward compression wave from more distal points (
103
).
Finally, at the end-systolic phase, the wave intensity signal shows
a second positive peak, smaller than the first one, and caused by
the simultaneous decrease in pressure and flow velocity (forward
expansion wave) (
102
).
The analysis of the wave intensity signal provides quantitative
information about the energy transfer along the arterial
tree; therefore, this approach may be useful for obtaining
information about the interaction between macro- and
micro-vasculature (
104
). Currently, most literature concerns the
cerebral circulation. WIA was used to assess changes in the
cerebral vasomotor tone as a consequence of a hypercapnia
status, which is known to alter cerebral resistance. In this study,
the amplitude of the negative peak, both considering it as an
absolute value or divided by the amplitude of the first positive
peak (reflection index), was significantly decreased following
increase carbon dioxide concentration, indicating an association
between reduction in reflections and cerebral vasodilation (
105
).
This result is in line with other work focused on the effects
of two different hypertensive treatments. WIA was employed
at the carotid artery level and the WIA-derived reflection
index was significantly lower for the treatment with a greater
vasodilator action, as a consequence of an improved impedance
matching in correspondence of bifurcations (
106
). In treated
hypertensive patients, WIA-derived reflection index, but not
reflection magnitude and AIx, predicted cardiovascular events
independently of traditional risk factors (
107
). Furthermore, a
recently published longitudinal study showed that the amplitude
of the forward traveling wave, as assessed in mid- to late-life at the
carotid artery level, predicts faster cognitive decline, independent
from other cardiovascular risk factors (
108
).
Despite this evidence, some technical, and practical issues
should be considered. Since invasive assessment of pressure
and flow velocity waveforms is not feasible for widespread
use (
101
,
109
), non-invasive approaches have been proposed,
using applanation tonometry to obtain the pressure curve and
ultrasound pulsed wave Doppler imaging for the acquisition
of the flow velocity (
104
,
110
,
111
). Alternatively, WIA can
be implemented using diameter values instead of pressure
following the mathematical theory reported in (
112
). This
method has been applied at both the carotid and femoral
artery (
113
) and represents a valid approach even in preclinical
settings involving murine models, in which both the invasive
and the standard non-invasive methods are more difficult to
implement (
114
).
Wave Power Analysis
A drawback of the wave intensity is that it is not a conserved
quantity, i.e., it is sensitive to variations in the vessel diameter,
leading to difficulties in analyzing wave transmission in the
arterial tree. To overcome this problem, Mynard and Smolich
proposed the wave power analysis as an alternative (
115
). To
calculate wave power, volume flow instead of flow velocity is used.
As for the other methods, forward and backward components
of wave power can be derived to investigate wave transmission
phenomena. Recently, wave power analysis was used to identify a
higher aorto-carotid wave transmission in patients with reduced
aortic distensibility after coarctation repair. This is of importance,
as it is known that these subjects have an increased risk of
cerebrovascular disease and stroke even after successful surgical
treatment (
116
,
117
). Extensive clinical validation is needed to
understand the role of wave power analysis in the panorama of
the other techniques assessing wave reflection.
METHODS FOR MEASURING PULSATILITY
IN THE MICROVASCULATURE
Methods for measuring pulsatility in the macrovasculature are
displayed in Table 1. Different methods are available to assess
the microvascular pulsatile hemodynamics in low-resistance,
high flow organs such as the brain (and retina) and the
kidneys (Table 2).
The Brain
Most of the measures of pulsatility in intracranial arteries are
based on MRI or transcranial doppler ultrasound.
Cerebral Vasoreactivity
Cerebral vasoreactivity is a measure for the vasodilatory ability
of the cerebral (micro)vasculature and is defined as the mean
increase in blood flow or velocity after stimulation with either
acetazolamide or CO
2(
118
). Cerebral vasoreactivity can be
measured at the tissue level using blood oxygenation level
dependent MRI, arterial spin labeling, or positron emission
tomography (
119
,
120
). In addition, cerebral vasoreactivity can
be determined at the level of the large intracranial arteries via
transcranial doppler ultrasound or phase contrast MRI (
121
) or
in the small cerebral perforating arteries, using phase-contrast
high resolution (7 Tesla) MRI (
122
).
Cerebral Blood Flow Pulsatility
Cerebral blood flow pulsatility can be measured at the level of
the carotid artery via MRI and ultrasonography. High carotid
artery blood flow pulsatility is associated with MRI features of
cerebral small vessel disease (e.g., lacunes) and worse cognitive
performance (
30
,
123
). In large cerebral arteries, in cerebral
perforating arteries and arterioles, flow pulsatility can be assessed
by phase-contrast MRI. In this region, characterized by complex
arterial network, 4D-flow MRI sequences (
44
), by measuring
blood velocity in three orthogonal directions and in large volume,
may be superior to standard (1D) PC-MRI. Indeed, since they
do not require a specific measurement location or velocity
encoding direction, 4D-flow MRI is free of angle-dependent
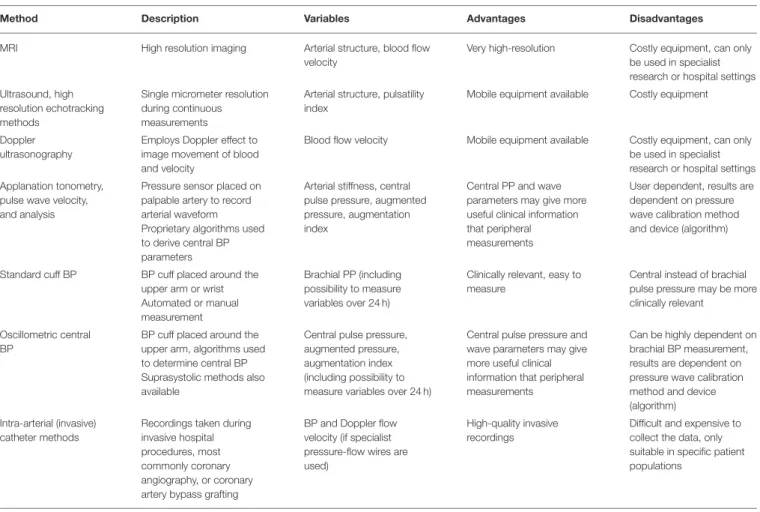
TABLE 1 | Methods used to determine pressure and flow pulsatility in the macrovasculature.
Method Description Variables Advantages Disadvantages
MRI High resolution imaging Arterial structure, blood flow velocity
Very high-resolution Costly equipment, can only be used in specialist research or hospital settings Ultrasound, high
resolution echotracking methods
Single micrometer resolution during continuous measurements
Arterial structure, pulsatility index
Mobile equipment available Costly equipment
Doppler ultrasonography
Employs Doppler effect to image movement of blood and velocity
Blood flow velocity Mobile equipment available Costly equipment, can only be used in specialist research or hospital settings Applanation tonometry,
pulse wave velocity, and analysis
Pressure sensor placed on palpable artery to record arterial waveform Proprietary algorithms used to derive central BP parameters
Arterial stiffness, central pulse pressure, augmented pressure, augmentation index
Central PP and wave parameters may give more useful clinical information that peripheral measurements
User dependent, results are dependent on pressure wave calibration method and device (algorithm)
Standard cuff BP BP cuff placed around the upper arm or wrist Automated or manual measurement
Brachial PP (including possibility to measure variables over 24 h)
Clinically relevant, easy to measure
Central instead of brachial pulse pressure may be more clinically relevant
Oscillometric central BP
BP cuff placed around the upper arm, algorithms used to determine central BP Suprasystolic methods also available
Central pulse pressure, augmented pressure, augmentation index (including possibility to measure variables over 24 h)
Central pulse pressure and wave parameters may give more useful clinical information that peripheral measurements
Can be highly dependent on brachial BP measurement, results are dependent on pressure wave calibration method and device (algorithm) Intra-arterial (invasive)
catheter methods
Recordings taken during invasive hospital procedures, most commonly coronary angiography, or coronary artery bypass grafting
BP and Doppler flow velocity (if specialist pressure-flow wires are used)
High-quality invasive recordings
Difficult and expensive to collect the data, only suitable in specific patient populations
BP, blood pressure; MRI, magnetic resonance imaging.
errors (velocity errors ensuing from the misalignment between
velocity encoding and blood velocity). Another key result of
encoding in three directions is the possibility to quantify complex
flow patterns, which are related to local dilation (
31
,
35
,
124
,
125
)
and arterial wall disruption (
126
).
Cerebral Microvascular Perfusion
Intravoxel incoherent motion MRI, a diffusion-weighted MRI
technique without the use of contrast agents, can be used to assess
cerebral microvascular perfusion (
127
). This technique enables
assessment of both the parenchyma and microvasculature and
is based on the diffusion of water molecules in parenchyma and
incoherent motion of water molecules in the microvasculature
(
127
). Intravoxel incoherent motion MRI has been used mainly
to investigate the brain, but may also be used in other parts
of the body (
128
). Although it was introduced in the
mid-eighties (
129
) it is still experimental, but it can provide a high
signal-to-noise ratio and high spatial resolution (
127
,
128
). An
advantage of this technique is the simultaneous assessment of
tissue microstructure and microvasculature, and, therefore, of the
interplay between brain tissue and vessels (
130
).
Higher cerebral pulsatility index has been shown to be
associated with MRI features of cerebral small vessel disease
(
131
) and cognitive impairment (
132
). Furthermore, a recent
study using intravoxel incoherent motion MRI found that the
microvascular properties of the hippocampus are altered in
individuals with T2D (
130
), which may be related to worse
cognitive function. While these biomarkers show promise for
identifying individuals at elevated risk, their prognostic value
needs to be confirmed in larger prospective studies. Cerebral
vasoreactivity of small arteries/arterioles using 7 Tesla provides a
direct functional measurement of the cerebral microvasculature
and may be preferable for investigating the interaction between
the macro- and microvasculature, but this technology is available
only in few, specialized centers, and only proof-of concept studies
have been performed.
The Kidney
Renal hemodynamics are classically assessed by renal plasma
flow, which is an invasive and time-consuming technique,
including radiotracer intravenous administration (
133
,
134
).
More recently, non-invasive techniques, including ultrasound
and MRI have been successfully applied (
135
) allowing a direct
quantification of renal microvascular blood flow, together with
structural characterization.
Magnetic Resonance Imaging
Without the use of radiation, MRI allows for blood flow
and velocity assessment via phase-contrast sequences and it
TABLE 2 | Methods used to determine pressure and flow pulsatility in the microvasculature.
Method Description Variables Advantages Disadvantages
Brain
Cerebral vasoreactivity Vasodilatory ability of the cerebral (micro)vasculature
Mean increase in blood flow or blood flow velocity after stimulation with either acetazolamide or CO2
Functional imaging; also possible at the level of the microvasculature with 7 Tesla MRI
Most methods available measure vasoreactivity at the level of large intracranial arteries, and not directly at the level of the microvasculature Cerebral blood flow
pulsatility
Blood flow pulsatility Pulsatility index Functional imaging; also possible at the level of the microvasculature with phase-contrast 7 Tesla MRI
Most methods available measure vasoreactivity at the level of large intracranial arteries, and not directly at the level of the microvasculature Cerebral microvascular
perfusion
Intravoxel incoherent motion MRI, a diffusion-weighted MRI technique without the use of contrast agents
Perfusion fraction, a measure for blood perfusion volume; and blood flow These variables are potentially sensitive to microvascular pathology
High signal-to-noise ratio and high spatial resolution; simultaneous assessment of tissue microstructure and microvasculature
Experimental tool
Kidney
MRI High resolution imaging Arterial structure and blood flow velocity, vascular resistance, pulsatility index
Very high-resolution Costly equipment, can only be used in specialist research or hospital settings Renal Doppler
sonography
Employs Doppler effect to analyze renal blood flow velocity pattern
Resistive index, pulsatility index, compliance index, renal acceleration time
Non-invasive technique; cost-effectiveness
Highly operator-dependent
Transesophageal Doppler
Employs Doppler effect to analyze renal blood flow velocity pattern
Resistive index, pulsatility index
Real-time measurement Invasive procedure, specific training is needed
Retina Fluorescein angiography and indocyanine green angiography
Calculates the time of transition of a dye molecule throughout a microvascular segment Vessel diameter (photo/video/mean transit time two-point fluorophotometry), mean transit time, arteriovenous passage
Coupled with Scanner laser ophthalmoscopy allows the direct measurement of retinal blood flow
Reliable data only if the vascular segment, diameter and volume of distribution satisfy specific conditions
Laser Doppler velocimetry
Measure of the maximum blood cell velocity in retinal vessels through the analysis of Doppler shifts
Blood velocity Estimated volumetric flow (based on the diameter of vessels >50 µm)
Useful to document physiologic changes in retinal perfusion
Very complex technique with multiple controls to manipulate, which makes it available only in research settings
Laser Doppler flowmetry
Using spectral analysis and wavelet transform
Blood flow velocity, pulsatility
Blood flow measurement is derived from red blood cells velocity and volume instead of diameter, thereby minimizing the variability due to different imaging methods for diameter calculation
Individual anatomy and local hematocrit may alter the blood flow estimation, a comparison between healthy and pathologic retina may be difficult
Scanning laser Doppler flowmetry
Integration of spectral analysis and red blood cell flow
Arterial structure, blood flow velocity
Non-invasive, in-vivo, both morphological and functional analysis
Mixed signal of retinal and choroidal tissue, limiting the interpretation of results, only available in research settings Laser speckle
flowgraphy
Measure of the blood flow based on the laser speckle phenomenon and mean blur rate pulse waveform analysis
Blood flow velocity, blowout time, blowout score
Quantitative ocular blood flow measurement in vivo
Arbitrary units implying difficult comparison with other techniques, subject compliance (good fixation) to obtain good images
Doppler optical computed tomography
Motion-contrast imaging based on backscattered light from retinal tissue High-resolution cross-sectional imaging
Arterial structure and anatomy, blood flow extracted from Doppler shift
Contactless and dye-free Costly equipment, can only be used in specialist research or hospital setting, cannot be applied for in vivo real-time measurements, motion-sample dependent
Color Doppler Quantification of blood velocities through Doppler effect
Resistive index, blood flow velocity
Ocular blood flow and blood velocity easily uncoupled
An increase in intraocular pressure may occur when the probe is applied on the closed eye, poor reproducibility
can provide detailed 3D angiography. As such, MRI can
quantify vascular resistance measures and pulsatility index (
136
).
Moreover, blood oxygen level dependent MRI sequences allow
for the measurement of kidney tissue hypoxia.
Renal Doppler Sonography
The most widely used technique for blood velocity assessment
is Doppler ultrasound due to wide availability, non-invasive,
and relatively easy use. Duplex ultrasound on the interlobar
renal arteries allows for the measurement of a number of
variables expressing flow pulsatility and vascular resistance,
among which the most widely used is renal resistive index—RI—
an angle-independent, semiquantitative parameter defined as
[peak systolic velocity (PSV)-end diastolic velocity(EDV)]/PSV.
The clinical significance of RI is still a matter of debate,
since it may be determined by systemic hemodynamics, arterial
compliance, PWV (
137
–
139
) or local flow pulsatility, rather than
renal vascular resistance (
140
). However, this observation, which
is usually seen as a limitation of the technique, might indeed
make RI a good candidate to represent the interaction between
the macro- and microvasculature, or rather its integrated effect
on the kidney. Finally, RI is able to track drug-induced changes
in renal hemodynamics (
141
). This led to the calculation of a
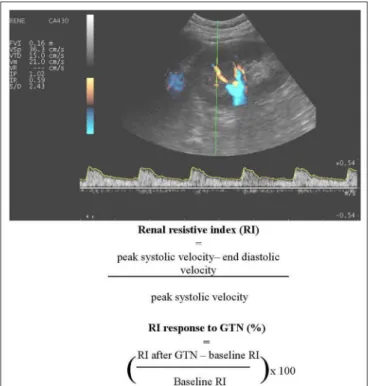
dynamic RI, estimating renal vasodilatory capacity before and
5 min after nitrate-induced vasodilation (Figure 3).
Transesophageal Doppler
A reduced systemic pulsatile blood flow is considered to
hamper renal perfusion leading to acute kidney failure.
FIGURE 3 | An example of renal Doppler sonography. A number of variables expressing flow pulsatility and vascular resistance can be determined, including renal resistive index (RI) and dynamic RI.
Transesophageal Doppler allows the measurement of
angle-dependent blood flow velocities (PSV, EDV, and mean diastolic
velocity) and angle -independent indices (RI and pulsatile
index) in the renal artery. Despite being an invasive procedure,
the measurement can be done in real-time and images can
be obtained in <5 min by trained personnel [summarized
in (
142
)].
To date, a number of studies have demonstrated the
prognostic role of RI, especially in T2D (
143
) and chronic
kidney disease (
144
), whereas dynamic RI is associated with
PWV and predicts microalbuminuria development in patients
with hypertension and T2D (
138
,
145
). Thus, at present,
these measures may be useful renal biomarkers to investigate
the interaction between the macro- and microvasculature. To
our knowledge, the relationship between markers of renal
pulsatility obtained using MRI and clinical outcomes has
never been assessed, though this technique is promising
and likely more accurate and reproducible than
ultrasound-based ones.
The Retina
Most widely used retinal microvascular variables include the
central retinal arteriolar/venular diameters or equivalents (
146
),
although more recent techniques allow a near-histological
evaluation of the arteriolar wall (
9
). Recently, other measures
of the retinal microvascular network geometry have been
studied, e.g., tortuosity, bifurcation angles and optimality, and
fractal dimensions (
146
), which are associated with diabetic
retinopathy, stroke, and cognitive impairment (
147
). It is also
possible to dynamically assess the retinal microvasculature
via
endothelium-dependent
vasodilatory
responses
[in
terms of perfusion and diameter changes, to flicker light
(
146
,
148
)].
Angiographic Techniques
Angiographic methods involve the measurement of transit
time of a contrast agent from arteries to veins, which is
inversely correlated with blood flow (
149
,
150
). Limitations
to this technique are related to diabetes (the sum of all
vessel diameters might not be directly related to retinal
blood volume) and vasodilation (which alters the contrast
distribution volume with an increased circulation time but
no changes in blood flow) (
149
,
150
). These measures,
made through a scanner laser ophthalmoscopy (SLO) require
injection of a contrast agent (
151
,
152
). SLO coupled with
adaptive optics (
153
) and optical coherence tomography
angiography (OCT-A) allow for the measurement of all
the retinal layers and accurately visualize both retinal and
choroidal microvasculature without contrast agent injection
(
154
,
155
).
Laser Doppler Techniques
Laser Doppler techniques are based on the optical Doppler
effect, which relies on the reflection of a high coherence laser
beam scattered in vivo on vascular tissue and captures the
shift of the underlying moving red blood cells. The
back-scattered light gives a measure of both the incident light
(vessel wall) as well as the shifted light (red blood cells), thus
providing a measure of relative blood flow, blood volume,
and blood velocity within a specified region of the retina.
An absolute red blood cell velocity is obtainable by means
of bidirectional laser Doppler velocimetry, when the light
scattered from the erythrocytes is detected from two directions.
For the volumetric blood flow rate calculation, an accurate
measure of the diameter is required (
156
). Laser Doppler
flowmetry does not rely on vessel diameter measurement but
is based on the intensity of signal derived from the red
blood cell volume and velocity (
157
). Combining the laser
Doppler flowmetry with laser scanning tomography, a
two-dimensional mapping of retinal blood flow can be obtained,
resulting from blood flow measurements based on both
single and multiple scattering events from many red blood
cells. Local frequency components of the reflected light are
obtained at each scanning point and combined with blood
velocity (
158
).
Other Doppler Techniques
Combining OCT with the Doppler technique, a simultaneous
measure of blood flow and vascular structure and anatomy
can be obtained (
159
). Applied to retrobulbar vessels, color
Doppler provides a measurement of PSV and EDV from
which RI and pulsatility index can be obtained. Recently, a
novel technique has been developed, laser Doppler holography
(Figure 4), which overcomes limits of low temporal resolution
using previous techniques such OCT-A, allowing a
full-field spatio-temporal filtered characterization of retinal small
arteries (
160
).
Laser Speckle Flowgraphy
Laser speckle flowgraphy is based on an interference
phenomenon resulting in a laser speckle pattern changing
when a scattered sample moves and allows the measurement
of human retinal blood flow in a semi-quantitative fashion.
It calculates the pulsatile flow from the difference in the
mean blur rate produced by the moving erythrocytes
during the systolic and diastolic phase (blowout time
and acceleration time index). The blowout time has been
inversely associated with age, brachial-ankle PWV and
directly correlated with carotid IMT. Studies in healthy
subjects observed a correlation between pulsatile flow
with carotid artery thickening and high carotid plaque
formation (
161
).
Despite a number of studies examining the relationship
between microvascular structural changes at the retinal
level and systemic macrovascular disease (
162
–
165
), the
prognostic value of retinal pulsatility variables remains to
be fully elucidated. One recent study showed that impaired
retinal microvascular function predicted all-cause mortality
in patients with end stage renal disease (
148
). Given that
laser Doppler techniques are the only currently available
methods to measure retinal pulsatility, they hold most
promise for investigating the interaction between the
macro-and microvasculature.
SUMMARY AND CONCLUSION
Over the last few decades, arterial stiffness has emerged
as a major, independent CVD risk factor. There is now
ample evidence that arterial stiffening gives rise to increased
pressure and flow pulsatility which may be transmitted to
the microvasculature and contribute to target organ damage
in the brain, kidney, and eye. In this review we have
provided a comprehensive summary of the methods to measure
the interaction between the macro- and microvasculature.
Further understanding the relationship between the
macro-and microvasculature macro-and target organs will provide avenues
for future treatment and management strategies that can
reduce the impact of pulsatility and minimize damage to
target organs, lessen the burden of associated disease and
FIGURE 4 | Retinal blood flow measurements in a healthy subject using laser Doppler holography. Left panel: Power Doppler image revealing the vascularized structures. Two regions of interest (ROI) marking a retinal artery and vein are drawn in red and blue, respectively. Right panel: Variations of blood flow over cardiac cycles in the regions of interest.
ultimately improve survival. Future work should determine
whether both lifestyle and pharmacological interventions can
regress accelerated arterial stiffening and whether this in turn
leads to a reduction in pressure and flow pulsatility and target
organ damage.
AUTHOR CONTRIBUTIONS
RC and RB contributed conception and design of the
study. All authors wrote sections of the manuscript,
contributed to manuscript revision, read and approved the
submitted version.
FUNDING
Work on this manuscript was made possible for RC by a
Prestige and Marie Curie Fellowship. TS was supported by
a L’Institute Servier research grant. DP was supported by a
Broadreach Postdoctoral Fellowship. AG received funding from
the European Union Seventh Framework Programme (267128).
REFERENCES
1. Lim SS, Vos T, Flaxman AD, Danaei G, Shibuya K, Adair-Rohani H, et al. A comparative risk assessment of burden of disease and injury attributable to 67 risk factors and risk factor clusters in 21 regions, 1990–2010: a systematic analysis for the Global Burden of Disease Study 2010. Lancet. (2012) 380:2224–60. doi: 10.1016/S0140-6736(12)61766-8
2. World Health Organization. A Global Brief On Hypertension. Genva: World Heath Organization (2013).
3. World Health Organization. Cardiovascular Diseases. Geneva: World Health Organization (2017).
4. Laurent S, Hayoz D, Trazzi S, Boutouyrie P, Waeber B, Omboni S, et al. Isobaric compliance of the radial artery is increased in patients with essential hypertension. J Hypertens. (1993) 11:89–98. doi: 10.1097/00004872-199301000-00013
5. Benetos A, Laurent S, Hoeks A, Boutouyrie P, Safar M. Arterial alterations with aging and high blood pressure. A noninvasive study of carotid and femoral arteries. Arterioscler Thromb. (1993) 13:90–7. doi: 10.1161/01.ATV.13.1.90
6. Laurent S, Girerd X, Mourad J-J, Lacolley P, Beck L, Boutouyrie P, et al. Elastic modulus of the radial artery wall material is not increased in patients with essential hypertension. Arterioscler Thromb. (1994) 14:1223– 31. doi: 10.1161/01.ATV.14.7.1223
7. Boutouyrie P, Bussy C, Lacolley P, Girerd X, Laloux B, Laurent S. Association between local pulse pressure, mean blood pressure,
and large-artery remodeling. Circulation. (1999) 100:1387–93.
doi: 10.1161/01.CIR.100.13.1387
8. Humphrey JD, Harrison DG, Figueroa CA, Lacolley P, Laurent S. Central artery stiffness in hypertension and aging: a problem
with cause and consequence. Circ Res. (2016) 118:379–81.
doi: 10.1161/CIRCRESAHA.115.307722
9. Rosenbaum D, Mattina A, Koch E, Rossant F, Gallo A, Kachenoura N, et al. Effects of age, blood pressure and antihypertensive treatments on retinal arterioles remodeling assessed by adaptive optics. J Hypertens. (2016) 34:1115–22. doi: 10.1097/HJH.0000000000000894
10. Schiffrin EL. Reactivity of small blood vessels in hypertension: relation with structural changes. State of the art lecture. Hypertension. (1992) 19(Suppl. 2):II1–9. doi: 10.1161/01.HYP.19.2_Suppl.II1-a
11. Rizzoni D, Agabiti-Rosei E. Structural abnormalities of small resistance arteries in essential hypertension. Intern Emerg Med. (2012) 7:205–12. doi: 10.1007/s11739-011-0548-0
12. Heagerty AM, Izzard AS. Small-artery changes in hypertension.
J Hypertens. (1995) 13:1560–5. doi:
10.1097/00004872-199512010-00008
13. McEniery CM, Yasmin, Hall IR, Qasem A, Wilkinson IB, Cockcroft JR. Normal vascular aging: differential effects on wave reflection and aortic pulse wave velocity: the Anglo-Cardiff Collaborative Trial (ACCT). J Am Coll Cardiol. (2005) 46:1753–60. doi: 10.1016/j.jacc.2005.07.037
14. Vermeersch S. Reference values for arterial stiffness’ collaboration. Determinants of pulse wave velocity in healthy people and in the presence of cardiovascular risk factors: Establishing normal and reference values. Eur Heart J. (2010) 31:2338–50. doi: 10.1093/eurheartj/ehq165
15. Franklin SS. Arterial stiffness and hypertension. Hypertension. (2005) 45:349–51. doi: 10.1161/01.HYP.0000157819.31611.87
16. Stehouwer C, Henry R, Ferreira I. Arterial stiffness in diabetes and the metabolic syndrome: a pathway to cardiovascular disease. Diabetologia. (2008) 51:527–39. doi: 10.1007/s00125-007-0918-3
17. Mitchell GF. Effects of central arterial aging on the structure and function of the peripheral vasculature: implications for end-organ damage. J Appl Physiol. (2008) 105:1652–60. doi: 10.1152/japplphysiol.90549.2008 18. Laurent S, Boutouyrie P. The structural factor of hypertension. Circ Res.
(2015) 116:1007–21. doi: 10.1161/CIRCRESAHA.116.303596
19. Leoncini G, Ratto E, Viazzi F, Vaccaro V, Parodi A, Falqui V, et al. Increased ambulatory arterial stiffness index is associated with target organ damage in primary hypertension. Hypertension. (2006) 48:397–403. doi: 10.1161/01.HYP.0000236599.91051.1e
20. Marcos MÁ, Recio-Rodríguez JI, Patino-Alonso MC, Gómez-Sánchez L, Agudo-Conde C, Gómez-Gómez-Sánchez M, et al. Ambulatory arterial stiffness indices and target organ damage in hypertension. BMC Cardiovasc Disord. (2012) 12:1. doi: 10.1186/1471-2261-12-1
21. Katsi V, Vlachopoulos C, Souretis G, Baou K, Dagalaki I, Alexopoulos N, et al. Association between retinal microcirculation and aortic stiffness in hypertensive patients. Int J Cardiol. (2012) 157:370–3. doi: 10.1016/j.ijcard.2010.12.074
22. Triantafyllidi H, Tzortzis S, Lekakis J, Ikonomidis I, Arvaniti C, Trivilou P, et al. Association of target organ damage with three arterial stiffness indexes according to blood pressure dipping status in untreated hypertensive patients. Am J Hypertens. (2010) 23:1265–72. doi: 10.1038/ajh.2010.156 23. Bruno RM, Cartoni G, Stea F, Armenia S, Bianchini E, Buralli S, et al.
Carotid and aortic stiffness in essential hypertension and their relation with target organ damage: the CATOD study. J Hypertens. (2017) 35:310–18. doi: 10.1097/HJH.0000000000001167
24. Climie RE, Srikanth V, Keith LJ, Davies JE, Sharman JE. Exercise excess pressure and exercise-induced albuminuria in patients with type 2 diabetes mellitus. Am J Physiol Heart Circ Physiol. (2015) 308:H1136–42. doi: 10.1152/ajpheart.00739.2014
25. Climie RE, Picone DS, Blackwood S, Keel SE, Qasem A, Rattigan S, et al. Pulsatile interaction between the macro-vasculature and micro-vasculature: proof-of-concept among patients with type 2 diabetes. Eur J Appl Physiol. (2018) 118:2455. doi: 10.1007/s00421-018-3972-2
26. Lockhart CJ, McCann A, Pinnock R, Hamilton P, Harbinson M, McVeigh GE. Multimodal functional and anatomic imaging identifies preclinical microvascular abnormalities in type 1 diabetes mellitus. Am J Physiol Heart Circ Physiol. (2014) 307:H1729–36. doi: 10.1152/ajpheart.00372.2014 27. Urbanˇciˇc-Rovan V, Bernjak A, Stefanovska A, AŽman-Juvan K,
Kocijanˇciˇc A. Macro-and microcirculation in the lower extremities— possible relationship. Diabetes Res Clin Pract. (2006) 73:166–73. doi: 10.1016/j.diabres.2006.01.002
28. Westerhof N, Sipkema P, Bos GVD, Elzinga G. Forward and backward waves in the arterial system. Cardiovasc Res. (1972) 6:648–56. doi: 10.1093/cvr/6.6.648
29. Nichols WW, O’Rourke MF, Vlachopoulos C. McDonald’s Blood Flow in Arteries; Theoretical, Experimental and Clinical Principles. 6th ed. Florida, FL: Hodder Arnold (2011).
30. Mitchell GF, van Buchem MA, Sigurdsson S, Gotal JD, Jonsdottir MK, Kjartansson Ó, et al. Arterial stiffness, pressure and flow pulsatility and brain structure and function: the Age, Gene/Environment Susceptibility– Reykjavik study. Brain. (2011) 134:3398–407. doi: 10.1093/brain/awr253 31. Guala A, Teixidó-Tura G, Rodríguez-Palomares J, Ruiz-Muñoz A,
Dux-Santoy L, Villalva N, et al. Proximal aorta longitudinal strain predicts aortic root dilation rate and aortic events in Marfan syndrome. Eur Heart J. (2019) 40:2047–55. doi: 10.1093/eurheartj/ehz191
32. Leung D, Glagov S, Mathews MB. Cyclic stretching stimulates synthesis of matrix components by arterial smooth muscle cells in vitro. Science. (1976) 191:475–7. doi: 10.1126/science.128820
33. Lehoux S, Tedgui A. Cellular mechanics and gene expression in blood vessels. J Biomech. (2003) 36:631–43. doi: 10.1016/S0021-9290(02)00441-4 34. Guala A, Camporeale C, Ridolfi L. Compensatory effect between aortic
stiffening and remodelling during ageing. PLoS ONE. (2015) 10:e0139211. doi: 10.1371/journal.pone.0139211
35. Guala A, Rodriguez-Palomares J, Dux-Santoy L, Teixido-Tura G, Maldonado G, Galian L, et al. Influence of aortic dilation on the regional aortic stiffness of bicuspid aortic valve assessed by 4-dimensional flow cardiac magnetic resonance: comparison with Marfan syndrome and degenerative aortic aneurysm. JACC Cardiovasc Imaging. (2019) 12:1020–9. doi: 10.1016/j.jcmg.2018.03.017
36. Erbel R, Aboyans V, Boileau C, Bossone E, Bartolomeo RD, Eggebrecht H, et al. 2014 ESC Guidelines on the diagnosis and treatment of aortic diseases: document covering acute and chronic aortic diseases of the thoracic and abdominal aorta of the adult the task force for the diagnosis and treatment of aortic diseases of the European Society of Cardiology (ESC). Eur Heart J. (2014) 35:2873–926. doi: 10.1093/eurheartj/ehu281
37. Pase MP, Beiser A, Himali JJ, Tsao C, Satizabal CL, Vasan RS, et al. Aortic stiffness and the risk of incident mild cognitive impairment and dementia. Stroke. (2016) 47:2256–61. doi: 10.1161/STROKEAHA.116.013508 38. Meyer ML, Palta P, Tanaka H, Deal JA, Wright J, Knopman DS, et al.
Association of central arterial stiffness and pressure pulsatility with mild cognitive impairment and dementia: the Atherosclerosis Risk in Communities Study-Neurocognitive Study (ARIC-NCS). J Alzheimer’s Dis. (2017) 57:195–204. doi: 10.3233/JAD-161041
39. Palta P, Sharrett AR, Wei J, Meyer ML, Kucharska-Newton A, Power MC, et al. Central arterial stiffness is associated with structural brain damage and poorer cognitive performance: the ARIC study. J Am Heart Assoc. (2019) 8:e011045. doi: 10.1161/JAHA.118.011045
40. Tarumi T, Khan MA, Liu J, Tseng BM, Parker R, Riley J, et al. Cerebral hemodynamics in normal aging: central artery stiffness, wave reflection, and pressure pulsatility. J Cereb Blood Flow Metab. (2014) 34:971–8. doi: 10.1038/jcbfm.2014.44
41. Xu T-Y, Staessen JA, Wei F-F, Xu J, Li F-H, Fan W-X, et al. Blood flow pattern in the middle cerebral artery in relation to indices of arterial stiffness in the systemic circulation. Am J Hypertens. (2012) 25:319–24. doi: 10.1038/ajh.2011.223
42. Wardlaw JM, Smith EE, Biessels GJ, Cordonnier C, Fazekas F, Frayne R, et al. Neuroimaging standards for research into small vessel disease and its contribution to ageing and neurodegeneration. Lancet Neurol. (2013) 12:822–38. doi: 10.1016/S1474-4422(13)70124-8
43. Tsao CW, Himali JJ, Beiser AS, Larson MG, DeCarli C, Vasan RS, et al. Association of arterial stiffness with progression of subclinical brain and cognitive disease. Neurology. (2016) 86:619–26. doi: 10.1212/WNL.0000000000002368
44. Rivera-Rivera LA, Turski P, Johnson KM, Hoffman C, Berman SE, Kilgas P, et al. 4D flow MRI for intracranial hemodynamics assessment in Alzheimer’s disease. J Cereb Blood Flow Metab. (2016) 36:1718–30. doi: 10.1177/0271678X15617171
45. Climie RE, Srikanth V, Beare R, Keith LJ, Fell J, Davies JE, et al. Aortic reservoir characteristics and brain structure in people with type 2 diabetes mellitus; a cross sectional study. Cardiovasc Diabetol. (2014) 13:143. doi: 10.1186/s12933-014-0143-6
46. Georgianos PI, Sarafidis PA, Liakopoulos V. Arterial stiffness: a novel risk factor for kidney injury progression? Am J Hypertens. (2015) 28:958–65. doi: 10.1093/ajh/hpv004
47. Bouchi R, Babazono T, Mugishima M, Yoshida N, Nyumura I, Toya K, et al. Arterial stiffness is associated with incident albuminuria and decreased glomerular filtration rate in type 2 diabetic patients. Diabetes Care. (2011) 34:2570–5. doi: 10.2337/dc11-1020
48. Sheen Y-J, Lin J-L, Li T-C, Bau C-T, Sheu WH-H. Peripheral arterial stiffness is independently associated with a rapid decline in estimated glomerular filtration rate in patients with type 2 diabetes. BioMed Res Int. (2013) 2013:309294. doi: 10.1155/2013/309294
49. Liu C-S, Pi-Sunyer FX, Li C-I, Davidson LE, Li T-C, Chen W, et al. Albuminuria is strongly associated with arterial stiffness, especially in diabetic or hypertensive subjects—a population-based study (Taichung Community Health Study, TCHS). Atherosclerosis. (2010) 211:315–21. doi: 10.1016/j.atherosclerosis.2010.02.015
50. Madero M, Peralta C, Katz R, Fried L, Najjar S, Shlipak M, et al. Association of arterial rigidity with incident kidney disease and kidney function decline: the health ABC study. Clin J Am Soc Nephrol. (2013) 8:424–33. doi: 10.2215/CJN.07900812
51. Tomiyama H, Tanaka H, Hashimoto H, Matsumoto C, Odaira M, Yamada J, et al. Arterial stiffness and declines in individuals with normal renal function/early chronic kidney disease. Atherosclerosis. (2010) 212:345–50. doi: 10.1016/j.atherosclerosis.2010.05.033
52. Kim CS, Kim HY, Kang YU, Choi JS, Bae EH, Ma SK, et al. Association of pulse wave velocity and pulse pressure with decline in kidney function. J Clin Hypertens. (2014) 16:372–7. doi: 10.1111/jch.12302
53. Upadhyay A, Hwang S-J, Mitchell GF, Vasan RS, Vita JA, Stantchev PI, et al. Arterial stiffness in mild-to-moderate CKD. J Am Soc Nephrol. (2009) 20:2044–53. doi: 10.1681/ASN.2009010074
54. Woodard T, Sigurdsson S, Gotal JD, Torjesen AA, Inker LA, Aspelund T, et al. Mediation analysis of aortic stiffness and renal microvascular function. J Am Soc Nephrol. (2015) 26:1181–7. doi: 10.1681/ASN.2014050450 55. Penno G, Solini A, Orsi E, Bonora E, Fondelli C, Trevisan R, et al.
Non-albuminuric renal impairment is a strong predictor of mortality in individuals with type 2 diabetes: the Renal Insufficiency And Cardiovascular Events (RIACE) Italian multicentre study. Diabetologia. (2018) 61:2277–89. doi: 10.1007/s00125-018-4691-2
56. Saint-Geniez M, D’Amore PA. Development and pathology of the hyaloid, choroidal and retinal vasculature. Int J Dev Biol. (2004) 48:1045–58. doi: 10.1387/ijdb.041895ms
57. Adler FH HW. Adler’s Physiology of the Eye: Clinical Application. St. Louis: Mosby Year Book (1992).
58. Zhang X, Lim SC, Tavintharan S, Yeoh LY, Sum CF, Ang K, et al. Association of central arterial stiffness with the presence and severity of diabetic retinopathy in Asians with type 2 diabetes. Diab Vasc Dis Res. (2019) 16:498–505. doi: 10.1177/1479164119845904
59. Sato E, Feke GT, Appelbaum EY, Menke MN, Trempe CL, McMeel JW. Association between systemic arterial stiffness and age-related macular degeneration. Graefes Arch Clin Exp Ophthalmol. (2006) 244:963–71. doi: 10.1007/s00417-005-0201-6
60. Aissopou EK, Argyris AA, Nasothimiou EG, Konstantonis GD, Tampakis K, Tentolouris N, et al. Ambulatory aortic stiffness is associated with narrow retinal arteriolar caliber in hypertensives: the SAFAR study. Am J Hypertens. (2015) 29:626–33. doi: 10.1093/ajh/hpv145
61. Liu M, Wake M, Wong TY, He M, Xiao Y, Burgner D, et al. Associations of retinal microvascular caliber with intermediate phenotypes of large arterial function and structure: a systematic review and meta-analysis. Microcirculation. (2019) 26:e12557. doi: 10.1111/micc.12557
62. Harazny JM, Ott C, Raff U, Welzenbach J, Kwella N, Michelson G, et al. First experience in analysing pulsatile retinal capillary flow and arteriolar structural parameters measured noninvasively in hypertensive patients. J Hypertens. (2014) 32:2246–52. doi: 10.1097/HJH.0000000000000308 63. Kotliar KE, Baumann M, Vilser W, Lanzl IM. Pulse wave velocity in
retinal arteries of healthy volunteers. Br J Ophthalmol. (2011) 95:675–9. doi: 10.1136/bjo.2010.181263
64. Kotliar K, Hanssen H, Eberhardt K, Vilser W, Schmaderer C, Halle M, et al. Retinal pulse wave velocity in young male normotensive and mildly hypertensive subjects. Microcirculation. (2013) 20:405–15. doi: 10.1111/micc.12036