Forging, textures, and deformation systems in a B2 FeAl alloy
P. Zhao, D. G. Morris, and M. A. Morris-Mu¯noz
Institute of Structural Metallurgy, University of Neuchˆatel, Avenue de Bellevaux 51, 2000 Neuchˆatel, Switzerland; and CENIM, Avenida Gregorio del Amo 8,
28040 Madrid, Spain
(Received 23 October 1997; accepted 20 August 1998)
High-temperature forging experiments have been carried out by axial compression testing on a Fe– 41Al – 2Cr alloy in order to determine the deformation systems operating under such high-speed, high-temperature conditions, and to examine the textures produced by such deformation and during subsequent annealing to recrystallize. Deformation is deduced to take place by the operation ofk111l h110j and k111l h112j slip systems at low temperatures and byk100l h001j and k100l h011j slip systems at high temperatures, with the formation of the expected strongk111l textures. The examination of the weak k100l texture component is critical to distinguishing the operating slip system. Both texture and dislocation analyses are consistent with the operation of these deformation systems. Recrystallization takes place extremely quickly at high temperatures (above 800 ±C), that is within seconds after deformation and also dynamically during deformation itself. Recrystallization changes the texture such thatk100l textures superimpose on the deformation texture. The flow stress peak observed during forging is found at a very high temperature. Possible origins of the peak are examined in terms of the operating slip systems.
I. INTRODUCTION
The deformation of iron aluminide alloys at high temperatures is characterized by a peak in flow stress at intermediate temperatures.1 – 4 While early studies on FeAl alloys did not show such a peak,5 subsequent studies make it clear that the peak exists for all alloy compositions, extending from Fe3Al stoichiometry up to near FeAl stoichiometry, and that it is important to avoid the confusing strengthening effects of vacancy hardening in analyses.6,7A considerable amount of work has examined the nature of the peak in both families of alloys and suggested reasons for its origin.8 – 10
For FeAl based alloys it seemed for some time rea-sonably clear that deformation by glide ofk111l super-dislocations at low temperatures was superseded by deformation by glide of k100l dislocations at tempera-tures above the peak.4 – 6 The reasons for the change of Burgers vector seem to be tied to the locking ofk111l superdislocations by mechanisms such as dislocation de-composition (to k110l and k100l dislocations),11 climb locking,9,12 or vacancy hardening.7 It may also be noted that some of the hardening models, for example vacancy hardening, do not require, a priori, any change of Burg-ers vector, and the stress peak could be produced by the existence of a temperature range where k111l dis-locations are pinned followed by a range where they are released.7 Some questions have been raised about the validity of these results by recent experiments9,13
ex-amining changes in dislocation structures as a material is strained9 and during cooling after high temperature straining.13 Yoshimi et al.9 showed that there was a change of operating dislocation Burgers vector over the first 1–2% strain on deforming Fe39.5Al near its flow stress peak, withk111l superdislocations present initially at the low strain levels where flow stresses are gener-ally measured andk100l dislocations at strains of 1–2%, where previous dislocation and slip step analyses had been carried out.4,5,9Studies of Fe37Al deformed at high strain rate (ø2 3 1022ys) and subsequently rapidly cooled to avoid possible changes of dislocation struc-tures after deformation13 confirmed thatk111l superdis-locations controlled deformation under these conditions. While raising doubts about the dislocation mechanisms controlling flow stress at high temperatures, the present situation is not completely clear and consistent, with for example reports of significant amounts of glide ofk100l dislocations at 1% strain already,5the appearance of pro-nounced yield stress drops on straining from yield to about 1–2% as k100l dislocations dominate deforma-tion,4,9and the observation ofk111l dislocations at 4–5% strain after higher temperature (650 ±C) straining.13
For Fe3Al based alloys the situation is equally con-fused. Some studies report the stress peak to be due to pinning of k111l superdislocations, for example by re-laxation of the anti-phase boundary of the dislocation, by changes in the dislocation core structure or by cross
slip, without any change to k100l dislocations,1,2,14 – 16 whereas other reports consider thek111l to k100l change to be important.3,12 Recent studies on texture evolution during high temperature processing of such Fe3Al alloys have shown that the dominant operating deformation sys-tems can be deduced from the textures produced.17–19For alloys containing about 28% Al and 0– 5% Cr deformed by rolling, forging, or extrusion at temperatures from about 550 to 900±C, where the alloys have B2 order, it has been clearly shown that the textures produced can be explained by the operation ofk111l h110j and k111l h112j slip systems. Such temperatures are considerably higher than the stress peak for these materials, and therefore clearly raise doubts about the relevance of the post mortem TEM results which showed k100l dislocations after high temperature deformation.13 The explanation for the origin of the observed k100l dislocations could again be the decomposition of k111l superdislocations, produced during deformation,11,13,20 during the cooling-down period after deformation. Observed dislocation structures then have no relevance to the initial defor-mation stage.
In view of the doubts about the validity of post mortem TEM observations to the prior deformation mechanisms, the present study has examined both dis-location structures and textures produced by the high temperature deformation of a B2 ordered FeAl alloy. Deformation has been carried out by high temperature axial compression forging to large strains, assuring a significant texture change, with the forging terminated by a very rapid quench, limiting the extent of any post-deformation modification of dislocation structures. The texture simulations carried out by Kad et al.19 predict the texture changes expected under such forging conditions when different deformation systems operate, and can be used to interpret the observed textures. There has been only limited attention given to the textures formed on deforming B2 FeAl,21 showing a strong k111l wire texture after extrusion, but with the texture depending on the precise starting state and alloy composition. The present study attempts a more complete correlation of de-formation textures and slip systems in B2 ordered FeAl on straining over a wide range of high temperatures.
II. EXPERIMENTAL TECHNIQUES
The alloy used for the present study had the com-position Fe –41Al– 2Cr (at.%) and was supplied as a cast and forged pancake about 20 mm thick and 10 cm in diameter. Cylindrical samples of diameter 7.5 mm and height 15 mm were cut out from this pancake for the compression forging experiments. The sample ends were mechanically polished flat and perpendicular to the cylinder axis. Samples were annealed for 1 h at 1000±C, followed by 1 h at 700±C, 1 h at 600±C, and 24 h
at 500±C in order to ensure a stabilized, recrystallized structure with no retained excess vacancies.
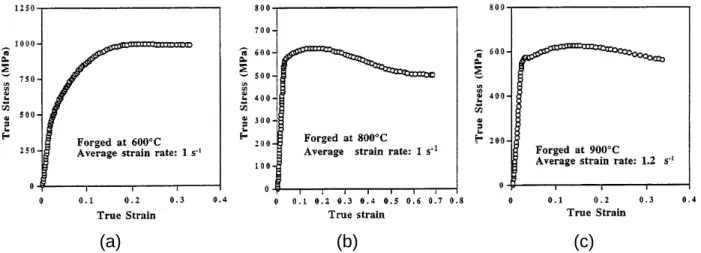
Forging consisted of an axial compression at a nominal strain rate of 1ys, and immediately after forging the sample was thrown into a nearby brine bath. The time between deformation and quenching was estimated to be about 1 s. Forging strain was controlled as a height reduction of about 45% for samples at high temperatures, but of only 25% at temperatures of 600±C and below because of cracking occurring during forging. Samples were preheated for about 20 min under protective at-mosphere, with the tungsten carbide forging plattens preheated to the same temperature to ensure minimal temperature changes before or during forging. Ends were lubricated with a molybdenum sulfide-based grease, with fine concentric grooves on the platten surfaces to retain a supply of the grease. Load and elongation data from a quartz gauge and a displacement transducer attached near the forging plattens were recorded during forging using a Power Macintosh and LabView software data acquisition system. The data were converted to true stress–true strain plots, assuming constant sample volume and uniform cylindrical shape. A few examples are illustrated in Fig. 1. Data were collected initially (over the elastic range and near plastic yielding) at total strain increments of below 0.1%, and later at strain increments of the order of 0.5%.
Forging experiments were carried out at tempera-tures ranging from 400 to 1000±C with the sample generally quenched immediately after deformation. A few additional samples were held for about 5 s at their forging temperatures at the end of deformation, before quenching, to assess the kinetics of structural changes af-ter deformation. In addition, some of the forged samples were given an anneal of 10 min at 800 ±C to examine the changes brought about by this treatment.
Samples were sectioned parallel to the cylinder axis and the central region was examined by optical, scanning electron and transmission electron microscopy, as well as by x-ray diffraction. Optical examinations were carried out on polished sections etched using a mixture of 12 ml HCl, 6 ml HNO3, 7 ml HF, and 80 ml water. SEM was carried out using a Cambridge Stereoscan 360 in the backscattered electron mode on sections electropolished using a 33% HNO3 and 67% methanol mixture at 5±C and 15 V. TEM was carried out using a Philips CM200 instrument on thin foils prepared by twin jet polishing using the same HNO3-methanol mixture as above at 210 ±C and 9 V. Dislocation Burgers vector, line direction, and habit (glide) planes were determined according to standard rules for invisibility using several imaging g vectors, and standard stereographic analysis methods. The double tilt Compustage sample holder al-lowed tilting over 645±and 660±about two orthogonal axes and it was possible to examine several major zone
(a)
(b)
(c)
FIG. 1. True stress – true strain plots showing the evolution of flow stress during compression by forging (strain rate about 1ys). The examples shown were obtained during forging at (a) 600±C, (b) 800±C, and (c) 900±C. These samples were strained to total height reductions of about 25, 45, and 45%, respectively.
axes for a given area, ensuring that several independent imaging g vectors were used and stereographic analysis was possible over a wide angular range.
X-ray diffraction was carried out on polished sec-tions through the forged cylinders, transverse to the cylinder axis. Studies were carried out using a Philips MPD 1800 diffractometer operating in the standard uy2u scanning mode using monochromated Cu Ka radiation. Scanning was carried out over a sufficiently wide an-gular range that the 110, 200, and 211 fundamental reflections, as well as the 111 superlattice reflection, were measured. (The fundamental 222 reflection occurs at too high a Bragg angle for the instrument used and could not be measured.) Textures were estimated according to the relative intensities of these peaks, as described elsewhere.22 This method thus provides quantitative information about the proportion of each type of plane to be found in the few degrees (solid angle determined by the dispersion of the x-ray slits used) around the forged cylinder axis. The observed intensities of the 110-111-200-211 reflections (I110, I111, I200, and I211) were normalized against the intensities (I
0 hkl) ex-pected for a texture-free Fe – 41Al–2Cr sample (similar to the intensities provided by standard powder diffraction data) as I110yI 0 110, I111yI 0 111, I200yI 0 200, and I211yI 0 211, and these intensity ratios used to characterize the state of texture. The calculated intensities of the texture-free Fe–41Al– 2Cr sample were determined supposing (for the 111 superlattice reflection) that the excess Fe and the Cr lay on the Al sites of the B2 lattice.23 Thus, for ex-ample, the intensity ratios (110y111y200y211) 1y1y1y1 indicate the absence of any texture, the 1y5y3y1 indicates the presence of a strong k111l texture with a weaker k200l texture. The above texture data will be presented here as 0.25y0.25y0.25y0.25 and 0.1y0.5y0.3y0.1 to in-dicate the fraction of each type of plane perpendicular to the cylinder axis.
III. RESULTS
A. Mechanical behavior during forging
Variations of flow stress during compression forging are illustrated in Fig. 1. It should be recalled that these data differ from usual laboratory compression testing by the high strain rate, near 1ys for the present experiments, and by the high total strain given to ensure a large change in the texture present. For relatively low temperatures, 800±C and below, yielding appeared continuous with no yield discontinuity or plateau (at the strain resolution of the data collection system, about 0.05– 0.1%). Yield was followed by a period of strong work hardening, throughout the entire forging process at 400 and 500 ±C, but progressively limited to smaller strains at higher temperatures as stress saturation or even stress fall occurred [at 600 and at 700 – 1000 ±C, respectively; see Figs. 1(a) – 1(c)]. Such flow stress saturation and fall is associated with dynamic recovery and recrystallization, which took place so rapidly at 1000±C that yielding was almost immediately followed by a stress fall. Forging at 900±C was unique here in showing a small stress plateau at the yield point, somewhat similar to that reported by Yoshimi et al. on testing FeAl near the temperature of its flow stress peak.4,9
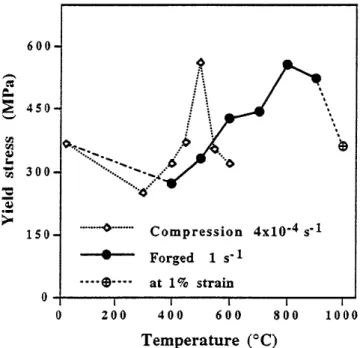
Figure 2 shows the yield stress (flow stress at 0.2% plastic strain) as a function of test temperature for the present forging experiments and also for compression tests carried out on the same material at a usual labo-ratory strain rate (unpublished work). The two sets of data differ essentially in the temperature of the flow stress maximum, which is the usual value of about 500±C4,9,10for laboratory testing and the very high value of about 800±C for the present forging experiments. In the present data it is seen that both the regions of increasing flow stress (300 – 500 and 400–800 ±C) and the regions of decreasing flow stress (500 – 600 and
FIG. 2. Yield stress values measured during high strain-rate com-pression forging and during standard slow laboratory comcom-pression testing.
800 – 1000±C) are displaced to higher temperatures by the higher rate of straining.
B. Microstructural evolution
Examinations on the initial material showed the starting microstructure to be single phase, equiaxed poly-crystalline with a grain size of the order of 0.5 –1 mm. The microstructures after forging have been examined for all the forged samples, but only a few examples of the structural changes will be presented here. The results of microstructural changes taking place during deformation or on subsequent annealing are summarized in Table I.
On forging at temperatures of 700±C and below, followed by a rapid quench, there were no clear signs of recrystallization, and the original grains were filled with a high dislocation density, showing some tendency to the formation of a dislocation cell structure, and at the high temperatures in this range some recovery to a dislocation subgrain structure. There was no obvious influence of the speed of quench (immediately after forging, or after a 5 s wait) on the sample forged at 600±C, suggesting that recovery and recrystallization was rather slow (requiring more than 5 s) at this temperature.
After forging to 45% height reduction at 800±C the central region of the forged sample showed a mixed structure of elongated cells or subgrains and fine, equiaxed grains and subgrains several microns in size; see Fig. 3. The structure varied from place to place, prob-ably depending on the orientation of the initial grain. The
TABLE I. List of forging experiments carried out, and the evolution of fraction recrystallized, grain size in recrystallized parts, and sub-grain size in unrecrystallized regions as forging temperature, speed of quench after forging, and subsequent annealing treatments are varied.
Grain size Subgrain size (mm) in (mm) in Treatment Recrystallization recrystallized unrecrystallized conditionsa (%) regions regions
400 Q · · · · 500 Q · · · · 600 SQ · · · · 700 Q ø0 · · · 1 – 2 800 Q 15 5 1 – 2 800 Q 1 A 90 20 900 Q 35 7 – 10 2 900 SQ 70 10 – 15 900 SQ 1 A 90 15 1000 Q 50 15 2 – 5
aThe number indicates the forging temperature (±C); Q or SQ refers
to an immediate or a slow (after 5 s) quench after forging; A refers to a 10 min anneal at 800±C.
fine equiaxed grains or subgrains were sometimes found at regions inside initial grains and, more commonly, along the boundaries and triple points of the original grains, Fig. 3(b). The area fraction of new, equiaxed grains produced by recrystallization was estimated to be about 15%, with a grain size of about 5 mm.
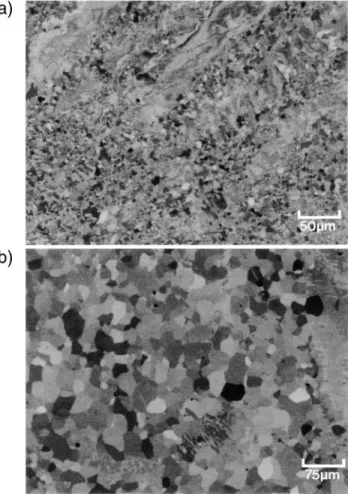
Forging at 900±C and higher temperatures, fol-lowed by an immediate quench, leads to gradually larger amounts of recrystallized regions, with the grain size also being larger, as illustrated in Fig. 4(a). In a similar way, the 5 s hold after forging at 900±C before quenching, as well as a 10 min anneal at 800 ±C at the end of forging, Fig. 4(b), leads to increased amounts of recrys-tallization with larger grain sizes. The data, summarized in Table I, show the steady increase in recrystallized fraction, larger grain size of the recrystallized region, and increase in subgrain size of the unrecrystallized parts as the treatment temperature or the hold time at high temperature increases. These results emphasize the speed with which recovery and recrystallization processes occur at such temperatures (800 – 1000 ±C) after the heavy forging deformation. In fact, it is clear that 10 min at 800±C are essentially sufficient to fully recrystallize these samples and, more importantly from the point of view of distinguishing deformation and recovered/recrystallized structures, even a time as short as 5 s at 900±C immediately after forging is suffi-cient to significantly modify the structures. It is also clear that at temperatures of 800 – 1000±C, significant recovery/recrystallization takes place either during the short period after forging before quenching (,1 s) or takes place dynamically during deformation itself, as suggested by the stress-strain curves of Fig. 1.
FIG. 3. Backscattered electron images showing deformation cell, subgrain, and newly formed grain structures in a sample forged at 800±C. (a) shows regions inside initial grains where elongated cells and equiaxed grains/subgrains are seen; (b) shows a triple point region of the original grains, showing elongated cells inside the grains and recrystallized grains along the original grain boundaries.
C. X-ray examinations
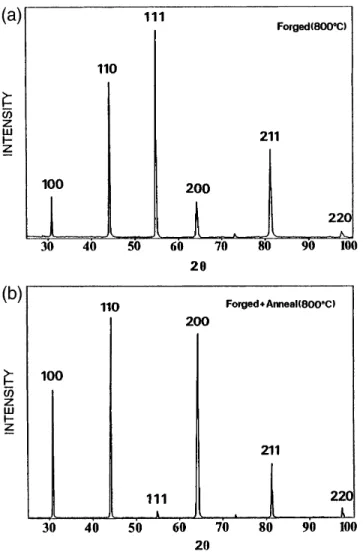
X-ray spectra were obtained on transverse sections of each sample, scanning over the angular range (2u) of about 30 to 90±, and two examples of results obtained are shown in Fig. 5. The samples were always well B2 ordered, as indicated by the strong superlattice reflections (100, 111, etc.), but no analyses of the state of order were carried out here. The examples of Figs. 5(a) and 5(b) show the samples forged at 800±C and quenched, and the same sample after an anneal of 10 min at 800±C, respectively. The forged state is characterized by a very strong 111 reflection, a strong 110 reflection, and weaker 211 and weak 200 reflections. When the data are normalized against the textureless powder spectrum and relative peak frequency summed to unity, this state is characterized by plane fractions 110y111y200y211 of 0.02y0.89y0.05y0.05: thus there is a very strong fraction ofh111j plane families parallel to the transverse section, with only small amounts of other families of planes. The forged and annealed sample of Fig. 5 is characterized by strong 110 and 200 reflections with weak 211 and very
FIG. 4. Backscattered electron images showing microstructures (a) after forging at 900±C followed by a quench, where a largely recrystallized region of grain size about 10 mm and a region of deformation cells are seen, and (b) after forging at 800±C, quenching,
and annealing for 10 min at 800±C, showing a mostly recrystallized
structure with grain size of about 20 mm.
weak 111 reflections: the families of planes parallel to the transverse section are then especially h200j planes, with small and equal amounts of the other three types of planes. It should be noted that the differences between the relative intensities of the Bragg reflections in Fig. 5 and the relative frequencies of given families of planes in the samples, as for the 0.02y0.89y0.05y0.05 example above, are due to variations of the efficiency of x-ray reflection of the planes, as determined by multiplicity, structure factor, and Lorentz-polarization terms.24
The relative fractions of each plane (110, 111, 200, and 211) parallel to the transverse section through the sample deduced from such x-ray data are shown in Table II. The initial state, dependent on its casting, forg-ing, and annealing history, shows a fairly weak texture, with h110j, h111j, and h200j planes having almost the same frequency parallel to the section surface. Forging at low temperatures (400 – 800 ±C) and quenching well (Q samples) leads to a significant increase in the fraction of h111j planes, weakening the h110j, h200j, and h211j
FIG. 5. Illustrations of x-ray spectra obtained on (a) the sample forged at 800±C and quenched, and (b) the same sample after a subsequent anneal of 10 min at 800±C.
planes. Of special interest also is to note the steady increase in the fraction of h111j planes and decrease in the fraction ofh200j planes as the temperature increases from 400 to 800±C. Recrystallization of the sample forged at 800 ±C by an anneal of 10 min at 800±C (800 Q 1 A) leads to a strongk200l texture, significantly weakening the k111l texture. Deforming at 900 ±C (and fast quenching) leads to a similar general texture to that after deformation at 800±C, except that the h111j planes are not so frequent and the h200j planes remain present as a significant fraction; such a result can be seen as a mixture of the 800±C deformation texture (mostly) with some (slight) addition of the annealing texture. The sample forged at 900±C and given a delayed quench (900 SQ) is also seen to have a mixture of the deformation and annealing textures, with a larger proportion of the annealing texture. Further annealing this sample (900 SQ 1 A) leads to an annealed texture essentially similar to that of the 800 Q 1 A sample. Finally, the sample forged at 1000±C and quenched (1000 Q) is seen to have texture essentially intermediate between those of the 900 Q and 900 SQ samples, and thus has a mixed deformation and annealing texture.
This analysis allows a clear distinction between the supposedly ideal deformation texture, seen only when deforming at low temperature and quenching efficiently, and the ideal annealing texture, found after well re-crystallizing these deformed materials. It is also made clear that deformation experiments carried out at exces-sively high temperatures, e.g., 1000 ±C, or when short anneals are given after forging (including inefficient quenches), will lead to modified deformation textures, where changes toward the annealing texture can be distinguished. Finally, and importantly for a later anal-ysis of the slip systems operating during forging, the deformation texture may be characterized by (relative
TABLE II. Relative proportions of x-ray intensities (normalized against the powder spectrum and the strongest reflection) and fractions of each type of crystal plane in transverse sections through forged cylinders. The major texture component is indicated in bold.
X-ray peak intensity Fraction of planes of given type
Material statea 110 111 200 211 h110j h111j h200j h211j Initial 1 0.63 0.7 0.22 0.39 0.25 0.27 0.09 400 Q 0.01 1 0.13 0.09 0.01 0.82 0.11 0.07 500 Q 0.01 1 0.1 0.08 0.01 0.85 0.09 0.05 600 SQ 0.01 1 0.1 0.05 0.01 0.86 0.08 0.04 700 Q 0.01 1 0.07 0.05 0.01 0.87 0.07 0.04 800 Q 0.02 1 0.05 0.05 0.02 0.89 0.05 0.05 800 Q 1 A 0.09 0.14 1 0.12 0.07 0.1 0.74 0.09 900 Q 0.02 1 0.38 0.08 0.01 0.7 0.23 0.06 900 SQ 0.13 1 0.59 0.12 0.07 0.54 0.32 0.07 900 SQ 1 A 0.24 0.21 1 0.16 0.15 0.13 0.62 0.1 1000 Q 0.16 1 0.25 0.27 0.09 0.6 0.15 0.16
aThe number indicates the forging temperature (±C); Q or SQ refers to an immediate or a slow (after 5 s) quench after forging; A refers
to the starting texture) a major increase in the k111l texture at all forging temperatures, with a corresponding decrease in the strength ofk110l and k200l components. Thek211l texture is also weakened during deformation, but to a lesser extent. At very high temperatures there is a new increase in thek200l texture component, which can be associated with the onset of recrystallization. Such recrystallization may occur dynamically at the highest temperatures (e.g., 1000±C) and during the short times between deformation and quenching (e.g., the 900 SQ sample). At low deformation temperatures, below 800±C and progressively down to 400±C, there is also a pro-gressive increase in thek200l texture component, from 5 to 11%.
D. Transmission electron microscopy
Examinations of dislocation structures in samples forged at relatively low temperatures showed intense dis-location structures, some tendency to the appearance of dislocation cells, with the majority of dislocations being glissile k111l dislocations. There was in fact a gradual evolution of dislocation types from the lowest tempera-ture, 400±C, to the highest examined, 800 – 1000±C, namely as the k111l superdislocations gave way to k100l dislocations. A few examples of dislocations and dislocation structures found at the high temperatures will be presented, and an overview of dislocations over the entire temperature range given in table form. A more detailed analysis of individual dislocation structures will be presented at a later time.
Micrographs illustrating dislocation arrangements in the material forged at 800±C and quenched are shown in Figs. 6 – 8. Figure 6 shows a low magnification image of the unrecrystallized part of this sample showing the loose subgrain structure, of size about 1 –2 mm. The subgrains in this region all have an orientation near k111l, which is consistent with the texture deduced by the x-ray examination (Table II). The misorientation across the subgrain boundaries is estimated from Kikuchi line displacements as being less than about 2±.
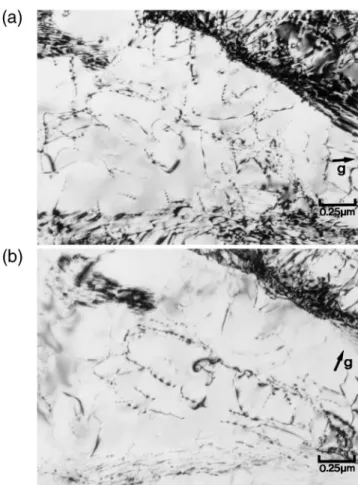
Figure 7 illustrates some of the typical dislocations and dislocation configurations found within some of the subgrains, for example at A in Fig. 6, and illustrates part of their analysis by tilting to other zone axes and imaging using other g vectors. It should be emphasized at this point that a very large number of dislocations was analyzed for each material state, typically of the order of 250 – 300 dislocations: the term analysis implying tilting to at least three major and nonzonal zone axes (for example from the initial [111], to [011], [101], and to either [001] or [110]) to determine line directions, imaging with sufficient g vectors to distinguish Burgers vectors of type k100l, k110l, and k111l (for example imaging with ¯101, 0¯11, ¯110, 200, and 020 g vectors),
FIG. 6. Electron micrograph showing typical loose subgrain structure in a sample forged at 800±C and rapidly quenched. Zone axis, parallel to the compression direction, is [111]. Imaging g vector (shown) is ¯101.
FIG. 7. Electron micrographs showing dislocations inside the sub-grain at A in Fig. 6, imaged with (a) zone axis [111], g vector (shown) ¯101, and (b) zone axis [011], g vector (shown) 0¯11.
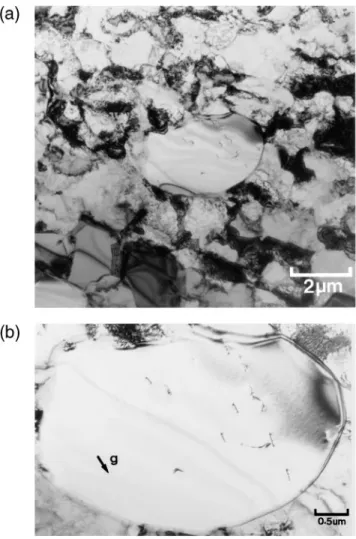
FIG. 8. Electron micrographs showing (a) a recrystallized grain and (b) the small number of dislocations inside the new grain. The zone axis of the recrystallized grain is near [001] in both cases, with an imaging g vector (shown) 020.
and also several subgrains in a given region of foil and several different foils were examined. The dislo-cations of Fig. 7, and other regions in the same sample, were almost entirely of Burgers vector k100l, and are thus single, perfect dislocations, and only occasionally were APB-dissociatedk111l superdislocations and k110l dislocations found.
The dislocations found in such 800±C forged sam-ples can be described as follows, with quantitative data given in Table III, for this deformation temperature as well as for the other temperatures examined. The vast majority of the dislocations were of Burgers vectork100l, which were present in unequal numbers of all three vari-ants, more [100] than [010] than [001] in Table III. Such dislocations were typically present in 45 – 90±edge di-rections, for example for [100] dislocations in directions such as [110], [130], and [010], and have glide planes corresponding toh001j or h011j. The dislocations found onh001j planes have high Schmid factors, while those on h011j may have high or low Schmid factors. In addition,
a few k111l superdislocations were found, typically in 45–60±edge directions, and lying on h110j type planes with intermediate to high Schmid factors. Some k110l dislocations have also been identified, generally lying on their orthogonal h110j plane, with a zero Schmid factor, or occasionally lying on a h121j plane, with a high Schmid factor. This quantitative analysis allows the following deductions about the operating slip systems: most deformation is carried by k100l h001j (mostly) and k100l h011j (slightly) slip systems; the presence of substantially different proportions of dislocations for each variant of k100l Burgers vector implies that their origin was slip and not the decomposition of initial k111l superdislocations, since this would presumably give approximately equal numbers of each type; the small number of k110l dislocations with zero Schmid factors may have been produced by reactions of different k100l dislocations—such reactions were occasionally seen — or perhaps by the decomposition ofk111l super-dislocations, but this was not observed here. The obser-vation of only a fewk111l superdislocations may suggest that only a very small amount of deformation occurs by k111l slip (assuming that most of the dislocations producing deformation are retained in the foil samples, and have not been significantly modified after their creation).
Occasional recrystallized grains were seen during the TEM studies of this 800±C forged sample, as illus-trated in Fig. 8. Such recrystallized grains were usually found isolated in the unrecrystallized subgrain regions, which retained the same appearance throughout the sample. Such recrystallized grains had sizes of the order of 3 – 5 mm and had orientations of usually k001l and sometimes k011l, in general agreement with the x-ray texture data (Table II). Such recrystallized grains usu-ally contained a small number of dislocations, which may be produced either during deformation itself (if recrystallization occurred before the end of the forging process) or during the quenching stage due to thermal stresses generated by the quench. In the example shown in Fig. 8, most of the dislocations were determined to have Burgers vector of type k110l, occasionally k100l andk111l, with Schmid factors near zero for almost all dislocations. Such a low Schmid factor (determined in relation to the force applied along the cylinder axis) sug-gests that either it was compatibility stresses between the soft, just-recrystallized grain and the surrounding hard, unrecrystallized subgrains, or quenching stresses that led to the appearance of these dislocations. There were few signs of dislocation reactions between the few disloca-tions present in these grains, and the origin of thek110l dislocations is not clear. In other such grains withk100l orientations, many of the dislocations found were of k100l Burgers vector, with low Schmid factors, as well as somek110l and a few k111l dislocations. In recrystallized
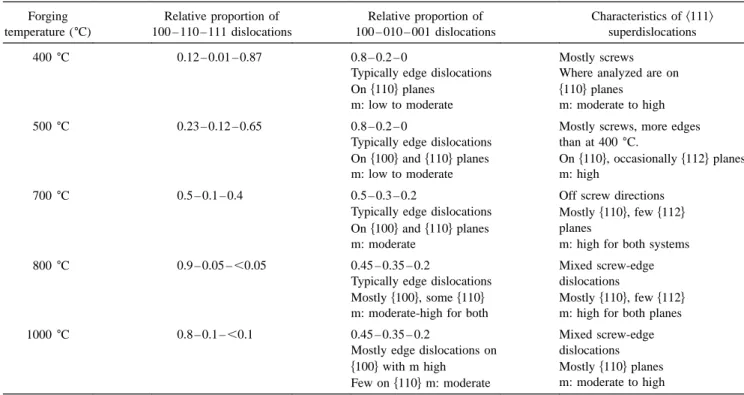
TABLE III. Statistical data on the distribution of dislocation types, their habit planes, and the Schmid factors corresponding to these slip planes, for samples deformed by forging and rapid quenching. m refers to Schmid factor deduced from forging axis, dislocation Burgers vector, and glide plane.
Forging Relative proportion of Relative proportion of Characteristics ofk111l temperature (±C) 100 – 110 – 111 dislocations 100 – 010 – 001 dislocations superdislocations
400±C 0.12 – 0.01 – 0.87 0.8 – 0.2 – 0 Mostly screws Typically edge dislocations Where analyzed are on Onh110j planes h110j planes
m: low to moderate m: moderate to high 500±C 0.23 – 0.12 – 0.65 0.8 – 0.2 – 0 Mostly screws, more edges
Typically edge dislocations than at 400±C.
Onh100j and h110j planes Onh110j, occasionally h112j planes m: low to moderate m: high
700±C 0.5 – 0.1 – 0.4 0.5 – 0.3 – 0.2 Off screw directions Typically edge dislocations Mostlyh110j, few h112j Onh100j and h110j planes planes
m: moderate m: high for both systems 800±C 0.9 – 0.05 – ,0.05 0.45 – 0.35 – 0.2 Mixed screw-edge
Typically edge dislocations dislocations
Mostlyh100j, some h110j Mostlyh110j, few h112j m: moderate-high for both m: high for both planes 1000±C 0.8 – 0.1 – ,0.1 0.45 – 0.35 – 0.2 Mixed screw-edge
Mostly edge dislocations on dislocations
h100j with m high Mostlyh110j planes Few onh110j m: moderate m: moderate to high
grains of k110l orientation, there were typically k100l dislocations present which also had very low Schmid factors. In all cases, then, it seems likely that either mechanical compatibility stresses or thermal stresses, both of orientations different from the forging direction, were responsible for producing these dislocations.
In summary of the dislocations found in the 800±C forged samples: deformed subgrains had orientations generally near k111l and contained a majority of k100l dislocations present in all three variants, but not in equal numbers; these dislocations were present in edge directions and lay onh001j and h011j planes; a few k110l dislocations were seen, which may have been formed by reactions between k100l dislocations, and a very small number of k111l superdislocations was found. In the recrystallized grains, which had orientations ofk001l or sometimesk110l, the dislocations present were typically k110l or k100l dislocations, with very low Schmid fac-tors, suggesting that local compatibility stresses between the recrystallized areas and the unrecrystallized matrix were responsible for such deformation.
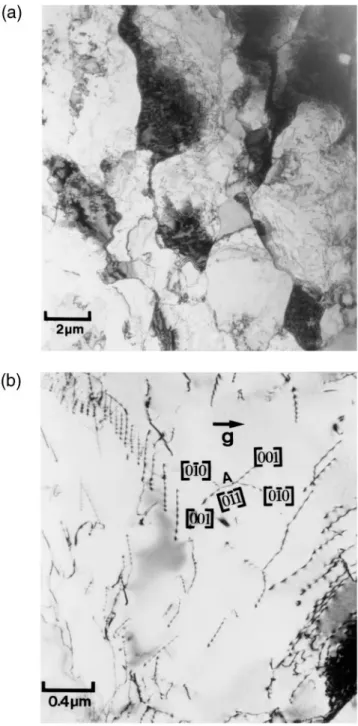
Equivalent microstructures observed on the 1000±C forged and quenched sample are shown in Fig. 9. Mi-crostructures are essentially similar to those observed after the 800±C forging, with the difference of being generally coarser. Figure 9(a) shows the typical subgrain structure of this sample, of size about 2 – 5 mm, again with generally k111l orientations and misorientations between subgrains of a few degrees. Figure 9(b) shows
individual dislocations, a loose dislocation pileup, and a forming sub-boundary inside one such subgrain. Sim-ilar to the analyses of the 800±C forged material, the 1000 ±C forged sample has about 80% of the dislocations with Burgers vectors of type k100l (in the example of Fig. 9(b), about 10% of these are [100], 50% are [010], and 40% are [001]), 5 – 15% arek111l superdislo-cations, and 5–15% are k110l dislocations. The k100l dislocations are again in edge directions and lie on h001j and h011j planes with generally high Schmid factors. The pileup seen in Fig. 9(b) is composed of such [010] dislocations, lying in the [100] direction, and on the (001) plane. The few k111l superdislocations lie in h011j planes and have generally moderate to high Schmid factors, while the k110l dislocations generally have low Schmid factors. At A is seen the reaction of two k100l dislocations to produce a k110l dislocation. Such reactions are assumed to be the origin of thek110l dislocations seen, rather than their formation by glide in view of their low Schmid factors. Figure 10 shows a more detailed example of dislocations in the 1000 ±C forged material, and illustrates the determination of Burgers vectors by tilting and imaging under different conditions. In the area shown, of initial orientation near k111l, there are, again, a majority of k100l disloca-tions and a very small number of k110l and k111l dislocations. Recrystallized grains in the 1000 ±C forged sample tend to have orientations near k100l, consistent with the x-ray texture data of Table II, with again most
FIG. 9. Electron micrographs showing (a) general subgrain structure and (b) typical dislocations inside a subgrain, of the sample forged at 1000±C. In (b) the zone axis is near [111], and the imaging g vector (shown) is 0¯11.
dislocations being k100l types, with near-zero apparent Schmid factors, and small numbers of k110l and k111l dislocations. Both these dislocations had fairly high apparent Schmid factors, but again it is supposed that local compatibility stresses or quenching stresses are responsible for producing these dislocations.
The summary of dislocation characteristics in Table III shows that the dislocations present after high forging strain and quenching are generally k111l
superdislocations at low temperatures with a gradual evolution to mostly k100l dislocations at 800±C and higher temperatures. There is not one sharp temperature where the transition in Burgers vector occurs, but rather a steady evolution over the entire temperature range. The k100l dislocations are never observed to be present in equal numbers of each variant ([100], [010], and [001]), which is deduced to imply that they are produced by glide during deformation and not by the decomposition ofk111l superdislocations, when more equal numbers of each variant may be expected. Thesek100l dislocations generally have moderate Schmid factors, consistent with their having been produced by glide. The k111l superdislocations are often in near-screw directions, and lie mostly on h110j planes, with high Schmid factors. More, albeit a small fraction, of these superdislocations lie on h112j planes over the range of increasing stress. A small fraction of dislocations are identified withk110l Burgers vectors over the entire temperature range. These rarely have high Schmid factors and are believed to be generally formed as junction reactions ofk100l disloca-tions (observed here) or possibly by decomposition of k111l superdislocations (not observed here).
IV. DISCUSSION
The present work sets out to determine the slip sys-tems operating at high temperatures under high-speed, forging conditions in an FeAl based alloy, to further examine the extent to which post-mortem TEM and x-ray studies lead to a coherent description of deformation, and finally to determine the sensitivity of both deformation structures and textures to the deformation temperature and to subsequent heat treatments on the deformed materials.
Texture measurements are summarized in Table II, using for convenience the relative peak intensities in the small solid angle region parallel to the compression axis. The initial material is seen to be characterized by a very weak texture, with rather similar peak intensities for the four Bragg reflections considered. Deformation is seen to produce a major increase in the proportion of h111j planes, with a corresponding decrease in the proportion of h110j and h200j planes, while the h211j planes are reduced only slightly: the 800±C forged and quenched sample illustrates such a state. Subsequent recrystalliza-tion, for example by the 10 min at 800 ±C anneal, leads to a major increase in the proportion of h200j planes, with a significant fall in the proportion ofh111j planes, and little change in the proportion of h110j and h211j planes. All other deformed and annealed states can be understood in terms of the combined contributions of these two texture types, with the transition from the de-formed to the recrystallized state evolving steadily at the high temperatures. Using the nomenclature of Table II,
(a)
(b)
(c)
(d)
(e)
(f)
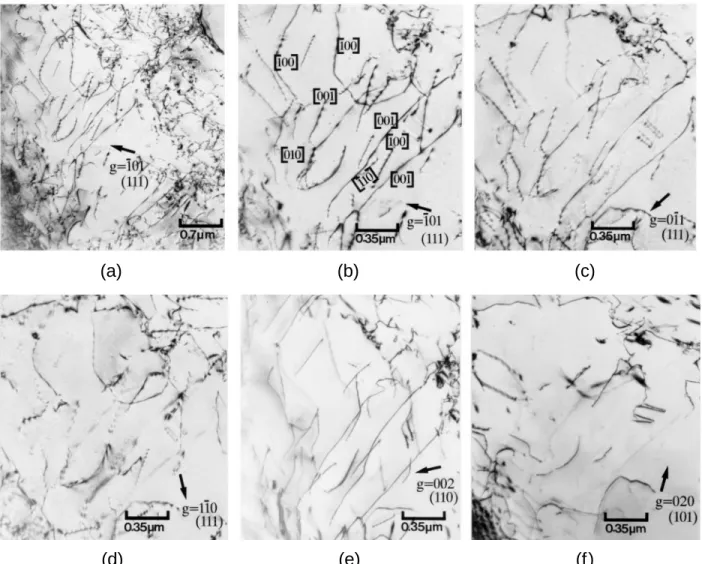
FIG. 10. Electron micrographs in material forged at 1000±C showing the general subgrain structure in (a) and detailed dislocation analysis in (b) – (f ). Zone axes and imaging g vectors are shown on micrographs (b) – (f ). Burgers vectors of some typical dislocations are identified.
namely defining the forging temperature (800, 900, or 1000±C), the quench as being normal (Q) or slow (SQ), and the subsequent anneal (1A), the transition from deformed state to recrystallized state takes place in the sequence: 800 Q –900 Q–1000 Q – 900 SQ–800y900 Q 1 A. Most important is to note here that recrystal-lization begins very rapidly at such high temperatures, essentially completely within 10 min at 800±C, but also significantly during the slow quench, that is in 5 s after forging at 900±C, and also that even the fast quench from 900 or 1000±C is not sufficient to completely avoid recovery and recrystallization. In fact, even at 800±C, there are signs of the beginning of recrystallization, which appears to be of dynamic nature, thus taking place during deformation itself, but it is believed that the majority of the material remains in the true deformation state corresponding to this temperature. It can also be noted that the analysis here, based on the gradual evolu-tion of texture data (Table II), is completely compatible with data on the extent of recrystallization measured
from the microstructural examinations (Table I). These texture data are also compatible with the stress variations observed during the forging process, illustrated in Fig. 1. At temperatures below 600 ±C there is little recov-ery and the material shows continuous work hardening during forging; at temperatures of 600 – 700±C there is considerable dynamic recovery and the material shows saturation of work hardening at high strains; at 800 ±C and above there is the onset of dynamic recrystallization and the stress falls at high strain levels as this occurs. The texture data of Table II also give important indications of likely dislocation slip systems during forging; this ar-gument is based on the simulated textures of Kad et al.19 who showed that slip onk111l h110j or k111l h112j sys-tems would lead to very strong k111l fiber textures on extrusion or forging, with a weak k100l fiber texture contribution. Slip on k100l h011j systems, on the other hand, would give rise to a similarly strong k111l fiber texture, but there would be no k100l fiber contribution. Thus at the low forging temperatures (see Table II), there
is a strong k111l fiber texture with a weak but notable k100l contribution, while at progressively high forging temperatures thek111l fiber texture remains but the k100l contribution steadily weakens. The k100l fiber texture contribution is never strong, but nevertheless shows a change by a factor of 2 over the 400–800±C range, falling from 0.11 to 0.05. These changes of texture sug-gest that deformation has taken place at low temperatures mostly byk111l slip, while at the high temperatures there is a significant contribution of k100l slip.
The TEM study of dislocation structures in the samples deformed at the lower temperatures leads to the conclusion that most of the strain is carried by superdis-locations ofk111l Burgers vectors which glide on h110j planes. At intermediate forging temperatures some of these dislocations are also found onh112j planes, but the most important change taking place as the temperature rises is the gradual onset of more and more dislocations with k100l Burgers vectors, which glide on both h001j
and h011j planes. The change from k111l to k100l
dislocations is continuous over the 400 – 800±C range, with only a fewk100l dislocations observed after forging at 400±C and only a fewk111l superdislocations found after forging at 800±C. There is not, however, a critical temperature where the transition of dislocation type occurs. Based on the analyses of the highly curved dislo-cation segments, and also remembering that deformation takes place at a very high strain rate (ø1 ys), there is little indication of extensive climb, and it seems reason-able to deduce that deformation is indeed controlled by glide on the planes identified. There was little dislocation evidence of any significant contribution of other slip systems, with in particular very few dislocations with k110l Burgers vectors found. These k110l dislocations generally have very low Schmid factors, and seem un-likely to have formed by glide. It is more un-likely that they were produced by reactions betweenk100l dislocations and less likely that they were the remnants of decom-posing k111l superdislocations; occasional examples of combiningk100l dislocations to produce k110l junctions were found, but no examples ofk111l superdislocation decomposition (for example ask111l ! k110l 1 k001l) were seen here. It is equally unlikely that deformation actually took place by significant k111l slip with the dislocations being destroyed after forging by decom-position. Remnants of such decompositions (k111l ! k110l 1 k001l ! k100l 1 k010l 1 k001l) were not ob-served, and also this decomposition would presumably leave approximately equal numbers of each variant of k100l dislocation—not observed.
TEM studies and texture analyses are thus seen to be mutually consistent in confirming that k111l slip dominates flow (at the high strain rate and to the high strain levels) at low temperatures, near 400 – 500±C,
while k100l slip on h011j and also on h001j planes dominates flow at high temperatures, near 800±C.
The use of texture analyses for determining slip systems operating during deformation suffers from two limitations in the present study: the texture analysis is poorly sensitive to the slip system operating, and very high strain levels are required for significant texture changes. It has been seen in the present analysis that the major texture component remains k111l, independent of which slip system controls flow, and it is the detailed examination of the 5 to 11% contribution of the k100l texture component that must be used to deduce the dominating slip system. The present study has examined textures after 25 – 45% strain. Somewhat smaller strain levels could undoubtedly be used and notable changes in texture analyzed, but it is clearly impossible to examine the early stages of plastic flow, e.g., 0.2% plastic strain, where flow stress analyses are normally made.
The present study provides an interesting compar-ison of flow stress variations with temperature as the strain rate is increased by almost four orders of magni-tude. In the present case the temperature of the flow stress peak is raised about 300 ±C as the strain rate increases from near 1024ys to about 1ys, while the stress level at the peak is hardly changed; see Fig. 2. A major increase in the stress peak temperature has been proposed7and observed experimentally on several occa-sions for FeAl alloys of 40 – 50% Al,4,25,26 as well as for a Fe3Al alloy.27 For the FeAl alloys, observations have typically shown about 100–200 ±C increases in peak temperature and 50 –100 MPa increases in peak stress with strain rate increases of 2– 3 orders of magnitude. The present increase in peak temperature is consistent with the prior literature data, although the reason why no noticeable change of peak stress is found is not clear. An important difference between the present and prior data is that both the low temperature range, of rising stress with temperature, and the high temperature range, of falling stress with temperature, are displaced to higher temperatures, while previous studies have tended to show little effect of strain rate on the rising stress portion of the data. The available data are so limited, however, depending apparently on the Al content as well as the actual strain rate values considered, with the strain rate change from 1026ys to 1023ys not necessarily having the same effect as the 1023ys to 100ys change, that it is not possible to draw further conclusions at the present time. It is difficult at the present time to deduce here the dislocation mechanisms responsible for the flow stress variations (at 0.2% strain) on the basis of the texture and dislocation studies carried out at 25 – 45% strain. However, two scenarios can be considered to explain the stress rise and fall with increasing temperature. First, it may be proposed that k111l superdislocations initially
control deformation and determine the 0.2% flow stress at all temperatures (as suggested by Yoshimi et al.9 and Kad and Horton,13 for example), and there is a gradual increase in the contribution of k100l dislocations at higher temperatures and strain levels. At temperatures of 800±C and below, it is suchk111l superdislocations that control yielding, while at 900±C the k100l dislocations take over to dominate flow rather suddenly just after yield, giving rise to the yield plateau similar to that found by Yoshimi et al.9At even higher temperatures thek100l dislocations presumably take over very rapidly, before major yielding, even thoughk111l superdislocations may have been the first to operate for some microstrain, and thus it is actuallyk100l dislocations that now control the yield stress. In this scenario, thek111l to k100l transition of Burgers vector occurs gradually as both strain and temperature are increased, but the transition is not related to and does not cause the stress rise. It is the cause of the stress fall sincek100l dislocations now dominate flow and become progressively easier to move at the very high temperatures. The cause of the stress rise, when k111l superdislocations control deformation, is not determined in the present study, but may perhaps be correlated with the larger number of these dislocations observed to lie onh112j planes as the temperature rises.
In the second scenario, there is considered to be a steady mixture of k111l superdislocations and k100l dislocations for all strain levels (the ratio of each in the mixture may change somewhat with strain but not dramatically), and the fraction of k100l dislocations is determined essentially by the temperature. It is now the appearance of k100l dislocations that leads to the formation of obstacles to the movement of the k111l superdislocations, and hence is the origin of the stress increase. As more k100l obstacles are formed over the 400 – 800±C range, the flow stress rises, and it is only when glide of thesek100l dislocations becomes easy that the flow stress may fall. In this scenario, the origin of the yield plateau observed at 900±C is unclear. The first scenario is essentially that proposed by Yoshimi, Kad, and other researchers7,9,13 for the stress peak observed under usual laboratory testing conditions. The second scenario is that suggested earlier,4 – 6,11,20 whereby the appearance of k100l dislocation segments, either by reaction or by decomposition ofk111l superdislocations, is responsible for the stress increase. From the present experiments it is not possible to distinguish between these two scenarios since we do not have information on the dislocation structures immediately after yield or on the variation of dislocation types during straining.
V. CONCLUSIONS
The present study has shown that an analysis of the textures produced during heavy deformation can provide
information on the dominant slip systems operating over the imposed strain range. The method is poorly sensitive to distinguishing between many of the slip systems of interest, however, particularly for small strain levels. The method is thus unreliable for examination of dislocation processes at yield, since changes in slip systems may occur during straining.
In the present study, the texture studies and the TEM analyses of dislocation structures are consistent in showing thatk111l superdislocations dominate deforma-tion at low temperatures, here 400–500 ±C, and k100l dislocations on h011j planes dominate deformation at very high temperatures, about 800 ±C.
The flow stress at yield rises with test temperature to a peak at about 500±C for the present alloy when tested at a strain rate near 1024ys, and to a peak at about 800±C when forged at a strain rate of about 1ys. The peak stress level is similar for both strain rates. From the present study, which has analyzed dislocation structures and slip systems only after deforming to 25 – 45% strain, it is not possible to deduce the role of thek111l to k100l transition on the yield stress changes, since this transition may occur from the beginning of plastic deformation or may set in at a later strain, after yield.
ACKNOWLEDGMENTS
One of us (PZ) would like to acknowledge the financial support of the following agencies during the course of this research: the Swiss Federal Commission for an Exchange Student grant, and the Swiss National Science Foundation for a doctoral grant.
REFERENCES
1. W. Schroer, H. Mecking, and C. Hartig, in Proc. Int. Symp. Intermetallic Compounds — Structure and Mechanical Properties (JIMIS-69), edited by O. Izumi, The Japan Institute of Metals, Sendai (1991), p. 567.
2. W. Schroer, C. Hartig, and H. Mecking, Z. Metall. 84, 294 (1993). 3. D. G. Morris, D. Peguiron, and M. Nazmy, Philos. Mag. A71,
441 (1995).
4. K. Yoshimi, S. Hanada, and M. H. Yoo, Acta Metall. Mater. 43, 4141 (1995).
5. Y. Umakoshi and M. Yamaguchi, Philos. Mag. A41, 573 (1980). 6. I. Baker, H. Xiao, O. Klein, C. Nelson, and J. D. Whittenberger,
Acta Metall. Mater. 43, 1723 (1995).
7. E. P. George and I. Baker, Philos. Mag. A77, 737 (1998). 8. I. Baker, Mater. Sci. Eng. A192/193, 1 (1995).
9. K. Yoshimi, S. Hanada, and M. H. Yoo, in High-Temperature
Ordered Intermetallic Alloys VII, edited by C. C. Koch, C. T. Liu,
N. S. Stoloff, and A. Wanner (Mater. Res. Soc. Symp. Proc. 460, Pittsburgh, PA, 1997), p. 313.
10. D. G. Morris, in Proc. 4th Int. Conf. on High Temperature Intermetallics, edited by C. T. Liu, S. H. Whang, and D. P. Pope, Mater. Sci. Eng. A239-240, 23 (1997).
11. K. Yoshimi and S. Hanada, in Structural Intermetallics, edited by R. Darolia, J. J. Lewandowski, C. T. Liu, P. L. Martin, D. B. Miracle, and M. V. Nathal (TMS, Warrendale, PA, 1993), p. 475.
12. D. G. Morris, Philos. Mag. A71, 1281 (1995).
13. B. K. Kad and J. A. Horton, in Proc. 4th Int. Conf. on High Temperature Intermetallics, edited by C. T. Liu, S. H. Whang, and D. P. Pope, Mater. Sci. Eng. A239-240, 118 (1997).
14. S. Hanada, S. Watanabe, T. Sato, and O. Izumi, Scripta Metall.
15, 1345 (1981).
15. A. Brinck, C. Engelke, and H. Neuhauser, Mater. Sci. Eng. A234, 418 (1997).
16. G. Molenat, A. Couret, and D. Caillard, Mater. Sci. Eng. A234, 660 (1997).
17. D. Raabe and W. Mao, Philos. Mag. A71, 805 (1995). 18. D. Raabe, Acta Mater. 44, 937 (1996).
19. B. K. Kad, S. E. Schoenfeld, R. J. Asaro, C. G. McKamey, and V. K. Sikka, Acta Mater. 45, 1333 (1997).
20. D. G. Morris and M. A. Morris, Intermetallics 5, 245 (1997). 21. S. A. Scheff, J. J. Stout, and M. A. Crimp, Scripta Metall. et Mater.
32, 975 (1995).
22. D. G. Morris and S. Gunther, Scripta Mater. 35, 1211 (1996). 23. I. M. Anderson, Acta Mater. 45, 3897 (1997).
24. B. D. Cullity, Elements of X-ray Diffraction (Addison-Wesley Pub. Co., Reading, MA, 1956).
25. X. Li and I. Baker, Scripta Mater. 36, 1387 (1997).
26. I. Baker and Y. Yang, Mater. Sci. Eng. A239-240, 109 (1997). 27. D. G. Morris and S. Gunther, Mater. Sci. Eng. A211, 23 (1996).