Supplementary Information for
The rise of angiosperms pushed conifers to decline during global
cooling
Fabien L. Condamine, Daniele Silvestro, Eva B. Koppelhus, Alexandre Antonelli
Corresponding author: Fabien L. Condamine
Email:
[email protected]
This PDF file includes:
Figs. S1 to S5
Tables S1 to S7
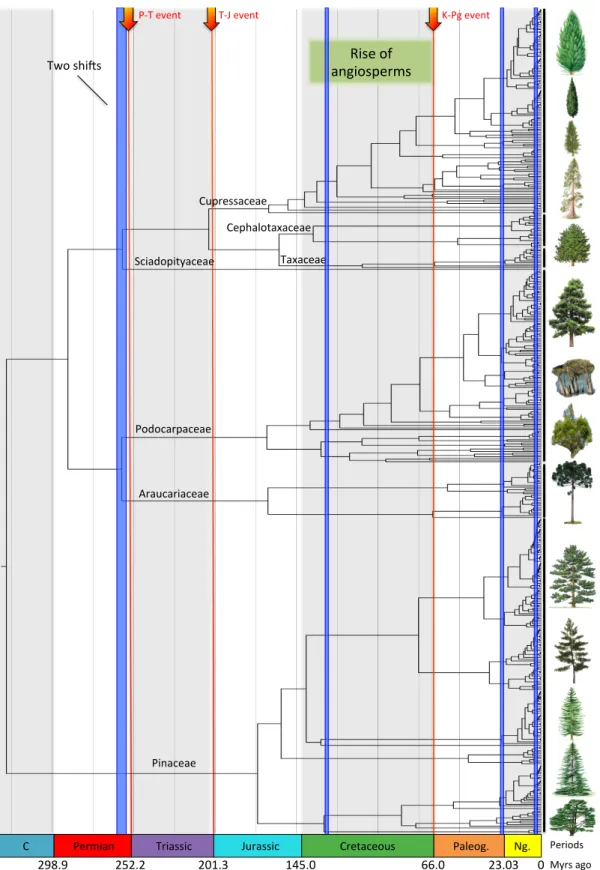
Fig. S1. Global diversification of conifers inferred from the phylogeny. Time-calibrated
phylogeny of conifers and significant shifts in diversification rates inferred under an episodic birth-death model implemented in TreePar. Six shifts of diversification rates through time were identified, which are indicated with blue bars. Two shifts occurred at the end of the Permian, one during the Cretaceous terrestrial revolution (rise of angiosperms), one at the end of the Oligocene, and two shifts were found in the Pliocene and Pleistocene. C = Carboniferous, Paleog. = Paleogene, and Neog. = Neogene.
K"Pg%event! P"T%event! T"J%event! Pinaceae% Araucariaceae% Podocarpaceae% Cupressaceae% Taxaceae% Cephalotaxaceae% Sciadopityaceae% Rise%of%% angiosperms% Periods% % Myrs%ago% 298.9% 252.2% 201.3% 145.0% 66.0% 23.03% 0% C%%%%%%%%%%%%%%%%Permian%%%%%%%%%%%%%%%Triassic%%%%%%%%%%%%%%%%%%Jurassic%%%%%%%%%%%%%%%%%%%%%%Cretaceous%%%%%%%%%%%%%%%%%%%%%Paleog.%%%%%%%%%Ng. %% Two%shiLs%
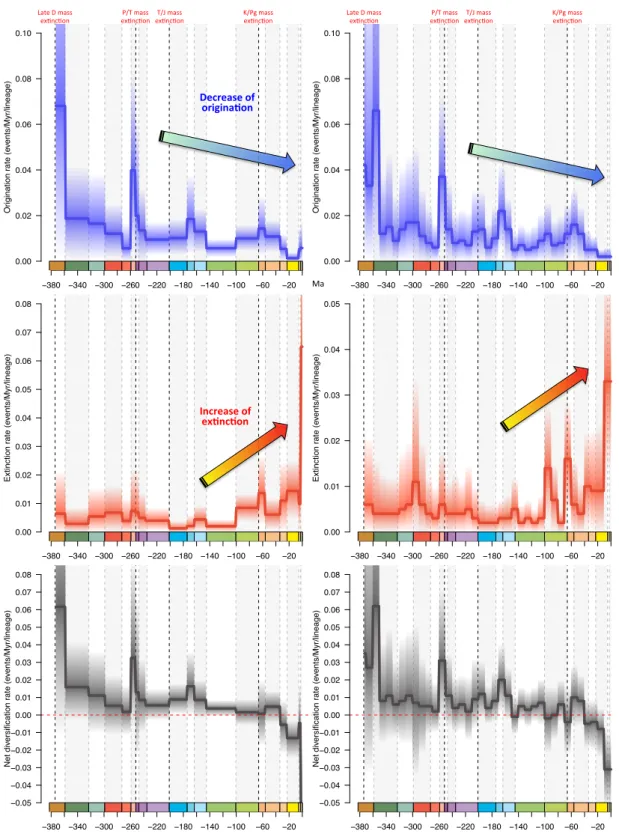
Fig. S2. Global diversification of conifers inferred from the fossil record. Rates of origination
(blue), extinction (red) and net diversification rates (black; the difference between origination and extinction) inferred from a fossil-based analysis at the genus level under the Bayesian approach implemented in PyRate using (A) the geological epochs, or (B) 10-million-year bins for constraining the episodic birth-death model. Solid lines indicate mean posterior rates and the shaded areas show 95% credibility intervals. The vertical dashed lines indicate the boundaries between geological boundaries and major mass extinction events.
Or igination r ate (e vents/Myr/lineage) −380 −340 −300 −260 −220 −180 −140 −100 −60 −20 0.00 0.02 0.04 0.06 0.08 0.10 Extinction r ate (e vents/Myr/lineage) −380 −340 −300 −260 −220 −180 −140 −100 −60 −20 0.00 0.01 0.02 0.03 0.04 0.05 Net div ersification r ate (e vents/Myr/lineage) −380 −340 −300 −260 −220 −180 −140 −100 −60 −20 −0.05 −0.04 −0.03 −0.02 −0.01 0.00 0.01 0.02 0.03 0.04 0.05 0.06 0.07 0.08 Or igination r ate (e vents/Myr/lineage) −380 −340 −300 −260 −220 −180 −140 −100 −60 −20 0.00 0.02 0.04 0.06 0.08 0.10 Extinction r ate (e vents/Myr/lineage) −380 −340 −300 −260 −220 −180 −140 −100 −60 −20 0.00 0.01 0.02 0.03 0.04 0.05 0.06 0.07 0.08 Net div ersification r ate (e vents/Myr/lineage) −380 −340 −300 −260 −220 −180 −140 −100 −60 −20 −0.05 −0.04 −0.03 −0.02 −0.01 0.00 0.01 0.02 0.03 0.04 0.05 0.06 0.07 0.08 P/T mass
ex*nc*on ex*nc*on T/J mass K/Pg mass ex*nc*on Late D mass
ex*nc*on
A) Diversifica-on dynamics constrained by geological epochs B) Diversifica-on dynamics constrained by 10-Myr bins
P/T mass
ex*nc*on ex*nc*on T/J mass K/Pg mass ex*nc*on Late D mass ex*nc*on Increase of ex-nc-on Decrease of origina-on Ma
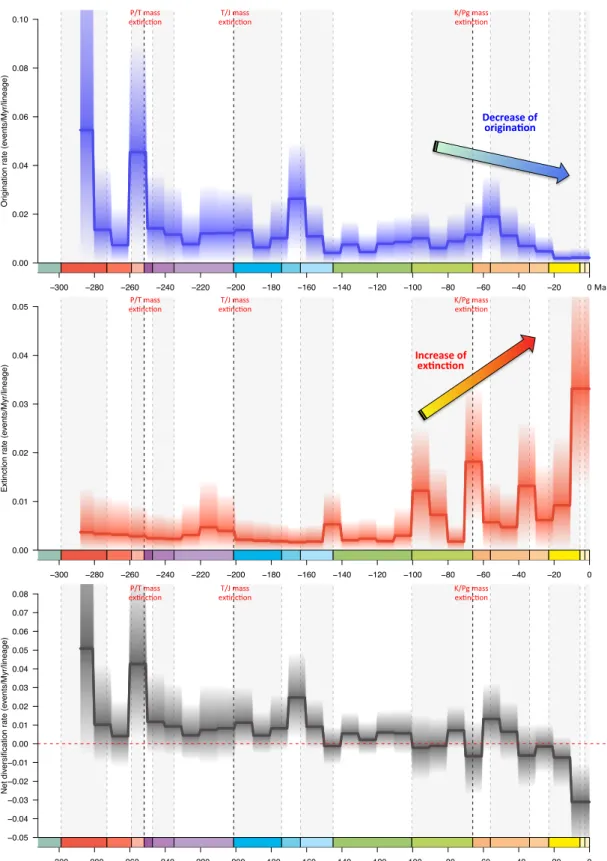
Fig. S3. Global diversification of conifers without the Cordaitales inferred from the fossil
record. Rates of origination (blue), extinction (red) and net diversification rates (black; the difference between origination and extinction) inferred from a fossil-based analysis at the genus level under the Bayesian approach implemented in PyRate using 10-million-year bins for constraining the episodic birth-death model. Solid lines indicate mean posterior rates and the shaded areas show 95% credibility intervals. The vertical dashed lines indicate the boundaries between geological boundaries and major mass extinction events.
Or igination r ate (e vents/Myr/lineage) −300 −280 −260 −240 −220 −200 −180 −160 −140 −120 −100 −80 −60 −40 −20 0 0.00 0.02 0.04 0.06 0.08 0.10 Extinction r ate (e vents/Myr/lineage) −300 −280 −260 −240 −220 −200 −180 −160 −140 −120 −100 −80 −60 −40 −20 0 0.00 0.01 0.02 0.03 0.04 0.05 Net div ersification r ate (e vents/Myr/lineage) −300 −280 −260 −240 −220 −200 −180 −160 −140 −120 −100 −80 −60 −40 −20 0 −0.05 −0.04 −0.03 −0.02 −0.01 0.00 0.01 0.02 0.03 0.04 0.05 0.06 0.07 0.08 P/T mass
ex*nc*on ex*nc*on T/J mass K/Pg mass ex*nc*on
P/T mass
ex*nc*on ex*nc*on T/J mass K/Pg mass ex*nc*on
P/T mass
ex*nc*on ex*nc*on T/J mass K/Pg mass ex*nc*on
Increase of ex,nc,on
Ma Decrease of
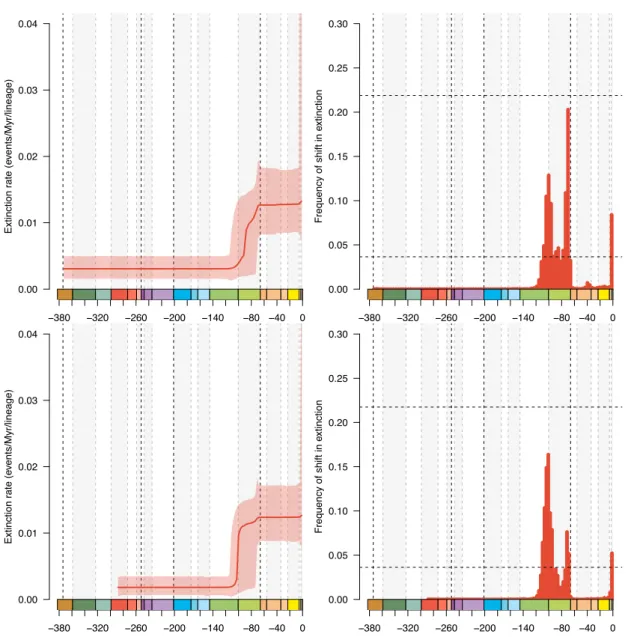
Fig. S4. Global extinction rate and shift times in extinction of conifers with (top panels) or
without (bottom panels) the Cordaitales inferred from the fossil record. Rates of extinction were inferred from a fossil-based analysis at the genus level under the Bayesian approach implemented in PyRate using the reversible-jump model for estimating the rates of diversification as well as the shift times of diversification. Solid lines indicate mean posterior rates and the shaded areas show 95% credibility intervals. The vertical dashed lines indicate the boundaries between geological boundaries and major mass extinction events.
Extinction r ate (e vents/Myr/lineage) −380 −320 −260 −200 −140 −80 −40 0 0.00 0.01 0.02 0.03 0.04 Frequency of shift in e xtinction −380 −320 −260 −200 −140 −80 −40 0 0.00 0.05 0.10 0.15 0.20 0.25 0.30 Extinction r ate (e vents/Myr/lineage) −380 −320 −260 −200 −140 −80 −40 0 0.00 0.01 0.02 0.03 0.04 Frequency of shift in e xtinction −380 −320 −260 −200 −140 −80 −40 0 0.00 0.05 0.10 0.15 0.20 0.25 0.30
Fig. S5. Impact of angiosperm diversity and temperature on conifer extinction. Changes in
angiosperm diversity do not correlate significantly with variations in speciation (A) but correlate positively with extinction rates (B), as shown by the posterior estimate of the correlation parameters. This leads to increase of extinction as angiosperms diversified (C). The variation of temperatures does correlate, although marginally, with speciation rate (D) and strongly correlates negatively with extinction rate (E). This leads to increase of extinction as the global climate became cooler in the Cenozoic (F). When histograms do not overlap with 0 (vertical dashed line), it denotes a significant correlation between the rate and the environmental variable, based on the 95% credibility intervals (CI).
A) Correlation between origination and angiosperms
P oster ior density −2.5 −2.0 −1.5 −1.0 −0.5 0.0 0.5 0 200 400 600 800 95% CI: −1.553 − 0.012
B) Correlation between extinction and angiosperms
−0.5 0.0 0.5 1.0 1.5 0 500 1000 1500 95% CI: 0.716 − 1.046 −400 −300 −200 −100 0 0.000 0.005 0.010 0.015 0.020
C) Diversification under angiosperm−dependence
Or
igination (b
lue) and e
xtinction (red) r
ates
D) Correlation between origination and temperature
P oster ior density −0.05 0.00 0.05 0.10 0.15 0 200 400 600 800 95% CI: 0.009 − 0.079
E) Correlation between extinction and temperature
−0.04 −0.02 0.00 0.02 0.04 0 500 1000 1500 2000 2500 95% CI: −0.027 − −0.014 −400 −300 −200 −100 0 0.00 0.01 0.02 0.03
F) Diversification under temperature−dependence
Time (Myrs ago)
Or
igination (b
lue) and e
xtinction (red) r
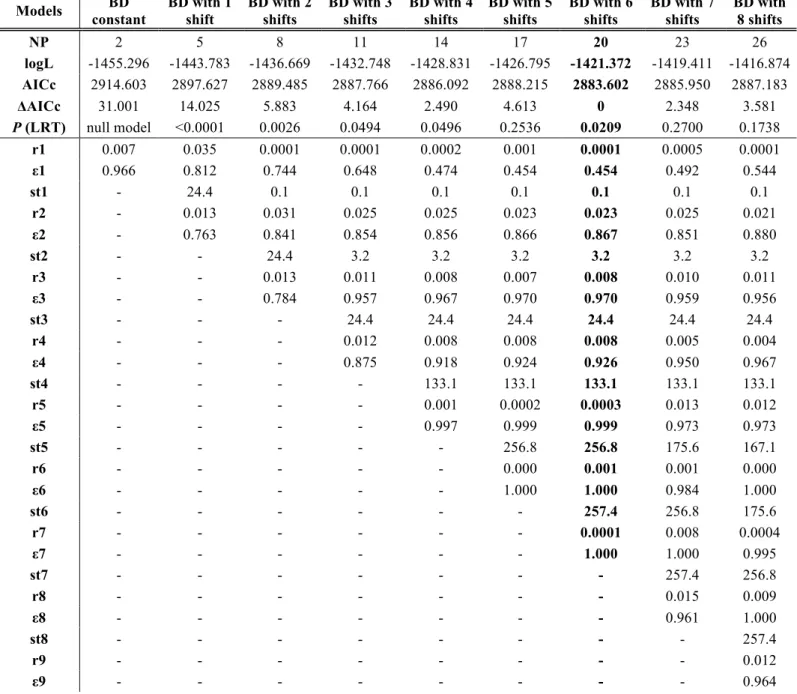
Table S1. Results and model selection from the episodic diversification analyses in conifers using TreePar.
A) Results for the conifer tree of Leslie et al. (2012).
Models BD constant BD with 1 shift BD with 2 shifts BD with 3 shifts BD with 4 shifts BD with 5 shifts BD with 6 shifts BD with 7 shifts BD with 8 shifts NP 2 5 8 11 14 17 20 23 26 logL -1455.296 -1443.783 -1436.669 -1432.748 -1428.831 -1426.795 -1421.372 -1419.411 -1416.874 AICc 2914.603 2897.627 2889.485 2887.766 2886.092 2888.215 2883.602 2885.950 2887.183 ΔAICc 31.001 14.025 5.883 4.164 2.490 4.613 0 2.348 3.581 P (LRT) null model <0.0001 0.0026 0.0494 0.0496 0.2536 0.0209 0.2700 0.1738 r1 0.007 0.035 0.0001 0.0001 0.0002 0.001 0.0001 0.0005 0.0001 ε1 0.966 0.812 0.744 0.648 0.474 0.454 0.454 0.492 0.544 st1 - 24.4 0.1 0.1 0.1 0.1 0.1 0.1 0.1 r2 - 0.013 0.031 0.025 0.025 0.023 0.023 0.025 0.021 ε2 - 0.763 0.841 0.854 0.856 0.866 0.867 0.851 0.880 st2 - - 24.4 3.2 3.2 3.2 3.2 3.2 3.2 r3 - - 0.013 0.011 0.008 0.007 0.008 0.010 0.011 ε3 - - 0.784 0.957 0.967 0.970 0.970 0.959 0.956 st3 - - - 24.4 24.4 24.4 24.4 24.4 24.4 r4 - - - 0.012 0.008 0.008 0.008 0.005 0.004 ε4 - - - 0.875 0.918 0.924 0.926 0.950 0.967 st4 - - - - 133.1 133.1 133.1 133.1 133.1 r5 - - - - 0.001 0.0002 0.0003 0.013 0.012 ε5 - - - - 0.997 0.999 0.999 0.973 0.973 st5 - - - 256.8 256.8 175.6 167.1 r6 - - - 0.000 0.001 0.001 0.000 ε6 - - - 1.000 1.000 0.984 1.000 st6 - - - 257.4 256.8 175.6 r7 - - - 0.0001 0.008 0.0004 ε7 - - - 1.000 1.000 0.995 st7 - - - - 257.4 256.8 r8 - - - - 0.015 0.009 ε8 - - - - 0.961 1.000 st8 - - - - - 257.4 r9 - - - - - 0.012 ε9 - - - - - 0.964
B) Results for the conifer tree of Leslie et al. (2018). Models BD constant BD with 1 shift BD with 2 shifts BD with 3 shifts BD with 4 shifts BD with 5 shifts BD with 6 shifts BD with 7 shifts BD with 8 shifts logL -2151.33 -2145.16 -2141.76 -2140.45 -2138.85 -2137.56 -2135.76 -2134.95 -2134.05 AICc 4306.68 4300.43 4299.77 4303.37 4306.45 4310.21 4313.03 4317.89 4322.65 ∆AIC 6.91 0.66 0.00 3.60 6.68 10.44 13.26 18.12 22.88 ωAIC 0.016 0.367 0.511 0.084 0.018 0.003 0.001 0.000 0.000 P (LRT) null model 0.0063 0.079 0.151 0.181 0.231 0.223 0.310 0.387 r1 0.0079 0.0017 0.0013 0.0013 0.0012 0.0010 0.0006 0.0006 0.0004 ε1 0.9502 0.9894 0.9895 0.9898 0.9902 0.9918 0.9955 0.9949 0.9971 st1 - 135 1 1 1 1 1 1 1 r2 - 0.0065 0.0019 0.0019 0.0019 0.0019 0.0014 0.0013 0.0012 ε2 - 0.9907 0.9893 0.9892 0.9894 0.9893 0.9924 0.9927 0.9933 st2 - - 135 128 124 37 37 24 24 r3 - - 0.0070 0.0001 0.0069 0.0010 0.0008 0.0030 0.0041 ε3 - - 0.9904 0.9891 0.9892 0.9921 0.9869 0.9867 0.9805 st3 - - - 135 128 124 44 37 37 r4 - - - 0.0070 0.0001 0.0117 0.0027 0.0011 0.0011 ε4 - - - 0.9899 0.9860 0.9784 0.9817 0.9835 0.9865 st4 - - - - 135 128 124 44 42 r5 - - - - 0.0059 0.0001 0.0056 0.0017 0.0001 ε5 - - - - 0.9923 0.9866 0.9892 0.9891 0.9868 st5 - - - - - 135 128 124 44 r6 - - - - - 0.0067 0.0001 0.0179 0.0032 ε6 - - - - - 0.9895 0.9692 0.9691 0.9780 st6 - - - - - - 135 128 124 r7 - - - - - - 0.0058 0.0001 0.0119 ε7 - - - - - - 0.9909 0.9754 0.9792 st7 - - - - - - - 135 128 r8 - - - - - - - 0.0058 0.0001 ε8 - - - - - - - 0.9914 0.9659 st8 - - - - - - 135 r9 - - - - - - 0.0063 ε9 - - - - - - 0.9904
Nine models are compared, and the best-supported model is the one with six rate shifts, as determined by the lowest AICc, ΔAICc and P (LRT). Adding more shifts of diversification did not significantly improve the likelihood of the model. Abbreviations are denoted as follows: BD, birth-death; NP, number of parameters; logL, log-likelihood; AICc, corrected Akaike Information Criterion; ΔAICc, the difference in AICc between the model with the lowest AICc and the others; and P (LRT), the p-value of the likelihood ratio test. Parameter estimates are denoted as follows: r, net diversification rate (speciation minus extinction); ε, turnover (extinction over speciation); st, shift time, in which ‘r1’ denotes the diversification rate and ‘ε1’ is the turnover, both inferred between Present and the shift time 1 (‘st1’).
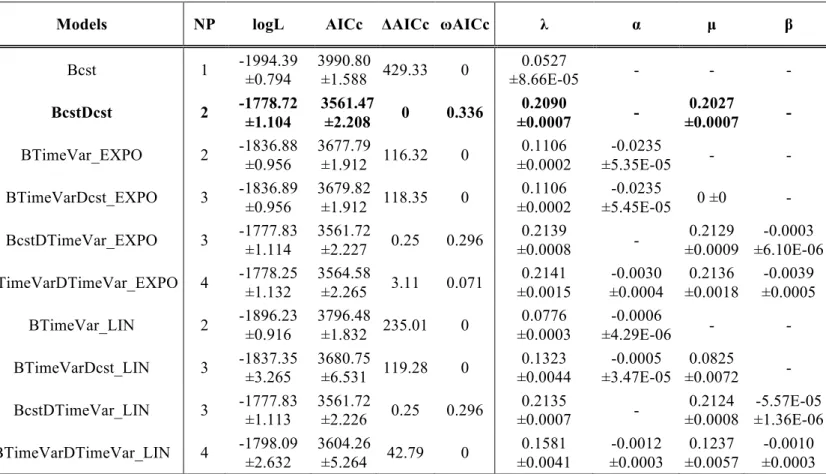
Table S2. Results of the time-dependent model of diversification on the conifers.
Models NP logL AICc ΔAICc ωAICc λ α µ β
Bcst 1 -1994.39 ±0.794 3990.80 ±1.588 429.33 0 ±8.66E-05 0.0527 - - - BcstDcst 2 -1778.72 ±1.104 3561.47 ±2.208 0 0.336 0.2090 ±0.0007 - 0.2027 ±0.0007 - BTimeVar_EXPO 2 -1836.88 ±0.956 3677.79 ±1.912 116.32 0 ±0.0002 0.1106 ±5.35E-05 -0.0235 - - BTimeVarDcst_EXPO 3 -1836.89 ±0.956 3679.82 ±1.912 118.35 0 0.1106 ±0.0002 -0.0235 ±5.45E-05 0 ±0 - BcstDTimeVar_EXPO 3 -1777.83 ±1.114 3561.72 ±2.227 0.25 0.296 ±0.0008 0.2139 - ±0.0009 0.2129 ±6.10E-06 -0.0003 BTimeVarDTimeVar_EXPO 4 -1778.25 ±1.132 3564.58 ±2.265 3.11 0.071 0.2141 ±0.0015 -0.0030 ±0.0004 0.2136 ±0.0018 -0.0039 ±0.0005 BTimeVar_LIN 2 -1896.23 ±0.916 3796.48 ±1.832 235.01 0 ±0.0003 0.0776 ±4.29E-06 -0.0006 - - BTimeVarDcst_LIN 3 -1837.35 ±3.265 3680.75 ±6.531 119.28 0 0.1323 ±0.0044 -0.0005 ±3.47E-05 0.0825 ±0.0072 -
BcstDTimeVar_LIN 3 -1777.83 ±1.113 3561.72 ±2.226 0.25 0.296 ±0.0007 0.2135 - ±0.0008 0.2124 ±1.36E-06 -5.57E-05
BTimeVarDTimeVar_LIN 4 -1798.09 ±2.632 3604.26 ±5.264 42.79 0 0.1581 ±0.0041 -0.0012 ±0.0003 0.1237 ±0.0057 -0.0010 ±0.0003 Models are as follows: Bcst has a constant speciation (Yule model); BcstDcst has both
constant speciation and extinction; BTimeVar has only speciation that varies through time; BTimeVarDcst has speciation that varies through time and constant extinction; BcstDTimeVar has constant speciation and extinction that varies through time; and BTimeVarDTimeVar has both speciation and extinction that vary through time. Speciation and/or extinction rates are allowed to vary exponentially (denoted by EXPO), or linearly (as indicated by LIN). Values are the means and standard errors calculated from the fit of maximum likelihood models on a random sample of 100 dated trees (obtained from the dating analysis). The delta AICc (ΔAICc) and Akaike weight (ωAICc) are used to compare all the models together to select the best-fit model. The best-fit model indicates a constant birth-death model better explains the conifer phylogeny (time-varying models did not improve significantly the likelihood). Abbreviations: NP, number of free parameters; logL, log- likelihood; λ, speciation rate; α, rate of variation of the speciation through time; µ, extinction rate; β, rate of variation of the extinction through time.
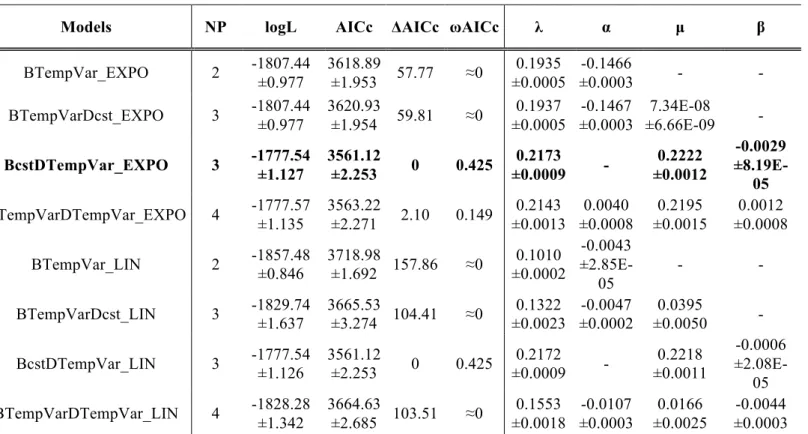
Table S3. Results of the paleotemperature-dependent model of diversification on the conifers.
Models NP logL AICc ΔAICc ωAICc λ α µ β
BTempVar_EXPO 2 -1807.44 ±0.977 3618.89 ±1.953 57.77 ≈0 0.1935 ±0.0005 -0.1466 ±0.0003 - -
BTempVarDcst_EXPO 3 -1807.44 ±0.977 3620.93 ±1.954 59.81 ≈0 ±0.0005 0.1937 ±0.0003 -0.1467 ±6.66E-09 7.34E-08 -
BcstDTempVar_EXPO 3 -1777.54 ±1.127 3561.12 ±2.253 0 0.425 0.2173 ±0.0009 - 0.2222 ±0.0012 -0.0029 ±8.19E-05 BTempVarDTempVar_EXPO 4 -1777.57 ±1.135 3563.22 ±2.271 2.10 0.149 ±0.0013 0.2143 ±0.0008 0.0040 ±0.0015 0.2195 ±0.0008 0.0012 BTempVar_LIN 2 -1857.48 ±0.846 3718.98 ±1.692 157.86 ≈0 ±0.0002 0.1010 -0.0043 ±2.85E-05 - - BTempVarDcst_LIN 3 -1829.74 ±1.637 3665.53 ±3.274 104.41 ≈0 0.1322 ±0.0023 -0.0047 ±0.0002 0.0395 ±0.0050 - BcstDTempVar_LIN 3 -1777.54 ±1.126 3561.12 ±2.253 0 0.425 ±0.0009 0.2172 - ±0.0011 0.2218 -0.0006 ±2.08E-05 BTempVarDTempVar_LIN 4 -1828.28 ±1.342 3664.63 ±2.685 103.51 ≈0 0.1553 ±0.0018 -0.0107 ±0.0003 0.0166 ±0.0025 -0.0044 ±0.0003 Models are as follows: BTempVar has only speciation that varies with past temperature;
BTempVarDcst has speciation that varies with past temperature and constant extinction; BcstDTempVar has constant speciation and extinction that varies with past temperature; and BTempVarDTempVar has both speciation and extinction that vary with past temperature. Speciation and/or extinction rates are allowed to vary exponentially (denoted by EXPO), or linearly (as indicated by LIN). Values are the means and standard errors calculated from the fit of maximum likelihood models on a random sample of 100 dated trees (obtained from the dating analysis). The delta AICc (ΔAICc) and Akaike weight (ωAICc) are used to compare all the models together to select the best-fit model. The best-fit model indicates a negative exponential correlation between extinction and past temperatures, suggesting that extinction decreased during warmer climate whereas extinction increased during cooler climate (there is no effect on speciation). Note that the second best-fit model is the same model but with linear dependency, and recovers the same result. Abbreviations: NP, number of free parameters; logL, log- likelihood; λ, speciation rate; α, rate of variation of the speciation according to the paleo-environmental variable; µ, extinction rate; β, rate of variation of the extinction according to the paleo-environmental variable.
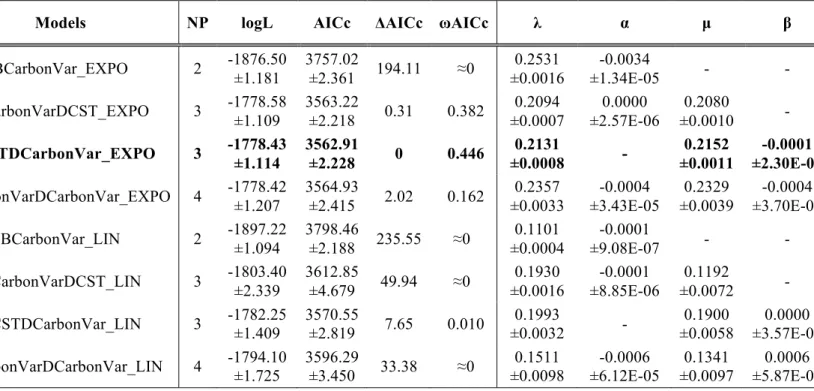
Table S4. Results of the atmospheric carbon-dependent model of diversification on the conifers.
Models NP logL AICc ΔAICc ωAICc λ α µ β
BCarbonVar_EXPO 2 -1876.50 ±1.181 3757.02 ±2.361 194.11 ≈0 ±0.0016 0.2531 ±1.34E-05 -0.0034 - - BCarbonVarDCST_EXPO 3 -1778.58 ±1.109 3563.22 ±2.218 0.31 0.382 0.2094 ±0.0007 0.0000 ±2.57E-06 0.2080 ±0.0010 - BCSTDCarbonVar_EXPO 3 -1778.43 ±1.114 3562.91 ±2.228 0 0.446 ±0.0008 0.2131 - ±0.0011 0.2152 ±2.30E-06 -0.0001 BCarbonVarDCarbonVar_EXPO 4 -1778.42 ±1.207 3564.93 ±2.415 2.02 0.162 0.2357 ±0.0033 -0.0004 ±3.43E-05 0.2329 ±0.0039 -0.0004 ±3.70E-05 BCarbonVar_LIN 2 -1897.22 ±1.094 3798.46 ±2.188 235.55 ≈0 ±0.0004 0.1101 ±9.08E-07 -0.0001 - - BCarbonVarDCST_LIN 3 -1803.40 ±2.339 3612.85 ±4.679 49.94 ≈0 0.1930 ±0.0016 -0.0001 ±8.85E-06 0.1192 ±0.0072 - BCSTDCarbonVar_LIN 3 -1782.25 ±1.409 3570.55 ±2.819 7.65 0.010 ±0.0032 0.1993 - ±0.0058 0.1900 ±3.57E-06 0.0000 BCarbonVarDCarbonVar_LIN 4 -1794.10 ±1.725 3596.29 ±3.450 33.38 ≈0 0.1511 ±0.0098 -0.0006 ±6.12E-05 0.1341 ±0.0097 0.0006 ±5.87E-05 Models are as follows: BCarbonVar has only speciation that varies with past atmospheric
carbon; BCarbonVarDcst has speciation that varies with past atmospheric carbon and constant extinction; BcstDCarbonVar has constant speciation and extinction that varies with past atmospheric carbon; and BCarbonVarDCarbonVar has both speciation and extinction that vary with past atmospheric carbon. Speciation and/or extinction rates are allowed to vary exponentially (denoted by EXPO), or linearly (as indicated by LIN). Values are the means and standard errors calculated from the fit of maximum likelihood models on a random sample of 100 dated trees (obtained from the dating analysis). The delta AICc (ΔAICc) and Akaike weight (ωAICc) are used to compare all the models together to select the best-fit model. The best-fit model indicates a negative exponential correlation between extinction and past atmospheric carbon concentration, suggesting that extinction decreased during warmer climate whereas extinction increased during cooler climate (there is no effect on speciation). Note that the second best-fit model is the same model but with linear dependency, and recovers the same result. Abbreviations: NP, number of free parameters; logL, log- likelihood; λ, speciation rate; α, rate of variation of the speciation according to the paleo-environmental variable; µ, extinction rate; β, rate of variation of the extinction according to the paleo-environmental variable.
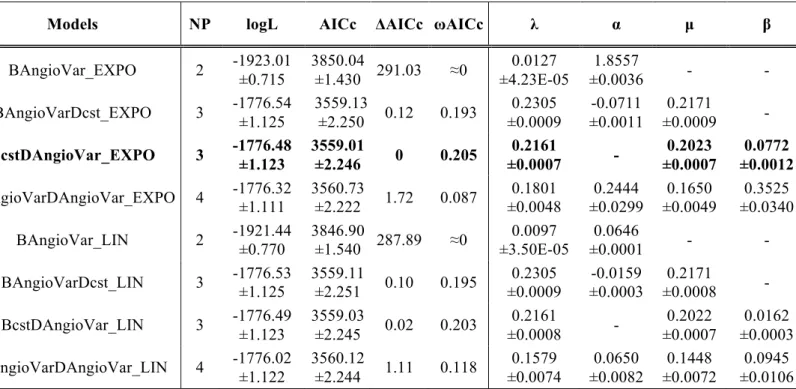
Table S5. Results of the angiosperm-dependent model of diversification on the conifers.
Models NP logL AICc ΔAICc ωAICc λ α µ β
BAngioVar_EXPO 2 -1923.01 ±0.715 3850.04 ±1.430 291.03 ≈0 ±4.23E-05 0.0127 ±0.0036 1.8557 - - BAngioVarDcst_EXPO 3 -1776.54 ±1.125 3559.13 ±2.250 0.12 0.193 0.2305 ±0.0009 -0.0711 ±0.0011 0.2171 ±0.0009 - BcstDAngioVar_EXPO 3 -1776.48 ±1.123 3559.01 ±2.246 0 0.205 ±0.0007 0.2161 - ±0.0007 0.2023 ±0.0012 0.0772 BAngioVarDAngioVar_EXPO 4 -1776.32 ±1.111 3560.73 ±2.222 1.72 0.087 0.1801 ±0.0048 0.2444 ±0.0299 0.1650 ±0.0049 0.3525 ±0.0340 BAngioVar_LIN 2 -1921.44 ±0.770 3846.90 ±1.540 287.89 ≈0 ±3.50E-05 0.0097 ±0.0001 0.0646 - - BAngioVarDcst_LIN 3 -1776.53 ±1.125 3559.11 ±2.251 0.10 0.195 0.2305 ±0.0009 -0.0159 ±0.0003 0.2171 ±0.0008 - BcstDAngioVar_LIN 3 -1776.49 ±1.123 3559.03 ±2.245 0.02 0.203 0.2161 ±0.0008 - 0.2022 ±0.0007 0.0162 ±0.0003 BAngioVarDAngioVar_LIN 4 -1776.02 ±1.122 3560.12 ±2.244 1.11 0.118 0.1579 ±0.0074 0.0650 ±0.0082 0.1448 ±0.0072 0.0945 ±0.0106 Models are as follows: BAngioVar has only speciation that varies with the proportion of
angiosperms; BAngioVarDcst has speciation that varies with the proportion of angiosperms and constant extinction; BcstDAngioVar has constant speciation and extinction that varies with the proportion of angiosperms; and BAngioVarDAngioVar has both speciation and extinction that vary with the proportion of angiosperms. Speciation and/or extinction rates are allowed to vary exponentially (denoted by EXPO), or linearly (as indicated by LIN). Values are the means and standard errors calculated from the fit of maximum likelihood models on a random sample of 100 dated trees (obtained from the dating analysis). The delta AICc (ΔAICc) and Akaike weight (ωAICc) are used to compare all the models together to select the best-fit model. The best-fit model indicates a positive exponential correlation between extinction and the proportion of angiosperms, suggesting that extinction increased when angiosperms diversified whereas extinction decreased during angiosperms were absent (there is no effect on speciation). Note that the second best-fit model is the same model but with linear dependency, and recovers the same result. Abbreviations: NP, number of free parameters; logL, log- likelihood; λ, speciation rate; α, rate of variation of the speciation according to the paleo-environmental variable; µ, extinction rate; β, rate of variation of the extinction according to the paleo-environmental variable.
Table S6. Results of all birth-death model of diversification on the conifer tree of Leslie et al. (2018).
Models NP logL AICc ΔAICc ωAICc λ α µ β
BCSTDAngioVar_LIN 3 -2148.64 4303.32 0.00 0.161 0.1642 - 0.1477 0.0175 BCSTDAngioVar_EXPO 3 -2148.64 4303.32 0.01 0.161 0.1642 - 0.1477 0.1117 BAngioVarDCST_EXPO 3 -2148.85 4303.74 0.42 0.131 0.1792 -0.0966 0.1636 - BAngioVarDCST_LIN 3 -2148.86 4303.76 0.44 0.129 0.1789 -0.0164 0.1635 - BAngioVarDAngioVar_EXPO 4 -2148.25 4304.57 1.26 0.086 0.1168 0.3501 0.1001 0.4996 BAngioVarDAngioVar_LIN 4 -2148.25 4304.58 1.26 0.086 0.1127 0.0565 0.0935 0.0750 BCSTDTimeVar_EXPO 3 -2150.14 4306.32 3.00 0.036 0.1628 - 0.1611 -0.0005 BCSTDTimeVar_LIN 3 -2150.15 4306.34 3.02 0.036 0.1626 - 0.1607 -0.0001 BTimeVarDTimeVar_LIN 4 -2149.21 4306.49 3.17 0.033 0.1647 -0.0005 0.1625 -0.0007 BCSTDCST 2 -2151.33 4306.68 3.36 0.030 0.1582 - 0.1503 - BCSTDTempVar_LIN 3 -2150.60 4307.23 3.92 0.023 0.1633 - 0.1639 -0.0005 BCSTDTempVar_EXPO 3 -2150.60 4307.24 3.92 0.023 0.1634 - 0.1642 -0.0032 BTimeVarDTimeVar_EXPO 4 -2149.95 4307.98 4.66 0.016 0.1647 -0.0029 0.1630 -0.0040 BCarbonVarDCST_EXPO 3 -2151.08 4308.21 4.89 0.014 0.1578 0.0001 0.1578 - BCSTDCarbonVar_EXPO 3 -2151.10 4308.23 4.92 0.014 0.1612 - 0.1609 -0.0001 BCSTDCarbonVar_LIN 3 -2151.10 4308.24 4.92 0.014 0.1611 - 0.1606 0.0000 BTempVarDTempVar_EXPO 4 -2150.62 4309.32 6.00 0.008 0.1653 -0.0121 0.1625 -0.0156 BTempVarDTempVar_LIN 4 -2154.74 4317.55 14.24 1.31E-04 0.1667 -0.0052 0.1474 -0.0050 BCarbonVarDCarbonVar_LIN 4 -2156.00 4320.07 16.76 3.72E-05 0.1979 -0.0001 0.1993 -0.0001 BCarbonVarDCarbonVar_EXPO 4 -2160.16 4328.40 25.08 5.77E-07 0.2595 -0.0012 0.2371 -0.0012 BTempVar_EXPO 2 -2173.29 4350.60 47.28 8.72E-12 0.1528 -0.1297 - - BTempVarDCST_EXPO 3 -2173.29 4352.62 49.30 3.18E-12 0.1527 -0.1296 0.0000 - BTempVarDCST_LIN 3 -2189.98 4386.00 82.68 1.79E-19 0.1070 -0.0045 0.0163 - BCarbonVarDCST_LIN 3 -2197.34 4400.72 97.40 1.14E-22 0.1470 -0.0001 0.0527 - BTimeVar_EXPO 2 -2202.55 4409.13 105.81 1.70E-24 0.0918 -0.0202 - - BTempVar_LIN 2 -2202.60 4409.21 105.89 1.64E-24 0.0913 -0.0039 - - BTimeVarDCST_EXPO 3 -2202.55 4411.15 107.83 6.20E-25 0.0918 -0.0202 0.0000 - BTimeVarDCST_LIN 3 -2211.73 4429.51 126.19 6.39E-29 0.0903 -0.0008 0.0251 - BTimeVar_LIN 2 -2234.40 4472.81 169.50 2.53E-38 0.0713 -0.0007 - - BCarbonVar_EXPO 2 -2244.92 4493.87 190.55 6.76E-43 0.1759 -0.0028 - - BCarbonVar_LIN 2 -2255.61 4515.24 211.92 1.55E-47 0.1043 -0.0001 - - BAngioVar_LIN 2 -2267.09 4538.19 234.88 1.61E-52 0.0140 0.0856 - - BAngioVar_EXPO 2 -2275.53 4555.08 251.77 3.45E-56 0.0132 1.6815 - - BCST 1 -2339.83 4681.66 378.35 1.13E-83 0.0487 - - -
Models are ranked according to the lowest AICc score and the highest Akaike weight (ωAICc). Model names: Bcst has a constant speciation (Yule model); BcstDcst has both constant speciation and extinction; BTimeVar has only speciation that varies through time; BTimeVarDcst has speciation that varies through time and constant extinction; BcstDTimeVar has constant speciation and extinction that varies through time; and BTimeVarDTimeVar has both speciation and extinction that vary through time. BTempVar has only speciation that varies with past temperature; BTempVarDcst has speciation that varies with past temperature
and constant extinction; BcstDTempVar has constant speciation and extinction that varies with past temperature; and BTempVarDTempVar has both speciation and extinction that vary with past temperature. BCarbonVar has only speciation that varies with past atmospheric carbon; BCarbonVarDcst has speciation that varies with past atmospheric carbon and constant extinction; BcstDCarbonVar has constant speciation and extinction that varies with past atmospheric carbon; and BCarbonVarDCarbonVar has both speciation and extinction that vary with past atmospheric carbon. BAngioVar has only speciation that varies with the proportion of angiosperms; BAngioVarDcst has speciation that varies with the proportion of angiosperms and constant extinction; BcstDAngioVar has constant speciation and extinction that varies with the proportion of angiosperms; and BAngioVarDAngioVar has both speciation and extinction that vary with the proportion of angiosperms. Speciation and/or extinction rates are allowed to vary exponentially (denoted by EXPO), or linearly (as indicated by LIN). Values are the estimated parameter for the maximum clade credibility tree of Leslie et al. (2018). The delta AICc (ΔAICc) and Akaike weight (ωAICc) are used to compare all the models together to select the best-fit model. The best-fit model indicates a positive linear correlation between extinction and the proportion of angiosperms, suggesting that extinction increased when angiosperms diversified whereas extinction decreased during angiosperms were absent (there is no effect on speciation). Note that the second best-fit model is the same model but with linear dependency, and recovers the same result. Abbreviations: NP, number of free parameters; logL, log- likelihood; λ, speciation rate; α, rate of variation of the speciation according to the paleo-environmental variable; µ, extinction rate; β, rate of variation of the extinction according to the paleo-environmental variable.
Table S7. Model selection for the conifer tree of Leslie et al. (2018) with the phylogeny-based diversification models.
Models NP logL AICc ΔAICc ωAICc λ α µ β
Bcst DTimeVar 3 -2150.14 4306.32 3.00 0.154 0.1628 - 0.1611 -0.0005
Bcst DTempVar 3 -2150.60 4307.23 3.92 0.098 0.1633 - 0.1639 -0.0005
BCarbonVar Dcst 3 -2151.08 4308.21 4.89 0.060 0.1578 0.0001 0.1578 -
Bcst DAngioVar 3 -2148.64 4303.32 0.00 0.689 0.1642 - 0.1477 0.0175
Four models are compared, and each was previously selected in reciprocal series of time-dependent models (a model with varying extinction, BcstDTimeVar, was the best-fit), or of temperature-dependent models (a model with varying extinction, BcstDTempVar, was the best-fit), or of atmospheric carbon-dependent models (a model with varying speciation, BCarbonVarDcst, was the best-fit), and of angiosperm-dependent models (a model with varying extinction, BcstDAngioVar, was the best-fit). Values are the estimated parameter for the maximum clade credibility tree of Leslie et al. (2018). The delta AICc (ΔAICc) and Akaike weight (ωAICc) allow comparing the models to select the best-fit model. The best-fit model is the model with the extinction rate positively correlated with the proportion of angiosperms, suggesting that extinction increased when angiosperms diversified whereas extinction decreased when angiosperms were absent (no effect on speciation). Abbreviations: NP, number of free parameters; logL, log- likelihood; λ, speciation rate; α, rate of variation of the speciation according to the paleo-environmental variable; µ, extinction rate; β, rate of variation of the extinction according to the paleo-environmental variable.