Prof. S. J. Mason R. W. Cornew K. R. Ingham Prof. M. Eden J. E. Cunningham L. B. Kilham Prof. T. S. Huang E. S. Davis E. E. Landsman Prof. O. J. Tretiak R. W. Donaldson F. F. Lee
Prof. D. E. Troxel J. K. Dupress R. A. Murphy
Dr. P. A. Kolers C. L. Fontaine Kathryn F. Rosenthal C. E. Arnold A. Gabrielian F. W. Scoville
Ann C. Boyer G. S. Harlem N. D. Strahm
J. K. Clemens Y. Yamaguchi
A. COGNITIVE PROCESSES
1. PROTRACTED PRACTICE ON DECODING SPATIALLY TRANSFORMED TEXT In our previous reports 1 we have shown that spatially transformed text is not all of a kind: logically and mathematically equivalent transformations are not read with equal facility; they load down the perceptual system differentially, not equally. These results suggest that the thresholds for recognizing static forms, which are found to be different for different orientations,2 may be but a special case of a more general phenomenon of processing serially presented information. That is, the differences found for static identifications may in fact have nothing to do with orientation per se; but, rather, are part of a temporally organized sequence in which processing an array is one of n acts which the observer performs.
These speculations are suggested in part by the results presented here. We had found previously in the course of eight days of testing, college students read different kinds of spatially transformed text at different speeds, and acquired skill in the tasks at different rates. The data, however, were still in the course of change at the end of eight days. In order to find where the curves flattened out, eight subjects were tested for twenty-five days each, and those results are described here.
Our method was to have each of eight right-handed, right -eyed subjects read one of each of eight pages of text on each of twenty-five testing days, the first day being used only for practice. The order in which the materials were read was dictated by a Latin square, so that every kind of transformation was preceded and followed by every other kind the same number of times. The results, illustrated by Fig. XVII-1, reveal clear trends in the data. The upper part of the figure shows that the transformations are dif-ferentially difficult at the outset, but that skill in decoding inversion is obtained quickly. The lower part of the figure demonstrates that a single transformation added to
This work is supported in part by the National Science Foundation (Grant GP-2495), the National Institutes of Health (Grant MH-04737-05), and the National Aeronautics and Space Administration (Grant NsG-496); and through the Joint Services Electronics Pro-gram by the U. S. Army Research Office, Durham.
(BAcK G ou N D)
,, a
e o
V)
n
qo U
1 -3,4 A 9)
lIII 111111 IIIx NORMAL
A ROTATION
oINVERSION
o
REFLECTION
' I7
I
0
2
4 6
8
10
12
14
16 18 20 22 24
SUCCESSIVE DAYS
l PAO
U
1,)(D
W
no KeKc v
3)
(%a4--)
5v
on
Na)
(DNo
R&KCA B)
REVERSAL
x
NORMAL
a
ROTATION
o
INVERSION
oREFLECTION
I I I I I I I I I I I I I I l I I I I4
6 8
10 12 14 16 18
SUCCESSIVE DAYS
Fig. XVII- 1.
20 22 24
Results of
tests.
uJ
z
W
0
5-
4-2K
7K
LU
LU
5
4
3-2
I
O)
I
8r-others does not produce an equivalent effect upon them. Reversing letters makes Rotation the most difficult transformation to read.
If we superimpose the curves, interesting groupings emerge. At the outset of testing, transformations N, N + Rev, and Ro can be classed separately; In and In + Rev form a group; and Ref, Ref + Rev, and Ro + Rev form another group, the last having
overtaken Ro. With the exception of Ro, all of the transformations that read left to right are read more quickly than those from right to left. The special place of Ro in decoding transformations is still unclassified.
P. A. Kolers, Ann C. Boyer, Kathryn F. Rosenthal
References
1. P. A. Kolers, M. Eden, Ann Boyer, "Reading as a Perceptual Skill," Quarterly Progress Report No. 74, Research Laboratory of Electronics, M. I. T. , July 15,
1964, pp. 214-217.
2. N. S. Sutherland, "The Methods and Findings of Experiments on the Visual Dis
-crimination of Shape by Animals," Experimental Psychology Society Monographs No. 1, 1961.
B. PICTURE PROCESSING
1. OPTIMUM BINARY FIXED-LENGTH BLOCK CODES
Statement of the Problem
We wish to transmit one of m = 2n equally probable integers 0, 1, ... , m-1 through a constant binary symmetric channel with error probability p. The code word for each integer will be a sequence of n binary digits. No two different integers can have the same code word.
The number of binary code words of length n is equal to 2n = m. Any code word can be assigned to any one of m possible integers. The total number of possible codes is therefore m! The problem that we are investigating is the following: Which among all these possible codes are optimum in the sense that they give the minimum mean-square error or average noise power.
Summary of Results
Some of the results that we have obtained are summarized below in the form of the-orems.
DEFINITION 1. If the input integer (that is, the transmitted integer) is i, and the output integer (that is, the received integer) is j, then the difference eij = i -
j
is called the error or noise.(XVII. COGNITIVE INFORMATION PROCESSING)
DEFINITION 2. The mean-square error or average noise power is defined as
2
e
.2
e
= e..= (i-j ,
1J
where the average is over all possible i and j.
DEFINITION 3. If the error probability p is small, then it is reasonable to assume that in any transmitted code word, only single error may occur. Under this assumption,
2
the mean-square error or average noise power will be denoted el, which is called the single-error mean-square error.
DEFINITION 4. A natural code is a code in which the code word for each integer is the binary representation of that integer.
DEFINITION 5. A "gray" code is a code in which the code words for any two suc -cessive integers differ in one and only one bit.
THEOREM 1. For a natural code, the mean-square error is
e2 = 1 (4n-1)p, (1)
and the single-error mean-square error is 2 1 n
-n-e 2=
-((4n-1)
p. (2)THEOREM 2. For a gray code, the single-error mean-square error is
2
1
n+i
n-i
el2 =91 (4n+ -4-3n) p(l-p)n-. (3)
THEOREM 3. Among all codes, the maximum single-error mean-square error is
2 = [n(4n-1)-4+n - 1 1 )n-. (4)
THEOREM 4. The average mean-square error (averaged over all codes weighted with equal probability) is
2 1
e = m(m+1)[1-(l-p)n]. (5)
The average single-error mean-square error is
2
1
n-i
el = m(m+1) np(l-p)n . (6)
THEOREM 5. Among all codes, the natural code gives the minimum single-error 2
2
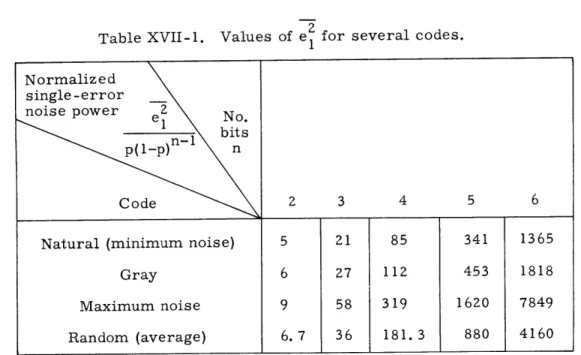
Table XVII-1 gives some numerical values of el for purposes of comparison.
Table XVII- 1.
Values of el for several codes.
2
1
We remark that it is our conjecture that the natural code also gives the minimum
2
e
;
but we have not yet been able to prove it.
Future Work
The study of the present problem was motivated by considerations of digital picture
transmission. In transmitting pictures by pulse-code modulation, the integers
corre-spond to the brightness levels of the picture points.
In connection with the application
of the results in the preceding section to picture transmission, two questions arise:
(i) How good is the assumption that all input integers (brightness levels) are equally
probable? What are the effects of nonequal probabilities of the input integers on the
mean-square error? (ii) For a picture-transmission system, one is usually interested
in how good the received picture looks.
Does the picture with minimum mean-square
error look best? These questions are being investigated.
Y. Yamaguchi, T. S. Huang
2.
SUBJECTIVE EFFECT OF SPATIAL AND BRIGHTNESS QUANTIZATION
ON PICTURE QUALITY
Introduction
The communication of pictures requires transmission of large quantities of
infor-mation and, consequently, large channel capacity to provide received pictures containing
Normalized
single-error
noise power
2
No.
-
bits
n-1
p(l-p)
n
Code
2
3
4
5
6
Natural (minimum noise)
5
21
85
341
1365
Gray
6
27
112
453
1818
Maximum noise
9
58
319
1620
7849
(XVII. COGNITIVE INFORMATION PROCESSING)
essentially the same amount of information as in the source pictures.
Digital transmission of pictures, employing conventional coding methods such as
pulse-code modulation, is an example of a system that requires large channel capacity.
A considerable amount of experimental effort has been expended in trying to devise
coding methods that will reduce the required channel capacity for digital picture
trans-mission.
To provide basic information that may be useful in further studies of
channel-capacity requirements for digital picture transmission, a series of subjective tests
con-cerning picture quality has been performed.
The object of these tests was to determine
the basic factors affecting picture quality, as judged by human observers. Of particular
interest was the trade-off between the effect of spatial quantization and brightness
quan-tization.
Curves of constant picture quality resulting from these tests are compared
with curves of constant picture bit rate.
Pictures Tested
Three monochrome pictures, which had been digitally recorded with our laboratory
equipment, were used in the studies.
Details of the recording equipment have been
dis-cussed in previous reports.
It suffices to note that the recording was done with signals
linearly proportional to picture brightness at 256
X
256 spatial points per picture. Three
pictures were used so that a spectrum of picture types would be tested: (i) great detail
-a crowd; (ii) medium det-ail
-
a scene with a cameraman as a central object; (iii) small
detail - a face.Using the TX-0 computer at M.I.T., we reduced the number of bits in these pictures
by increasing the sizes of spatial and brightness quantization levels.
One set of pictures
for testing was produced by simple elimination of bits.
This set is called "basic
pic-tures" in the discussions here.
For these pictures the spatial quantization size was
increased by replacing an eliminated spatial point by the previously noneliminated spatial
point.
Brightness quantization size was increased by replacing eliminated brightness
levels with the next darker level. We used 256 x 256, 128 X 128, and 64 X 64 spatial
points with 64, 43, 32,
22,
and 16 brightness levels.
A second set of pictures was produced by using the same technique for increasing
quantization size while simultaneously adding binary symmetric noise.
The binary
sym-metric noise was created by changing each bit of information in the digital picture (a one
to a zero, a zero to a one) with probability 0. 02.
The variance of this noise was
calcu-lated on the computer and was found to be 27 brightness levels for the cameraman, 29
for the face, and 28 for the crowd.
A third set of pictures was produced by using the same technique for brightness
quantization as for the basic pictures.
The spatial quantization size was increased by
replacing an eliminated point with an average of the surrounding noneliminated points.
This set is called "averaged pictures" in the discussions here. grammatically shows the quantization techniques.
Figure XVII-2
dia-C ---X --- X--X X--X-X--X 1--..X---X--X
a
X-- X
-- X
HORIZONTAL
DIRECTION
(a)
Fig. XVII-Z.
Spatial quantization. (a) Basic, 64 spa-tial points from 256. (b) Average, 64 spatial points from 256. (a, b, c, d indi-cate retained points; x, a removed point; arrow, direction of replacement. If two points are shown replacing one, the aver-age of the two was used.)
C
-'x----x-~--'s-dY
(b)
HORIZONTAL
DIRECTION
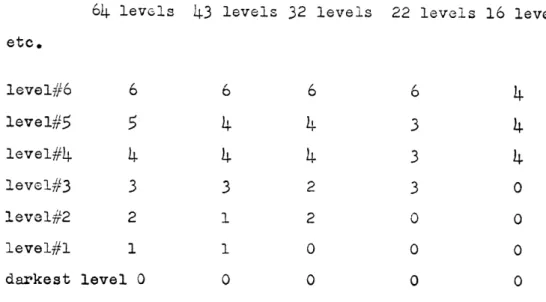
Figure XVII-3 shows examples from the sets of pictures. The effect of the bright-ness quantization is false edges and dark areas that obscure detail. The effect of the spatial quantization in the basic pictures is a square look to certain picture areas. The effect of the spatial quantization in the average pictures is lack of resolution of edges.
It should be noted that the technique of picture reproduction on the TX-0 computer, for which only one intensity level of display is available, used time integration on the photographic film to produce multiple brightness levels. Because of the logarithmic characteristic of film exposure with exposure time, the transfer curve between digital signal level and picture brightness, which is stepwise linear, has the effect of bright-ness quantization accentuated for the darker levels.
(XVII. COGNITIVE INFORMATION PROCESSING)
64 levols 43 levels 32 levels 22 levels 16 levels
etc.
level#6
6
6
6
6
4
level#5
5
4
4
3
4
level#4
4
4
4
3
4
level#3
3
3
2
3
0
level#2
2
1
2
0
0
level#1l
1
1
0
0
0
darkest level 0
0
0
0
0
Fig. XVII-3.
Brightness quantization.
C-Tests Performed
A rank-ordering test (see Kendall ) was used for subjective testing of the pictures.
Observers (6 took part in the basic-picture tests, 5 in the others) were asked
independ-ently to view each set of pictures at distances of 5, 10, and 15 times the picture height.
The observers were asked to rank the pictures from least objectionable to most
objec-tionable with the instruction, "Please rank the pictures according to your preference
for watching on your television set. If you cannot indicate a preference among several
pictures, rate each picture the same." The picture ranks from the tests were assigned
integer values from 1 for the best picture to 15 for the worst.
The data varied from observer to observer, because of psychophysical noise. A
sta-tistical coefficient of agreement (concordance) was calculated to determine consistency
among observers.
This coefficient
2can vary from 0 to
1
when 1 would result if the
opinions of all observers were in agreement.
The expected value for uncorrelated
opin-ions is 0. 167 for 6 observers, and 0.
2
for 5 observers, with a variance of less than
0. 01.
The coefficients resulting from the tests were between 0. 6 and 0. 97.
With this assurance of consistency, the data for each test (one original picture, one
viewing distance) were smoothed by adding the ranks as judged by each observer. The
picture with the smallest sum was considered to be the best picture and assigned rank 1,
and so forth. If two pictures had equal sums, the ranks were split between the two.
This method is justified by assuming that the psychophysical noise is independent. The
summing technique reduces the variance of the noise.
To evaluate the results, the ranks were plotted on the brightness level-spatial point
plane. Lines were drawn through points of equal rank and resulted in isopreference curves.
Summary of Results
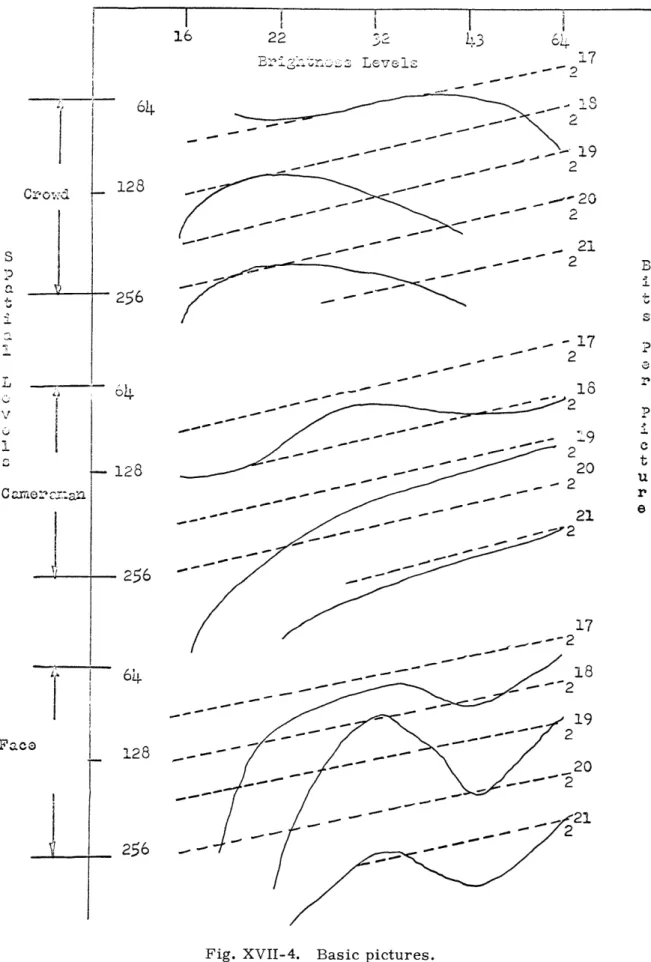
The results of the tests, presented in Figs. XVII-4, XVII-5, and XVII-6, should be considered qualitative, rather than quantitative. The results were purely experimental, and although agreement among observers was high, they necessarily reflect the judgment of a limited number of observers.
The isopreference curves for each viewing distance were separately plotted on the spatial point-brightness level plane. With the exception of minor details, the results were only weakly dependent on viewing distance. Therefore, again by summing ranks, the curves that are independent of viewing distance were formed. Note that although the curves do not depend on viewing distance,they do depend to a great extent on picture type. a. Basic Pictures
Figure XVII-4 shows the results of the tests on the set of pictures referred to as basic pictures. Curves of constant picture information are shown for comparison. Note that the curves are plotted with logarithmic coordinates. The isopreference curves for the face indicate that 43 brightness levels cause a large decrease in picture quality.
Dis-cussions with the subjects indicate that this effect is due to large areas of brightness error. Figure XVII-3 shows that for 43 levels, errors are made at level 2, level 5, and so forth. Since level 2 and level 5 cover large areas of this picture, errors in these levels cause a large decrease in picture quality. This leads to the conclusion that for the portrait type of picture with this scheme of quantization, brightness information may be eliminated without quality degradation. Simply increase brightness quantization only
in areas of varying brightness. Of course, this requires a knowledge of the picture sta-tistics. Note also that for the face if the brightness levels are reduced below 32 levels,
rapid quality deterioration with increasing spatial quantization results.
The isopreference curves for the cameraman essentially follow curves of constant picture information until the brightness levels are reduced below 22. Here the afore-mentioned rapid deterioration with increasing spatial quantization results.
The isopreference curves for the crowd show a reverse slope as brightness levels are reduced. (Reducing brightness increases preference!) From the subjects' com-ments it was determined that this increase of preference as brightness levels decrease results from brightness quantizing errors increasing contrast in the picture. This effect seems quite important, as it indicates that in pictures with great detail such as the crowd, only a few brightness levels need be used as long as brightness quantization
increases contrast.
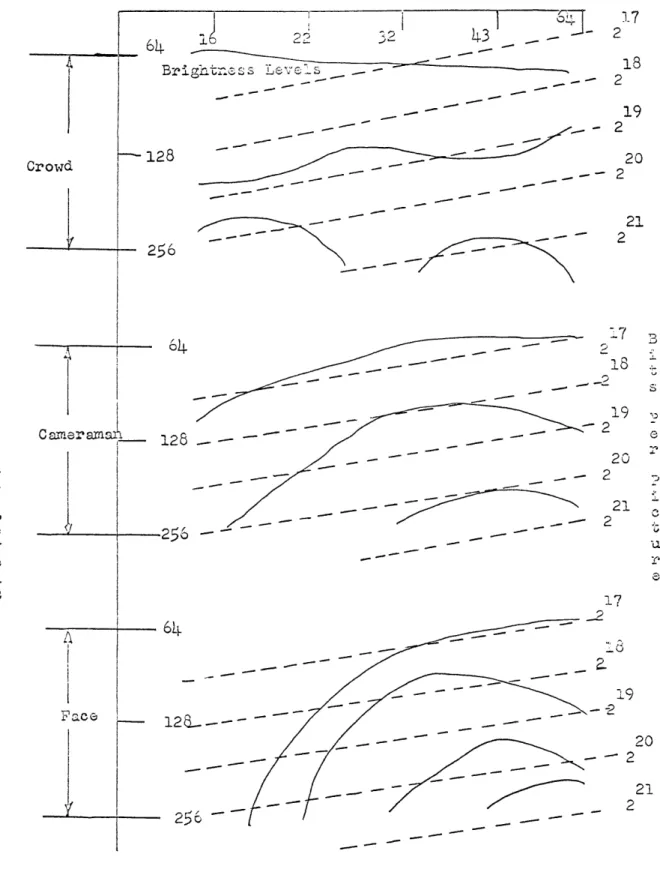
b. Pictures With Binary Symmetric Noise Added
Figure XVII-5 shows the results of the tests for the picture set with binary symmet-ric noise added.
ELS6r..s.z
Lov~L"
tL
- 5...
2
- 19 -- 2 --- 20
2
21
CrGw
-
17
2
C m
a0v.:-an
128
-256
64
128
256
Fig. XVII-4. Basic pictures.
64
128
18p
:9
20
u
21
e
-c
c c cFace
256
64
2
-
I
vC anaer an a
1
Face
L
2
2
21
-- 217
2
- -P19
r20
22
"
2
17
2
18
2
19
2
20
21
-
128
-
256
Fig. XVII-5.
Pictures with binary symmetric noise.
128
Ct=oril3
a
Crowd
F ac e
1
2
S18 Brightne ,s Levels s 2 192
8 S21
2206
-2
-
7
B
-- S128
12&8-256
Fig. XVII-6. Averaged pictures.
-7
20
20
21
2
u-1919
-- 2
-c cFor the face, the effect of large areas of brightness error as experienced in the
basic pictures is eliminated.
This apparently results from the noise adding brightness
variation to these areas.
The noise increases the quality deterioration with increasing
spatial quantization over that experienced for the basic pictures.
The isopreference curves for the cameraman, with the exception of details of curve
slope, again essentially follow curves of constant picture information.
The noise accentuated the reverse slope of the isopreference curves for the crowd.
This results from the noise increasing the subject's desire for contrast in this type of
picture.
c.
Average Pictures
Figure XVII-6 shows the results of the tests on the picture set referred to as
aver-aged pictures.
The curves for the face show that the subjects' dislike of 43 brightness levels
dis-cussed above has been eliminated. Also an increasing preference with decrease in
brightness levels is observed for brightness levels between 64 and 32 and spatial points
between 256 and 128.
The curves for the cameraman are very similar to those for the face, thereby
indi-cating that the spatial averaging tends to remove some of the effects of the different
amounts of detail in the pictures.
The crowd pictures again show the effect of the subjects' desire for increased
con-trast, but only for 128 or less spatial points.
The subjects' comments on these
pic-tures indicate that the spatial averaging made it very difficult to determine preferences
among the various pictures in the crowd set at distances of 10X and 15x picture height.
F. W. Scoville
References
1. J. E. Cunningham, U. F. Gronemann, T. S. Huang, J. W. Pan, O. J. Tretiak,
and W. F. Schreiber, "Laboratory Equipment," Quarterly Progress Report No. 64,
Research Laboratory of Electronics, M.I.T., January 15, 1962, pp. 174-175;
Quar-terly Progress Report No. 65, April 15, 1962, pp. 145-146.
2.
M. G. Kendall, The Advanced Theory of Statistics, Vol. 1 (Charles Griffin and
Company, London, 1943).
C.
SENSORY AIDS
1. INFORMATION RATES FOR MULTIDIMENSIONAL,
MULTIMODALITY SENSORY
STIMULI
Introduction
The way in which messages are coded into sensory stimuli affects the speed and
accuracy with which the messages are transmitted to a human. Determination of the
(XVII. COGNITIVE INFORMATION PROCESSING)
properties of favorable coding schemes would be of considerable value to those wishing
to send messages at a rate that requires efficient coding for accurate transmission. A
necessary condition for fast, accurate transmission is that the stimuli be easily
identi-fiable.
Several experimenters have demonstrated that the way to make stimuli easily
identifiable in an absolute judgment situation is to allow the stimuli to vary along
sev-1-6
eral stimulus dimensions.
The rate at which the stimuli were identified was not
measured.
Furthermore, the stimuli varied along dimensions of only one sense. In
order to determine the rate at which multidimensional, multimodality stimuli can be
identified, an experimental system that could simultaneously excite the auditory, tactile,
and kinesthetic senses was designed and constructed.
Experimental System
A block diagram of the over-all system is shown in Fig. XVII-7.
The computer
con-verts messages stored in its memory into hole patterns on punched paper tape, in
accordance with a sequence of programmed instructions.
These hole patterns are
trans-formed into binary voltage levels by a variable-speed tape reader. The logic circuits
routes these voltage levels to a bank of one-shots, which were triggered by a positive
level change.
The triggering of a one-shot results in a change in its state. This change
causes an auditory, tactile or kinesthetic switch to open for the duration of the state
change.
The opening of a switch results in the appearance of an auditory, tactile or
kinesthetic stimulus.
The auditory portion of the stimulus display consists of a pair of PDR-8 earphones.
COMPRESSED AIR
SWTCH
SOLENOIDS
D
ISPLAYLOGIC TACTILE TACTILE POKE
CIRCUITS ONESHOTS SWTC SOLENOIDS PROBES
Fig. XVII-7.
AUDITORYUSWITCH EARPHONESExperimental
Each earphone can be excited independently of the other.
The tactile portion of the display consists of air-operated poke probes. The probes are activated by solenoids that regulate the air flow. The probes and solenoid air valves were designed by Troxel, and have been described in detail in his doctoral thesis.7
The kinesthetic part of the display is shown in Fig. XVII-8. To each finger a probe casing that rests in a loosely fitting sleeve is taped. Electric current in a solenoid winding causes the solenoid armature to move downward. This downward motion of the armature results in a downward movement of the sleeve. The time required by the sleeve to complete its downward motion and its upward motion for fixed values of sole-noid current and finger load depends on the moment of inertia of the moving part about its axis of rotation, and on the spring constant of the return spring. Solenoid currents used in our experiments resulted in fall times that were less than 10 msec, and in rise times of approximately 50 msec. The reason for taping the probes to the fingers is to minimize the tactile stimulation that must necessarily result when an external force acts to move a finger. The hand rest was designed in such a way that the moving part of the hand would encounter only air resistance. In the opinion of the subjects, the dominant sensation resulting from a motion of one or more fingers was kinesthetic.
A major requirement of the over-all system was that it be flexible. This flexibility was achieved by designing the system in such a way that most of the stimulus parameters could be changed easily. Modification of a few instructions on the computer program, for example, allows the message probabilities, the number of messages in a group, the number of lines of blank tape between the groups, and the total number of messages on a test tape to have any values desired. The rate at which the messages can be sent depends on a dial setting on the tape reader, which can read up to 20 characters per sec-ond. The duration of each stimulus is governed by adjusting potentiometers one-shots. Other auditory stimulus variables are controlled by dials on the audio energy sources. The intensity of each tactile stimulus is controlled by an air valve. The intensities of the kinesthetic stimuli can be varied by changing the lengths of the wires that con-nect the solenoids and the finger-moving portion of the system. The flexibility of the over-all system was sufficient to allow all of the desired experiments to be performed easily.
Experiments
Subjects were required to verbally identify stimuli from different stimulus en-sembles. Each ensemble contained 8 stimuli. The chart in Fig. XVII-9 gives a com-plete description of all of the ensembles. Ensemble 1 consisted of 8 pure tones that were identical except for differences in frequency. The tones were spaced in equal log-arithmic steps between 700 cps and 8000 cps. Ensemble 2 consisted of a tactile
LOOSELY
FITTING,
SLEEVE
HAND
REST
COMPRESSED
AIR
PULL
DOWN
WIRE
Stimulus Stimulus Number 1 2 3 4 5 6 7 Number tlk1 t2k2 3k3 t4k4 t5k5 t6k t7k7 t8k8 t fltl f2t2 S2 2 3t3 f4t4 f4t5 ft6S5 5 ft 7t7 ft 8 flkl f2k2 f3k3 4k4 f5k5 f k6 f7k7 f8k8552k f 3k3
664k
f 5k5 776k f 7k 7 fltlk 1 f2t2k2 f3t3k3 f4t 4k4 f5 t5k5 f6 6k f7t 7k7 ft 8k8 8 e ds f e dsf h ed f edf erd f erds fh erd sf h erd df h 9 ti 1 tt tlt3 tltt 4 1 2 tt 2 10 11 12 13 14 t 1 tlt7 1 7 tlt1 55 tt 3 tlt3t 7 1 3 7 ttt5 7tx: tactile stimulation of finger x
kx: kinesthetic stimulation of finger x
The fingers are numbered consecutively from left to right, thumbs excluded.
f8 - 8000 cps d S d k d kk 4 t2ds t2dsk4 t2d t2d Pk4 d dsks77 dk d k7 3ds t3dsk7 t3d t3d kt32fk77
Fig. XVII-9. Description of the stimulus ensembles.
- 707 cps - 1000 cps - 1414 cps fp - 1000 cps fh - 3000 cps d - 30 ms s d - 150 ms ep - left ear e r- right ear r
(XVII. COGNITIVE INFORMATION PROCESSING)
stimulation on the end of each finger. Only one finger was poked at any one time. Ensemble 3 consisted of a kinesthetic stimulation of one of 8 fingers. The stimuli of ensembles 4, 5, 6, and 7 were redundant combinations of stimuli from the first three ensembles. Ensemble 8 consisted of pure tones that varied in frequency, duration, and the ear that was stimulated. Ensembles 9 and 10 consisted of a tactile stimulation of the little finger of the left hand (finger 1), and a simultaneous poking of none, one, two or three other fingers. The stimuli of ensembles 11 and 12 were kinesthetic, rather than tactile. The stimuli of ensembles 13 and 14 simultaneously excited the auditory, tactile, and kinesthetic senses. The tones were of different duration; one finger was
either poked or not poked; and a different finger was either moved or not moved. Each day, subjects were required to identify 5 groups of 30 stimuli from several of the ensembles. On the first day, all stimuli were presented at a rate of one every two
seconds. The stimulus rate on succeeding days was such that the probability of error was approximately 20%. The results for the last 5 days, averaged over all subjects,
are listed in Table XVII-2.
An analysis of the resulting errors is summarized in the following statements. 1. The most difficult tones to identify in ensemble 1 were those in the middle of the frequency range. The easiest were those on the ends.
Table XVII-2. Information rates and probabilities of error.
Minimum Maximum Average
Ensemble I(X;Y)(bits/ P(e) Stimulus Stimulus Stimulus
Number stimulus) Rate (per Rate (per Rate (per
second) second) second)
1 .9 .71 .50 . 50 .50
2
5.
5
.18
1.98
2.09
2.04
3 4.9 .19 1.79 1.89 1. 854
6.
2
.17
2.08
2.22
2. 15
5
5.4
.18
1.95
2.04
2.00
6 4.9 .20 1.82 1.91 1.877
6. 1
.17
2.02
2.22
2. 13
8 2.7 .20 1.06 1. 14 1. 10 9 4.5 .18 1. 61 1.72 1. 6710
5.0
.19
1.79
1.90
1.86
11 4.0 .17 1.45 1. 61 1. 52 12 4.6 .17 1.63 1.79 1.70 13 3.0 .20 1. 14 1.21 1. 18 14 3.1 .19 1. 19 1.24 1. 222.
Identification of tactile and kinesthetic stimuli is easiest when one or two fingers
are stimulated, and most difficult when several fingers are stimulated.
3. Confusion of stimuli that excite fingers on opposite hands rarely occurs.
4.
Nearly all of the errors which resulted from identifying stimuli of ensembles 8,
13, and 14 resulted from incorrect identifications along the auditory dimension of
dura-tion.
These experiments were followed by others.
Subjects were required to identify one
of four and one of two equiprobable stimuli from several of the ensembles described in
Table XVII-2.
At any fixed rate, the probability of error increased with the number of
alternative stimuli. The increase was smaller, the larger the number of dimensions
along which stimuli varied.
When motor responses to the 8 equiprobable stimuli of ensemble 8 replaced verbal
responses, the rate at which the tones could be correctly identified 80% of the time
increased approximately 40%.
In ensembles 13 and 14, variation along the auditory dimensions of duration was
aug-mented by perfectly correlated variations in frequency and the ear that was stimulated.
As a result, the rate at which stimuli could be identified with 80% accuracy increased
35%.
Attempts were made to increase the information rate of ensembles 8, 9, and 13 by
changing some of the stimulus parameters.
First, the frequencies of the tones of ensemble 8 were changed from 2000 cps and
3000 cps to 700 cps and 8000 cps. Next, the durations of the tones of ensembles 8 and
13 were changed from 100 msec and 300 msec to 50 msec and 150 msec.
The
intensi-ties of the tones in ensemble 8 were then increased 30 db.
The durations of the tactile
stimuli in ensemble 9 were decreased from ZOO msec to 75 msec.
The intensities of
the tactile stimuli were then brought near the point of discomfort by increasing the air
pressure into the poke probes.
Only when the durations of the auditory stimuli were
changed was there any noticeable improvement in performance.
Discussion
These and other experiments support the following conclusions.
1. The speed and accuracy with which stimuli can be identified is greater when
sev-eral dimensions and few coordinates per dimension are used than when few dimensions
and several coordinates per dimension are used.
2.
The dimensions along which the stimuli vary is an important determinant of the
information rate.
3.
When more than one sense is used to convey information, the information rate
can be greater than, equal to, or less than that which results when only one sense is
used.
(XVII. COGNITIVE INFORMATION PROCESSING)