Université de Liège Faculté des Sciences
Département des Sciences et Gestion de l’Environnement
Advancing agricultural monitoring for improved yield estimations using
SPOT-VGT and PROBA-V type remote sensing data
Yetkin Özüm Durgun
Thèse présentée en vue de l’obtention du grade de docteur en sciences
juin 2018
Composition du jury:
Président: Pr Philippe ANDRE (ULiège) Promoteur: Pr Bernard TYCHON (ULiège) Lecteurs: Dr Riad BALAGHI (INRA-Morocco)
Dr Anne GOBIN (VITO)
Dr Mirco BOSCHETTI (CNR-Italy) Dr Grégory DUVEILLER (JRC-Ispra) Ir Sven GILLIAMS (VITO)
Hayat kısa, Kuşlar uçuyor. Cemal Süreya
Summary
Accurate and timely crop condition monitoring is crucial for food management and the economic development of any nation. However, accurately estimating crop yield from the field to global scales is a challenge. According to the global strategy of the World Bank, in order to improve national agricultural statistics, crop area, crop production, and crop yield are key variables that all countries should be able to provide. Crop yield assessment requires that both an estimation of the quantity of a product and the area provided for that product should be available. The definition seems simple; however, these measurements are time consuming and subject to error in many circumstances. Remote sensing is one of several methods used for crop yield estimation. The yield results from a combination of environmental factors, such as soil, weather, and farm management, which are responsible for the unique spectral signature of a crop captured by satellite images. Additionally, yield is an expression of the state, structure, and composition of the plant. Various indices, crop masks, and land observation sensors have been developed to remotely observe and control crops in different regions.
This thesis focuses on how much low spatial resolution satellites, such as Project for On-Board Autonomy-Vegetation (PROBA-V), can contribute to global crop monitoring by aiding the search for improved methods and datasets for better crop yield estimation. This thesis contains three chapters. The first chapter explores how an existing product, Dry Matter Productivity (DMP), that has been developed for Satellites Pour l’Observation de la Terre or Earth-observing Satellites-VeGeTation (SPOT-VGT), and transferred to PROBA-V, can be improved to more closely relate to yield anomalies across selected regions. This chapter also covers the testing of the contribution of stress factors to improve wheat and maize yield estimations. According to Monteith’s theory, crop biomass linearly correlates with the amount of Absorbed Photosynthetically Active Radiation (APAR) and constant Radiation Use Efficiency (RUE) downregulated by stress factors such as CO2, fertilization,
temperature, and water stress. The objective of this chapter is to investigate the relative importance of these stress factors in relation to the regional biomass production and yield. The production efficiency model Copernicus Global Land Service-Dry Matter Productivity (CGLS-DMP), which follows Monteith’s theory, is modified and evaluated for common wheat and silage maize in France, Belgium, and Morocco using SPOT-VGT for the 1999–2012 period. The correlations between the crop yield data and the cumulative modified DMP, CGLS-DMP, Fraction of APAR (fAPAR), and Normalized Difference Vegetation Index (NDVI) values are analyzed for different crop growth stages. The best results are obtained when combinations of the most appropriate stress factors are included for each selected region, and the modified DMP during the reproductive stage is
The second chapter demonstrates how PROBA-V can be used effectively for crop identification mapping by utilizing spectral matching techniques and phenological characteristics of different crop types. The study sites are agricultural areas spread across the globe, located in Flanders (Belgium), Sria (Russia), Kyiv (Ukraine), and Sao Paulo (Brazil). The data are collected for the 2014–2015 season. For each pure pixel within a field, the NDVI profile of the crop type for its growing season is matched with the reference NDVI profile. Three temporal windows are tested within the growing season: green-up to senescence, green-up to dormancy, and minimum NDVI at the beginning of the growing season to minimum NDVI at the end of the growing season. In order of importance, the crop phenological development period, parcel size, shorter time window, number of ground-truth parcels, and crop calendar similarity are the main reasons behind the differences between the results. The methodology described in this chapter demonstrates the potentials and limitations of using 100 m PROBA-V with revisiting frequency every 5 days in crop identification across different regions of the world.
The final chapter explores the trade-off between the different spatial resolutions provided by PROBA-V products versus the temporal frequency and, additionally, explores the use of thermal time to improve statistical yield estimations. The ground data are winter wheat yields at the field level for 39 fields across Northern France during one growing season 2014–2015. An asymmetric double sigmoid function is fitted, and the NDVI values are integrated over thermal time and over calendar time for the central pixel of the field, exploring different thresholds to mark the start and end of the cropping season. The integrated NDVI values with different NDVI thresholds are used as a proxy for yield. In addition, a pixel purity analysis is performed for different purity thresholds at the 100 m, 300 m, and 1 km resolutions. The findings demonstrate that while estimating winter wheat yields at the field level with pure pixels from PROBA-V products, the best correlation is obtained with a 100 m resolution product. However, several fields must be omitted due to the lack of observations throughout the growing season with the 100 m resolution dataset, as this product has a lower temporal resolution compared to 300 m and 1 km.
This thesis is a modest contribution to the remote sensing and data analysis field with its own merits, in particular with respect to PROBA-V. The experiments provide interesting insight into the PROBA-V dataset at 1 km, 300 m, and 100 m resolutions. Specifically, the results show that 100 m spatial resolution imagery could be used effectively and advantageously in agricultural crop monitoring and crop identification at local – field level – and regional – the administrative regions defined by the national governments – levels. Furthermore, this thesis discusses the limitations of using a low-resolution satellite, such as the PROBA-V 100 m dataset, in crop monitoring and identification. Also, several recommendations are made for space agencies that can be used when designing the new generation of satellites.
Résumé
Un monitoring précis et à temps des conditions culturales est crucial pour le développement économique d’une nation et de sa gestion alimentaire. Cependant, cette estimation précise des rendements culturaux reste un défi de l’échelle locale à l’échelle globale. Selon la stratégie globale de la Banque Mondiale pour l’amélioration des statistiques agricoles nationales, les surfaces, les rendements et les productions des cultures sont des variables clés que chaque pays devrait pouvoir fournir. L’estimation du rendement d’une culture exige de connaître tant la quantité produite que celle de la surface pour cette production. La définition est simple; cependant leurs mesures sont couteuses en temps et elles sont toutes les deux sources d’erreur dans beaucoup de circonstances. La télédétection est une méthode utilisée parmi d’autres pour l’estimation des rendements des cultures. Le rendement d’une culture est lié à un ensemble de facteurs comme le sol, le climat et la gestion de l’agriculteur. Ces facteurs sont à la base de la signature spectrale unique de chaque culture observée dans une image satellite, signature qui exprime l’état, la structure et la composition de la plante. Divers indices, masques culturaux et senseurs d’observation de la terre ont été développés pour observer à distance et contrôler les cultures dans différentes régions.
Cette thèse s’intéresse à l’apport de satellites à basse résolution du type de Project for On-Board Autonomy-Vegetation (PROBA-V) dans le suivi global des cultures par l’amélioration de méthodes et l’apport de nouvelles données pour une meilleure estimation des rendements. Elle a 3 chapitres. Le premier explore comment un produit existant, la productivité de matière sèche (DMP), qui a été développé pour Satellites Pour l’Observation de la Terre or Earth-observing Satellites-VeGeTation (SPOT-VGT) (et transféré à PROBA-V) peut être amélioré pour mieux exprimer les anomalies de rendements dans des régions sélectionnées. On s’est concentré sur la contribution de facteurs de stress dans l’amélioration de l’estimation du rendement du blé et du maïs. Selon la théorie de Monteith, la biomasse culturale est corrélée linéairement avec la quantité de rayonnement photosynthétiquement actif absorbé par la plante (APAR) et une constante d’efficience d’utilisation du rayonnement (RUE) ajustée en fonction de facteurs de stress tels que le niveau de CO2, de fertilisation, de température et d’eau disponible dans le sol. L’objectif était d’investiguer l’importance relative de ces facteurs de stress en relation avec les rendements et productions de biomasse à échelle régionale. Le modèle d’efficience de production Copernicus Global Land Service – Dry Matter Productivity (CGLS-DMP), qui suit la théorie de Monteith a été modifié et évalué pour le blé tendre et le maïs ensilage en France, Belgique et Maroc sur base d’images SPOT-VGT pour la période 1999-2012. La corrélation entre les données officielles de rendements et les valeurs
correspondant à la phase de reproduction. Bien qu’il n’existe pas une solution unique à l’amélioration du produit global, nos découvertes nous encouragent à développer la méthode dans d’autres régions du monde.
Le second chapitre montre comment PROBA-V peut être utilisé pour l’identification cartographique des cultures en utilisant les techniques de correspondances spectrales et les caractéristiques phénologiques de différents types de cultures. Les sites d’études étaient répartis globalement dans des zones agricoles de Flandre (Belgique), de la région de Sria (Russie), de la région de Kiev (Ukraine) et de la région de Sao Paulo (Brésil). Le suivi a été réalisé au cours de la saison 2014-2015. Pour chaque pixel pur à l’intérieur d’un champ, le profil de NDVI au cours de la croissance culturale a été mis en correspondance avec un profil NDVI de référence correspondant aux différentes cultures de chaque région. Trois fenêtres temporelles ont été testées pendant la période de croissance : reprise de végétation à senescence, reprise de végétation à dormance, et minimum de NDVI au début de la croissance au minimum de NDVI à la fin du cycle de la culture. Par ordre d’importance, la période de développement de la phénologie de la culture, la taille de la parcelle, la fenêtre temporelle plus réduite, le nombre de parcelles de contrôle de terrain et la similarité du calendrier cultural étaient les principales raisons expliquant les différences dans les résultats. La méthodologie décrite dans ce chapitre démontre le potentiel mais aussi les limites liées à l’utilisation d’image PROBA-V à 100 m avec une fréquence de revisite de 5 jours dans l’identification des cultures dans différentes régions du monde.
Le dernier chapitre analyse le compromis entre les différentes résolutions spatiales disponibles sur PROBA-V et sa fréquence temporelle de revisite. On y étudie aussi l’apport du temps thermique dans l’amélioration des estimations statistiques de rendement. Les données de terrain comprennent les rendements de 39 champs de blé pendant une campagne agricole (2014-2015) dans le Nord de la France. Une fonction sigmoïde asymétrique double a été ajustée et les valeurs de NDVI ont été intégrées en fonction du temps thermique et du calendrier classique pour le pixel central du champ en testant différents seuils pour définir le début et la fin du cycle de la culture. Les valeurs intégrées de NDVI avec différents seuils de NDVI ont été utilisées comme des proxy du rendement. En plus, l’analyse de la pureté du pixel a été réalisée pour différents seuils de pureté à 100, 300 et 1000 m de résolution. On montre que pour l’estimation du rendement du blé d’hiver au niveau des parcelles avec des pixels purs de PROBA-V, la meilleure corrélation est obtenue avec les produits à 100 m de résolution. Cependant, plusieurs champs ont dû être éliminés en raison du manque d’observations pendant la saison culturale avec le senseur à 100 m à cause d’une résolution temporelle plus faible que pour les produits à 300 m et 1 km.
Cette thèse est une contribution modeste au domaine de la télédétection et de l'analyse de données avec ses propres mérites, en particulier en ce qui concerne PROBA-V. Les expériences ont fourni des informations intéressantes sur les données PROBA-V à des résolutions de 1 km, 300 m et 100 m. En particulier, les résultats montrent qu'une imagerie à résolution spatiale de 100 m pourrait être utilisée efficacement et avantageusement dans l’identification et la surveillance des cultures agricoles au niveau local (champ) et régional (régions administratives définies par les gouvernements nationaux). En outre, cette thèse traite des limites de l'utilisation de données satellitaires à basse résolution du type PROBA-V 100 m dans la surveillance et l'identification des cultures. Plusieurs recommandations sont faites pour les agences spatiales en vue de la conception de satellites de nouvelle génération.
Acknowledgements
This thesis could not be realized without priceless support and help of many people. I would like to thank everyone who offered their supervision throughout my PhD period at VITO and ULg over the past five years.
This thesis has been realized in the framework of VEGETATION project collaboration and support of VITO and BELSPO (Belgian Federal Science Policy Office), without which this doctoral study could not be accomplished.
I would like to express my sincerest thanks and gratitude to my thesis committee members. Bernard Tychon guided, supervised and encouraged me thoroughly throughout this thesis. I have learnt a lot from him. My special thanks go to Grégory Duveiller who advised me, supported me and always gave challenging ideas. His significant criticisms and expertise during this thesis period added a different perspective to my scientific point of view. A special thanks is extended to Anne Gobin who has joined later to the committee but has always been understanding, supporting and advising me. I am particularly thankful to her for her editing skills in the completion of our scientific papers. I convey my thanks to Sven Gilliams for his support and guidance during my PhD period. I would also like to thank Riad Balaghi and Mirco Boschetti for having accepted to be part of the jury, to Philippe Andre to be the president of the jury and to Joost Wellens to be the secretary of the jury.
I would like to thank all data providers, from which ground data and satellite data was received. Without their support, this thesis would have never been completed. Thanks to E-AGRI project, MARS-JRC for SPOT-VGT, PROBA-V imageries and meteorological data, NASA for the MODIS imagery, INRA Meknès, GDI - Belgium, Drone Agricole - France, FP7 SIGMA project partners: IKI - Russia, SRI - Ukraine and Guerric le Maire - Brazil.
I also thank to all colleagues at VITO and ULg for their support and friendship during the period of this work.
My special thanks go to my family. I deeply thank my parents for their unconditional love, trust and encouragement. I would also like to thank our sunshine, Enar Atlas, who joined us towards the end of this thesis. Tough this thesis could be finished far before, without him it would not be that fun and same as it was. Finally, I thank to Cihan for sharing life together, caring me every day, still surprising me and being love of my life. I am particularly grateful to him for his understanding, support and time for ‘scientific’ discussions throughout this PhD journey.
Table of Contents
Summary ... ii
Résumé ... iv
Acknowledgements ... vi
Table of Contents ... vii
List of Figures ... ix
List of Tables ... xi
List of Acronyms ... xii
List of Symbols ... xiv
Introduction ... 1
Crop Yield Estimation ... 1
Remote Sensing and Agricultural Monitoring ... 4
PROBA-V Low-Resolution Satellite ... 6
Satellite Combinations for Operational Continuity and Better Crop Monitoring ... 7
Scope and Objectives ... 7
Outline of This Thesis ... 9
1 Testing the Contribution of Stress Factors to Improve Wheat and Maize Yield Estimations Derived from Remotely-Sensed Dry Matter Productivity ... 10
1.1. Introduction ... 10
1.2. Materials ... 13
1.2.1. Study Areas and Crops ... 13
1.2.2. Data Description ... 16
1.3. Methods ... 17
1.3.1. Algorithm Description of the DMP Model ... 17
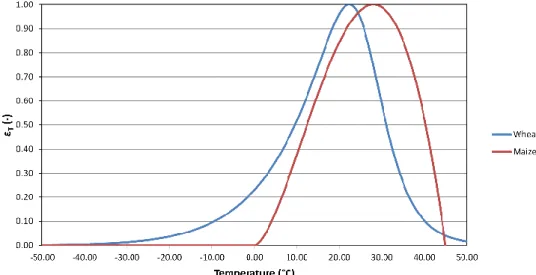
1.3.1.1. Temperature Stress Factor ... 18
1.3.1.2. CO2 Fertilization Effect ... 18
1.3.1.3. Water Stress Factor ... 21
1.3.1.4. Autotrophic Respiration Factor ... 21
1.3.2. Regression Analysis ... 22
1.4. Results ... 22
1.4.1. Autotrophic Respiration Fraction (εAR) ... 23
1.4.2. Linear Regression Analysis ... 25
1.5. Discussion ... 29
2 Crop Identification Mapping Using 100 m PROBA-V Time Series ... 32
2.1. Introduction ... 32
2.2. Materials ... 34
2.2.1. Study Areas and Ground Data ... 34
2.2.2. Ground Data ... 37
2.2.3. NDVI Data Description ... 37
2.3. Methods ... 38
2.3.1. Collecting Training/Validation Samples ... 38
2.3.2. Deriving Reference NDVI Profiles and Phenological Stages ... 39
2.3.3. Classification Using Spectral Matching Techniques ... 39
2.3.4. Post-Classification Filtering ... 40 2.3.5. Accuracy Assessment ... 40 2.4. Results ... 41 2.4.1. Accuracy Assessment ... 41 2.5. Discussion ... 47 2.6. Conclusions ... 49
3 Comparison of PROBA-V 100 m, 300 m, and 1 km NDVI datasets for yield forecasting at the field level ... 51
3.1. Introduction ... 51
3.2. Materials ... 53
3.2.1. Study Area and Ground Data ... 53
3.2.2. NDVI and Meteorological Data ... 53
3.3. Methods ... 54
3.4. Results ... 55
3.5. Discussion ... 59
3.6. Conclusions ... 60
General conclusions and perspectives ... 62
Conclusions ... 62
Perspectives ... 64
List of Figures
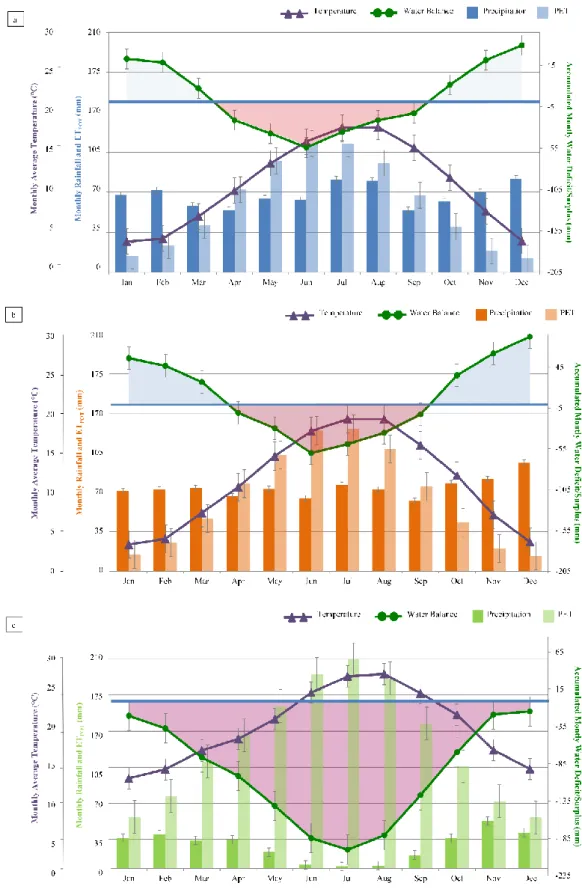
1. Key variable percentage changes from 2005/2007 to 2050 and 2080, adapted from Alexandratos and Bruinsma [2] ... 1 1.1. Study areas with study crops in Belgium, France and Morocco. ... 14 1.2. Cumulative monthly rainfall, PET (potential evapotranspiration), water balance
(accumulated monthly water deficit/surplus) (mm) and average monthly
temperature (°C) during the 1999–2012 period for study sites in Belgium (a), France (b) and Morocco (c). Error bars show the standard deviation for the meteorological indicators. ... 15 1.3. The temperature functions of εT used in this study for wheat and maize. ... 18
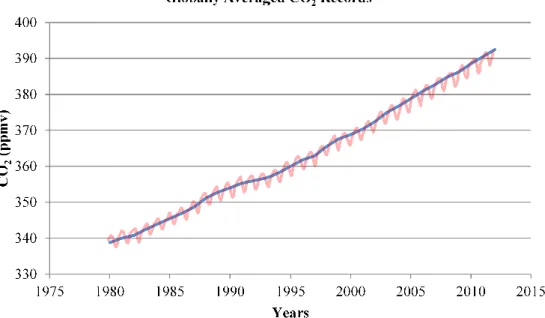
1.4. Yearly (blue line) and monthly (red line) globally averaged CO2 records (source:
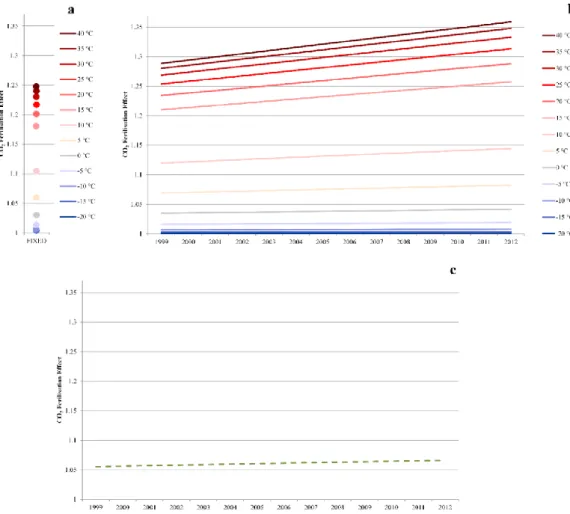
[130]). ... 19 1.5. Evolution of εCO2 both for CGLS-DMP (Copernicus Global Land Service-Dry Matter
Productivity) at the fixed rate of CO2 value (dots) (a); modified DMP variable CO2
rates for C3 (blue to red lines represent the change in temperature from −20 °C–40
°C) (b); and C4 plants (dashed green line) (c); for the years 1999–2012. ... 20
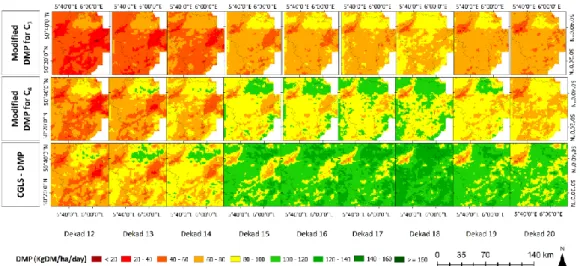
1.6. Comparison of modified DMP for C3 and C4 versions with CGLS-DMP for Liège Region
(BE). ... 23 1.7. Average εAR calculated with CGLS-DMP (a), modified DMP (this study) (b) for the
period 1999–2012, and MODIS NPP/GPP ratio from 2000–2013 (c) with the study sites extent. ... 23 1.8. Difference maps of εAR calculated with modified DMP (this study) & CGLS-DMP (a),
MODIS NPP/GPP ratio from 2000 – 2013 & εAR calculated with CGLS-DMP (b) and
MODIS NPP/GPP ratio from 2000 – 2013 & εAR calculated with modified DMP (this
study) (c). ... 24 1.9. Scatterplots of εAR calculated with modified DMP (this study) & CGLS-DMP (a),
MODIS NPP/GPP ratio from 2000 – 2013 & εAR calculated with CGLS-DMP (b) and
MODIS NPP/GPP ratio from 2000 – 2013 & εAR calculated with modified DMP (this
study) (c). The dotted lines are the 45° reference lines and the red lines are trend lines. ... 24 1.10. R2 for a linear regression between official yield statistics and regional cumulative
modified DMP computed with different stress factors or combinations. CO2: with CO2
fertilization effect; H2O: with water stress factor; Temp: with temperature stress
factor and combinations of these stress factors. The cumulative periods of modified DMP for each study region are presented in dekads. ... 25
1.11. Cumulative period with highest R2 of BPs (modified DMP, CGLS-DMP, fAPAR, NDVI),
p-value (calculated by Pearson’s correlation for r2) and coefficient of determination
(R2 for the linear model) for wheat and maize per region. ... 26
1.12. RMSE (t/ha), RRMSE (%), MBE (t/ha) and E1 based on the correlation between the
calibrated BP (modified DMP, CGLS-DMP, fAPAR, NDVI) and yield statistics per region for wheat and maize using a leave-one-out cross validation. The index accumulation period according to different BPs is not the same. ... 27 1.13. Temporal trends of predicted yield calibrated by leave-one-out cross validation
technique confronted with the actual yield for 1999–2012 period per region. ... 28 2.1. Study sites overlaid with field boundaries. The background images were extracted
from the 100 m PROBA-V red band. ... 35 2.2. Flowchart of the crop identification mapping methodology. ... 38 2.3. A schematic presentation of the annual cycle of crop phenology characterized by
four key transition dates ((a) green-up, (b) maturity, (c) senescence and (d) dormancy) calculated using values in the rate of change in the curvature (adapted from Zhang et al. [207]). ... 39 2.4. Crop time windows for maize in Flanders-Belgium (a) and Sao Paulo, Brazil (c); and
for soybean in Kyiv, Ukraine (b), and Sria, Russia (d). The four phenological transition dates were calculated from piecewise logistic functions. The grey zone represents the minimum and maximum NDVI values in the training dataset. The crop calendar is presented below each graph, where green represents the planting time and orange the harvesting time. Light green and orange colors represent low activity for maize in Brazil. ... 41 2.5. Comparison of the classification results based on pure pixels during the entire
growing season for a selected area in Flanders-Belgium (a) and Sria, Russia (b). (left) The overlay of PROBA-V and ground data; (right) the overlay with post-classification results. ... 47 3.1. Location of winter wheat fields, corresponding yields (t/ha), and soil type of the study
area. ... 53 3.2. The depiction is an example of fitted ADSF and integral area of PROBA-V NDVI datasets
at 100 m, 300 m, and 1 km resolutions for calendar time (days) and thermal time (°C·days). The circles refer to NDVI values for the field. The grey line represents the fitted ADSF curve, and the shaded area represents the integral above the NDVI
threshold 0.3. The example field was located in Nord-Pas-de Calais (50.879°N, 2.218°E). ... 55 3.3. The comparison of calendar time (days) and thermal time (°C·days) using adjusted R²
results at 100 m, 300 m, and 1 km resolutions for different NDVI thresholds for all fields, with no purity threshold applied. ... 56 3.4. Scatterplots comparing the actual yield with integral values at 100 m, 300 m, and 1 km
resolutions for different NDVI thresholds. ... 57 3.5. Jackknifed RMSE (t/ha) and MAE (t/ha) for calendar time (in days) and thermal time (in °C·days) analyses at 100 m, 300 m, and 1 km resolutions for different NDVI thresholds with p-values smaller than 0.001 in all cases, except for the ones labeled with a star
List of Tables
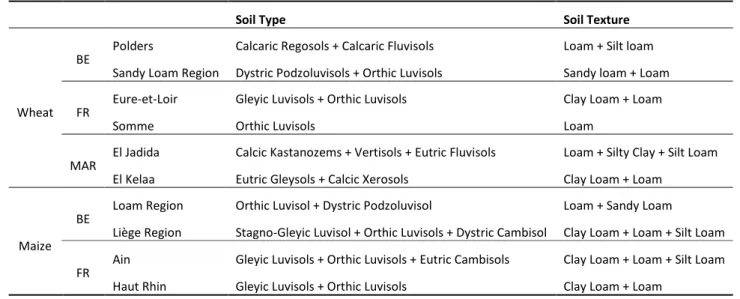
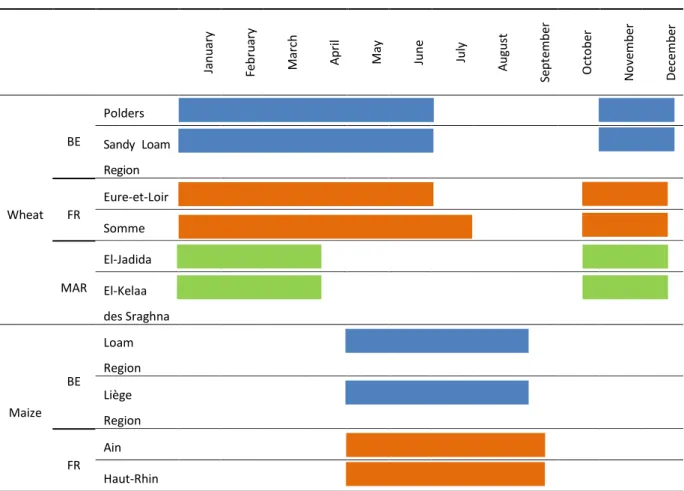
1.1. The soil types and textures of the study sites. ... 16 1.2. Crop growing periods for maize and common wheat in the case study sites. ... 17 1.3. Summary of unchanged and changed parameters in the DMP equation from CGLS as
compared to the modified version. ... 22 2.1. Site characteristics. ... 36 2.2. Crop cover characteristics of the study areas. ... 37 2.3. Confusion matrix of classification analysis for green-up to senescence, green-up to
dormancy and minimum NDVI at the beginning of the growing season to minimum NDVI at the end of the growing season assessment of Flanders-Belgium (a), Sria-Russia (b), Kyiv-Ukraine (c) and Sao Paulo-Brazil (d). The number of correctly-classified crops, the producer accuracy, the user accuracy, the overall accuracy and the kappa coefficient are presented. ... 43 2.4. Confusion matrix of the post-classification analysis for green-up to senescence,
green-up to dormancy and growing season of Flanders-Belgium (a), Sria, Russia (b), Kyiv, Ukraine (c), and Sao Paulo, Brazil (d). The number of correctly-classified crops, the producer accuracy, the user accuracy, the overall accuracy and the kappa
coefficient are presented. ... 45 3.1 Adjusted R² results for pixel purity comparison for calendar time (days) and thermal
time (°C·days) analyses at 100 m, 300 m, and 1 km resolutions for different NDVI thresholds (ranging from 0 to 0.3) and pixel purity thresholds (ranging from 0% to 90%). ... 59
List of Acronyms
AC Agreement Coefficient
ADSF Asymmetric Double Sigmoid Function
AET Actual EvapoTranspiration
APAR Absorbed Photosynthetically Active Radiation
AR Autotrophic Respiration
AVHRR Advanced Very High Resolution Radiometer
BE Belgium
BPs Biophysical Proxies
CGLS-DMP Copernicus Global Land Service-Dry Matter Productivity
DMP Dry Matter Productivity
EC Eddy Covariance
ED Euclidian Distance
EVI Enhanced Vegetation Index
FAO Food and Agriculture Organization of the United Nations
fAPAR fraction of Absorbed Photosynthetically Active Radiation
fCOVER fractional cover
FR France
GAI Green Area Index
GDD Growing Degree Days
GPP Gross Primary Productivity
JRC-MARS Joint Research Centre Monitoring Agriculture by Remote Sensing
LAI Leaf Area Index
LAIg green Leaf Area Index
MAR Morocco
MARSOP Monitoring Agriculture by Remote Sensing OPerational
MAE Mean Absolute Error
MBE Mean Bias Error
MODIS MODerate resolution Imaging Spectroradiometer
NDVI Normalized Difference Vegetation Index
NPP Net primary Productivity
PET Potential EvapoTranspiration
PROBA-V Project for On-Board Autonomy-Vegetation
RMSE Root Mean Square Error
RRMSE Relative RMSE
RUE Radiation Use Efficiency
SPOT-VGT Satellites Pour l’Observation de la Terre or Earth-observing Satellites - VeGeTation
SSV Spectral Similarity Value
List of Symbols
εAR Fraction kept after Autotrophic Respiration
Mean pure pixel NDVI profile from validation set Mean reference NDVI profile
Concentration in the reference year 1833 Actual CO2 concentration
Dd Middle dates of the decreasing segments
Di Middle dates of the increasing segments
E1 Index of model performance
Normalized Euclidean distance between the different candidate reference NDVI profiles and the pure pixel profiles
Maximum Radiation Use Efficiency
CO2 Assimilation rate in year x
CO2 Assimilation rate in the reference year 1833
Kp Michaelis–Menten constant for CO2
M Historical maximum NDVI of the reference profile for a logical comparison m Historical minimum NDVI of the reference profile for a logical comparison p Overall changing rates of the increasing slope
q Overall changing rates of the decreasing slope
R Total shortwave incoming solar radiation (0.2–3.0 µm) (GJ/ha/day)
R² Coefficient of determination
Reference NDVI profile at time i from 1 to n
Pure pixel NDVI profile from validation set at time i from 1 to n
T12 Day time temperature
T24 Day and night temperatures
Tbase Base temperature
Ten daily mean composite of mean air temperature
Tmax Maximum daily temperature
Tmin Minimum daily temperature
V(t) NDVI at the time t
Va Amplitude of NDVI variation within the current growing cycle
Vb Background NDVI value corresponding to non-growing season
Maximum phosphoenolpyruvate carboxylase activity
W Above ground biomass
Standard deviation of the pure pixel NDVI profile from the validation set Standard deviation of the reference NDVI profile
Introduction
Crop Yield EstimationArticle 25 of the United Nations Universal Declaration of Human Rights (1948) states that all people have the right to a standard of living that is adequate for the health and well-being of themselves and their families, including food [1]. According to projections, as displayed in Figure 1, the world population will increase by 51%, cereal production will grow by 54%, and arable land area will expand 2% by 2080 [2].
Figure 1. Key variable percentage changes from 2005/2007 to 2050 and 2080,
adapted from Alexandratos and Bruinsma [2]
However, this production increase will probably not be sufficient to ensure food security for everyone [3]. Almost a third of the world’s population could remain chronically undernourished due to unequal distribution of and access to food [4]. Increasing agricultural productivity could contribute toward increased food security and allow countries to produce a surplus, particularly of cereals, for export to food-deficient regions [4].
Governments and organizations monitor crop growth and estimate yields in order to plan the national food production and tackle any unexpected weather events throughout the growing season. There is, therefore, an increasing demand for methods that provide timely, accurate, efficient, and affordable information about crop yield and cultivated area
function more efficiently. Furthermore, timely information about potential and observed harvest shortfalls could hasten the early identification of problem areas and help to organize and optimize food supplies on a regional scale [5].
Vegetation behavior depends on the nature of the vegetation itself; its interactions with solar radiation and other climatic factors, such as precipitation, temperature, etc.; and the availability of chemical nutrients and water in the soil [6]. Therefore, crop yield depends on the amounts of the following: energy, mainly incoming solar radiation; water, including precipitation and water retention; and nutrients, including soil chemistry, provided to the plant. Crop yield also depends on the capacity of the crop to use all of these growing factors, as expressed in the crop phenotype, and, of course, on the cropping areas [6].
Remote sensing is a key tool to analyze short-term and long-term changes in vegetation growth. Remote sensing data can provide accurate and timely information on crop yield estimates and crop identification mapping. It enables the acquisition of remote information from the electromagnetic spectrum at different wavelengths, including visible, near infrared, thermal infrared, and microwave. When the sun’s radiation reaches the Earth’s surface, some of the energy at specific wavelengths is absorbed, and the rest of the energy is reflected. Green leaves absorb the blue and red wavelengths and reflect the green wavelengths, which are, therefore, detected by human eyes. Plant chlorophyll pigment molecules absorb electromagnetic radiation in the wavelength range of 400– 700 nm – visible light – which is called the Photosynthetically Active Radiation (PAR) spectral region. The reflectance of solar radiation differs for soil, green vegetation, and dead vegetation over the range of wavelengths, 300–2500 nm, in the electromagnetic spectrum. This spectral signature of the surface material differs by what is useful to detect differences in the crop growth during the growing season. The reflectance for green vegetation is low in both the blue and red regions of the spectrum because of the absorption by chlorophyll pigments. The reflectance has a small peak in the green region and is much higher in the near infrared region than in the visible band because of the cellular structure of the leaves. The shape of the reflectance spectrum, known as the spectral signature, can be used for identification of the vegetation type and vegetation stress [6]. For instance, dry vegetation has a higher reflectance in the visible region but a lower reflectance in the near infrared region. Therefore, remotely sensed images enable the monitoring of vegetation status which can change depending on factors such as the leaf moisture content and health of the plants.
The ability of remote sensing satellites to obtain extensive coverage of the Earth has made this tool an asset for the monitoring of crop production. The first civilian satellite for Earth observation, called Landsat-1, was launched in 1972, and in 1974 the North-American Large Area Crop Inventory Experiment demonstrated the improvement in United States Department of Agriculture (USDA) wheat production predictions that were achieved by using satellite imagery in the United States, Canada, and the former Soviet Union. The methodology was extended to other crops and regions by the Agriculture and Resources Inventory Surveys Through Aerospace Remote Sensing program which used satellite imagery to evaluate crop condition throughout the growing season and to estimate yield [7]. The Monitoring Agriculture by Remote Sensing (MARS) program was established by the European Union (EU) in 1988 to provide agricultural statistics on yield and crop areas for EU countries and is operationally based on the combined use of remote sensing observations and agrometeorological modeling [5]. There are currently several operational agricultural monitoring systems that use remote sensing to observe crop growth conditions and operate at national and international scales. Several examples of these systems include the United Nations Food and Agricultural Organization global information and early warning system, the United States agency for international
development Famine Early Warning Systems NETwork (FEWS-NET), the USDA Foreign Agricultural Service (FAS) GLobal Agriculture Monitoring (GLAM) System, Group on Earth Observations Global Agricultural Monitoring Initiative, the Chinese CropWatch system, the Indian Forecasting Agricultural output using Space, Agro-meteorology and Land based observations system, and the Belgian crop growth monitoring system [5,8].
Various approaches have been developed for monitoring crop growth and estimating crop yields, and they can be broadly divided into two categories. The first category includes empirical-statistical models that relate regional crop yields to climatic variables and remote sensing-based vegetation indices using methods such as multiple regression analysis [9]. Crops respond differently to changes in weather conditions, including drought, water excess, and low and high temperatures, depending on the crop type and management practices. Remote sensing images for the current growing season can be compared with the corresponding long-term statistics or statistics from the previous year to derive anomaly images in order to observe the interannual changes [10]. Therefore, this approach allows anomaly images to be analyzed for qualitative crop growth monitoring and for useful information from temporal, or seasonal, profiles of remotely derived vegetation indices to be obtained [11]. One of the main shortcomings of these models is that their application is valid only for the areas for which they have been calibrated [12]. Other drawbacks include problems of co-linearity between predictor variables, for example, temperature and precipitation; assumptions of stationarity, for example, that past relationships will hold in the future, even if management events evolve;, and low signal-to-noise ratios in yield in many locations [13]. An additional flaw is that crop masks and reference information, such as agricultural statistics and crop yield, are required for the application and calibration of the approach [11]. Although the reference information can be accessible on a regional level through the national statistics of each country, crop masks are, mostly, not readily available. As a crop mask, one of the following could be used: a cropland mask that covers all crops, a crop-specific mask that is prepared for a specific study area, or a dynamic crop mask. For this reason, lack of a crop mask limits the applicability of the method in many regions of the world.
The second category includes process-based crop growth models and is based on simulation models to create detailed information about plant physiological processes in order to explain how crops function as a whole [8]. These models try to understand crop behavior by explaining crop growth and development through underlying physiological mechanisms. The main drawback of these models is that they have many parameters which all need to be calibrated. The calibration of all of these parameters is frequently not possible, leading to poor performance in the yield assessment when upscaling. Another drawback of these models is their extensive data input requirements, including data on cultivar, management, and soil conditions. This data is mostly limited to the study regions and is unavailable in the majority of the world. A soil-vegetation-atmosphere model is one model that combines the biological and physiological knowledge of plants and the interactions between plants and their environments [14]. Remotely sensed canopy state variables have been assimilated into these soil-vegetation-atmosphere models. There are a number of shortcomings of these models, such as the model input requirements that limit the use of cropping system models and practical problems including cloud cover and satellite revisit time [8]. Crop models require many site-specific inputs for detailed calibration in order to be able to perform realistic simulations. Additionally, optical remote sensing observations could be restricted by cloud cover throughout a growing season, particularly when combined with the revisit time of the satellite and when frequent
Remote Sensing and Agricultural Monitoring
Remote sensing provides objective observations over both time and space by various instruments observing the Earth. One major group of instruments is optical sensors. These record solar energy reflected back to space across various wavelengths including visible light and invisible infrared bands [6]. The number of bands varies depending on the instrument, and this variation defines the spectral resolution of the sensor. The higher the spectral resolution, the more accurate the characterization of different materials is [15]. Another type of instrument resolution is spatial resolution, which is the minimum size of detail observable – a pixel – in an image, depending on the orbit and characteristics of the instrument [16]. A third distinction can be made for temporal resolution, which is the amount of time needed to revisit and acquire data for the exact same location depending on the orbital characteristics of the sensor platform and its sensor characteristics [17]. Radiometric resolution is the fourth resolution type. The sensitivity of the image acquisition of a sensor to the magnitude of the electronic energy determines the radiometric resolution [18]. Finer radiometric resolution is more sensitive for the detection of small differences in reflected or emitted energy [18]. Each application using remote sensing data searches for the best trade-off between spectral, spatial, temporal, and radiometric resolution. For instance, in the context of agricultural monitoring with remote sensing, the spatial resolution must be high enough to monitor an individual crop, the temporal resolution must be high enough to collect crop-specific information throughout the growing season, and the differences in agricultural land cover must be distinguishable by their responses over distinct wavelength ranges.
As a result of technological developments, the definition of high and low spatial resolution has changed. Traditionally, a pixel size of 10 m to 30 m has been referred to as high spatial resolution. The multispectral scanner, thematic mapper, and thematic mapper plus instruments on board the Landsat satellites and the high resolution visible, visible and infrared high resolution, and high resolution geometric instruments on board the Satellites Pour l’Observation de la Terre (SPOT) satellite are some examples. Low spatial resolution instruments have pixels of about 1 km, such as the Advanced Very High Resolution Radiometer (AVHRR) on-board the national oceanic and atmospheric administration satellite. Moderate Resolution Imaging Spectroradiometer (MODIS), Project for On-Board Autonomy-Vegetation (PROBA-V), and Sentinel-3, with a pixel resolution from 100 m to 300 m, were previously considered to be medium resolution satellites, but now they are considered to have a low resolution. Today, satellites such as Sentinel-2 with 10 m spatial resolution are considered to be medium resolution. There is a new generation of instruments providing images below 5 m, such as FORMOSAT-2, WorldView-2, and QuickBird, which are considered to be high-resolution satellites. The spatial and temporal resolutions of satellites were inversely proportional until early 2000s [8]. Images from low spatial resolution sensors are mostly available on a daily basis, such as from AVHRR, MODIS, PROBA-V, and Sentinel-3. The revisit time for medium resolution sensors varies. For instance, the revisit period of Landsat7/ETM+ is 16 days, but Sentinel-2 images are available within 3 to 5 days, depending on the latitude. Currently, some high spatial resolution instruments, such as RapidEye and FORMOSAT-2, have daily revisit capabilities over a limited geographic extent. Besides the technological developments to provide better temporal and spatial resolution, the availability of historical time records for these satellites is also valuable, and these records are currently available for low and medium resolution satellites. Also, to assure the retrieval of reliable crop-specific information for agricultural monitoring with remote sensing at regional to global scales, it is necessary to have high temporal resolution of the satellite for a fine diagnostic of crop growth and sufficiently high spatial resolution for monitoring the crop fields [5].
Green plants use visible wavelengths as a source of energy in the process of photosynthesis. Conversely, pigments in plant leaves reflect electromagnetic radiation with wavelengths between 700 to 1000 nm, near-infrared light. Information on plant canopies can be retrieved from the electromagnetic signal measured by satellite remote sensing due to the diverse spectral properties of green vegetation [5]. For vegetation monitoring by remote sensing, there has been a tradition of using vegetation indices (VIs), which are a combination of spectral bands to highlight the spectral properties of green plants in relation to vegetation status, such as leaf water content, leaf density, and distribution. Examples of VIs include the Normalized Difference Vegetation Index (NDVI) and the Enhanced Vegetation Index (EVI). An optimal VI is sensitive to the desired information and is as insensitive as possible to atmospheric and illumination conditions, soil properties, and the viewing geometry of the imaging instrument [5]. While such VIs at a global scale have limits in the agricultural monitoring context, VIs have been used as a proxy for general crop growing conditions and linked to crop yields in a statistical way [5,12,19–23]. Although VIs can contain spectral information relating to vegetation behavior, they cannot directly describe the functioning of a canopy as biophysical variables can. Examples of biophysical variables involved in important physical and physiological processes retrieved from remote sensing are the fraction of Absorbed Photosynthetically Active Radiation (fAPAR) and the Leaf Area Index (LAI).
Other biophysical variables that have originated from Monteith’s theory and measure vegetation productivity are the Gross Primary Productivity (GPP), Net Primary Productivity (NPP), and Dry Matter Productivity (DMP). According to the radiation use efficiency model originating from Monteith’s theory, carbon flux is a function of the photosynthetically active radiation absorbed by green vegetation, and the efficiency of light absorption is used as the reference for carbon fixation [69]. Gross primary productivity is the rate at which plants capture and store atmospheric carbon dioxide (CO2) to generate oxygen and
energy as biomass [24]. Terrestrial GPP constitutes the largest flux component in the global carbon budget, however, significant uncertainties remain in GPP estimates and its seasonality [25]. Recent methods of carbon flux assessment integrate FLUXNET site-level observations, satellite remote sensing, and meteorological data using upscaling approaches based on machine learning methods [26–28]. Furthermore, several studies reveal that solar-induced chlorophyll fluorescence from spaceborne observations exhibits a strong correlation with GPP, including cropland ecosystems even at a higher spatial resolution [25,29,30]. Wang et al. [31] proposed a simple equation to generate functional relationships between the ratio of leaf-internal to ambient carbon dioxide partial pressure and growth temperature, vapor pressure deficit, and elevation. This equation is a single global equation embodying these relationships and unifying the empirical radiation use efficiency model with the standard model of C3 photosynthesis [31]. This proposed model
is used in the TerrA-P project to estimate GPP and aboveground biomass production from MEdium Resolution Imaging Spectrometer (MERIS) and Sentinel-3 data [32].
The difference between GPP and the energy lost during plant autotrophic respiration is the NPP. Furthermore, DMP is analogous to NPP but expressed in different units – kgDM/ha/day instead of gC/m2/day – for agro-statistical purposes [33]. For this reason,
the DMP is a particularly interesting variable because it estimates photosynthetic carbon uptake and represents the daily accumulation of standing biomass. Currently, the Copernicus Global Land Service-Dry Matter Productivity (CDLS-DMP) is available as a part of the operational processing chain of SPOT-VGT and PROBA-V at the Flemish Institute for Technological Research, also known as the Vlaamse Instelling Voor Technologisch
water stress index and re-parameterization of stress factors. Hereafter, VIs and biophysical variables are called biomass proxies (BPs).
Biomass proxies should be combined with crop maps for better crop yield estimates. Remote sensing data are a promising source of information for deriving crop maps at the regional to continental scale due to the synoptic capabilities of spaceborne instruments to acquire timely images in different spectral bands and provide repeatable, continuous, human-independent measurements for large territories [39]. Land use and land cover datasets, which have been the primary input in estimating crop yield, provide variable quality and reliability in representing croplands [40]. Regardless of crop type, cropland maps from previously mentioned studies have been proven to improve crop yield forecasting [41]. Therefore, timely crop-specific maps could potentially further enhance crop yield estimates. Cropland areas are intensively managed and modified through a variety of human activities; therefore, timely crop mapping to characterize the cropping patterns on a repetitive basis is valuable to scientists and policy-makers [42]. Although, it is challenging, discriminating croplands from non-croplands and identifying different crop types can be achieved with remote sensing-based crop growth monitoring and, in particular, with indices that quantify the distinct green-up and senescence stages of the crop cycle [43]. Furthermore, multiband pixel and object-based image analysis at a chosen time during the crop season or at different times during the season have also proven their high efficiency in crop identification [44,45].
PROBA-V Low-Resolution Satellite
New technological improvements have supported the development of satellites that could solve the problems mentioned in the previous section. Regarding crop monitoring, these improvements provide remotely sensed data with larger geographic coverage, higher temporal resolution, adequate spatial resolution relative to the typical field size, and minimal cost [42].
PROBA-V is a small satellite constructed to be a successor of the VEGETATION instruments onboard the French SPOT-4 and SPOT-5 Earth observation missions. It was initiated by the Belgian Science Policy Office and has been operated by the European Space Agency. It was designed to support land use, vegetation classification, crop monitoring, famine prediction, food security, climate, and coastal applications. The original mission was to fill the gap between Satellites Pour l’Observation de la Terre or Earth-observing Satellites -VeGeTation (SPOT-VGT), which reached the end of its life in May 2014, and Sentinel-3 satellites, which were launched in February 2016 and April 2018. PROBA-V was launched in May 2013 with a 5-year expected operational lifetime and has four spectral bands: blue, centered at 0.463 µm; red, 0.655 µm; Near InfraRed (NIR), 0.845 µm; and Short-Wavelength InfraRed (SWIR), 1.600 µm. The spectral characteristics of the instrument are nearly identical to the SPOT-VGT instrument. The Vegetation-PROBA instrument has a swath width of 2250 km across four bands. Compared to SPOT-VGT, which provided daily global images with spatial resolution at 1 km, the central camera of the PROBA-V satellite provides a 100 m data product when delivering global coverage every 5 days, whereas global daily images are acquired at 300 m and 1 km resolutions. Radiometric performances in terms of signal-to-noise ratio are also increased with respect to SPOT-VGT [46]. The PROBA-V data is available to the CGLS (formerly “Global Monitoring for Environment and Security”) users through https://land.copernicus.eu/global/themes/vegetation.
Crop growth monitoring and yield forecasting using space observations often rely on the analysis of long-term data archives in order to identify anomalies against a long-term average that reflects adverse crop growth conditions or to define local empirical regression models between remote sensing products and observed yield [46]. Therefore, PROBA-V is particularly important to ensure the continuity of the operationally used biophysical
products in such an analysis. Additionally, its particular configuration providing a 100 m spatial resolution combined with 5-day repetition could be very useful for agricultural monitoring, particularly for monitoring the continuity of crop yield estimation studies and crop identification. Over, the unique characteristics of PROBA-V open a new set of opportunities for scientists to explore various Earth surface phenomena at finer spatial and temporal resolutions [47].
Satellite Combinations for Operational Continuity and Better Crop Monitoring
PROBA-V images are interesting when viewed alone, but they are even more interesting when combined with information from other satellites to either complete time series or to study areas with different pixel sizes. Currently, the Sentinel-2 – launched in 2015 and available at 10 m and 20 m resolutions with 3 to 5 days of revisit time and Sentinel-3 – launched in 2016 and available at 300 m resolution with 1 to 2 days of revisit time – satellites can both be used for crop monitoring. Smets et al. [48] assumed that regular monitoring of the globe would continue at 300 m and 100 m resolutions, and hot spot monitoring at 30 m and 10 m resolutions. For instance, Sentinel-2 with 10 m spatial resolution and 5-day temporal resolution could be used for emergency management and security for the present time until the historical archive is ready to conduct global operational crop monitoring. Sentinel-2 for crop yield forecasting may also become rapidly interesting for small-size plots.
Use of Sentinel-2 data for global crop monitoring is questionable and subject to discussion at the present time. In general, Sentinel-2 provides much greater data volume than is necessary for yield estimation studies. With the current technology, in operational conditions, greater data volume would usually take excessive space and processing time. Traditionally, time series of the satellite data have been used in crop monitoring studies. The factors impacting the yield vary greatly over space and time. Therefore, the historical archive of low spatial resolution satellite images may be in use, similar to SPOT-VGT type images. In the future in 10 to 15 years, when the archive has been built for Sentinel-2 images, and when the processing time and storage problems have been overcome by the technological improvements, the Sentinel-2 archive will probably be used in global crop monitoring studies. However, until then, it is important to explore how much low-resolution images, such as those obtained by PROBA-V, can contribute to global crop monitoring.
Additionally, there has been a need for temporal continuity assessment between
sensors, SPOT-VGT, PROBA-V, and Sentinel-3. For instance, the spectral continuity
between the global daily datasets of PROBA-V and SPOT-VGT has already been validated [49].
The technological developments can ensure free images with better spatial and temporal resolution. Thus, the popularity of using high spatial resolution data will probably increase in different vegetation monitoring studies. However, since low-resolution datasets will still have a longer historical time series, they may be used for crop yield estimation until the high-resolution datasets have established a longer time series and have proven that they are more efficient.
Scope and Objectives
According to the World Bank’s global strategy to improve agricultural statistics, crop area, crop production, and crop yield are key variables that all countries should be able to
used for crop yield estimation. The yield is produced by a combination of environmental factors, such as soil, weather, and farm management. Green plants have a unique spectral signature that is captured in satellite images and is defined by the state, structure, and composition of the plant. There are several limitations of the use of satellite images for crop yield estimations.
First, an appropriate BP derived from remote sensing can better explain variation in irradiation conditions, short-term environmental stresses, and respiration costs compared to other simpler satellite-derived BPs such as NDVI and fAPAR. The improved CGLS-DMP model could be a better option to use in crop yield estimation studies because it explains the variation mentioned previously and represents the standing biomass computed based on Monteith’s approach. According to Monteith’s theory, crop biomass is linearly correlated with the amount of absorbed photosynthetically active radiation (APAR) and constant radiation use efficiency (RUE), downregulated by stress factors such as CO2
fertilization, temperature, and water stress. The current CGLS-DMP model is open for improvements to its parameters to be used in agricultural applications, such as stress factors.
Second, the spatial resolution of available satellite imagery should allow the crop identification in fields to be defined. As a result of satellites, such as PROBA-V and Sentinel-2, the spatial resolution of satellite imagery has been improved, and the usefulness of these images can be studied in terms of crop identification improvement. Furthermore, better spatial resolution could improve the crop yield estimation results by avoiding, or at least reducing, the problem of mixed pixels. Traditionally, images used for global and regional crop production studies usually have 1 km spatial resolution. PROBA-V with 100 m, 300 m, and 1 km resolution datasets could be further studied to determine the impact of three different resolutions in improving crop yield estimation.
Third, the temporal resolution of satellite imagery is particularly important for crop monitoring, because vegetation status changes rapidly during the growing season. Therefore, frequent cloud cover during this season can be a major problem for crop monitoring. In most cases, when the spatial resolution is increased, the temporal resolution is decreased because of the trade-off between the spatial and temporal characteristics of the satellite. For this reason, satellite images with better spatial resolution should be studied for their impact on crop yield estimation studies regarding their temporal resolution. For instance, PROBA-V provides a 100 m data product with a 5-day revisit time and daily images at 300 m and 1 km resolutions. The greater difficulty in cleaning 100 m products from cloud cover compared to the 300 m and 1 km products could affect the crop yield estimation results.
This thesis aims to explore how much PROBA-V-like imagery, such as low spatial resolution data, can contribute to global crop monitoring through possible improvements in crop yield estimation. In this context, the main objective of this thesis is to advance agricultural monitoring for improved yield estimation using SPOT-VGT and PROBA-V-type remote sensing data. More specifically, three research questions are listed below.
• Is a modified DMP a more accurate proxy for crop yield estimations compared to
CGLS-DMP, NDVI, and fAPAR?
• Is it possible to retrieve crop identification with a 100 m PROBA-V product that
could possibly be used in crop yield estimations?
• What is the optimal spatial resolution between 100 m, 300 m, and 1 km PROBA-V
Although the research questions are handled individually, they can be understood in combination with each other. Due to the ground data and satellite data availability per topic – for instance, the thesis was started in 2011, but the PROBA-V dataset was only available in late 2013 – different datasets are used in each chapter while investigating the questions.
Outline of This Thesis
The chapters are based on scientific papers published in peer-reviewed journals and a manuscript currently in progress to be submitted. Each chapter introduced below states its research purposes. The main findings and future perspectives are given in the general conclusion and perspectives. Additionally, each chapter can be considered as addressing an independent research question.
Chapter 1 explores how an existing product, CGLS-DMP, that has been developed for SPOT-VGT, and transferred to PROBA-V, can be improved to better relate to yield anomalies over selected regions. This chapter investigates the relative importance of stress factors in relation to regional biomass production and yield. The stress factors are CO2 fertilization, temperature, and water stress, which could downregulate APAR and RUE
according to Monteith’s theory. The CGLS-DMP, which follows Monteith’s theory, is modified and evaluated for common wheat and silage maize. The results reveal that each study region has its own climatic characteristics that affect the impact of these stress factors.
Chapter 2 demonstrates how PROBA-V can be used effectively for crop identification mapping using spectral matching techniques (SMTs). This chapter provides a method developed for crop identification inspired by SMTs and based on the phenological characteristics of different crop types. For each pure pixel within the field, the 100 m PROBA-V NDVI profile of the crop type for its growing season was matched with the reference NDVI profile based on the training set extracted from the study site where the crop type originated. The resulting maps can be used as crop-specific maps in crop yield estimation studies.
Chapter 3 explores the trade-off between the different spatial resolutions provided by PROBA-V products versus the temporal frequency, and, additionally, this chapter explores the use of thermal time to improve statistical yield estimations. This chapter compares the suitability of three different spatial resolutions – 1 km, 300 m, 100 m – of PROBA-V NDVI datasets for wheat yield forecasting. The NDVI-integrated values as a proxy for yield are computed using daily NDVI and cumulative growing degree day images over thermal time and over calendar time. The results suggest that the greater the spatial resolution, the greater the correlation between the estimated and real yields.
1 Testing the Contribution of Stress Factors to
Improve Wheat and Maize Yield Estimations
Derived from Remotely-Sensed Dry Matter
Productivity
1
Abstract
According to Monteith’s theory, crop biomass is linearly correlated with the amount of absorbed photosynthetically active radiation (APAR) and a constant radiation use efficiency (RUE) down-regulated by stress factors such as CO2 fertilization, temperature and water
stress. The objective is to investigate the relative importance of these stress factors in relation to regional biomass production and yield. The production efficiency model Copernicus Global Land Service-Dry Matter Productivity (CGLS-DMP), which follows Monteith’s theory, is modified and evaluated for common wheat and silage maize in France, Belgium and Morocco using SPOT-VGT for the period 1999–2012. For each study site the stress factor that has the highest correlation with crop yield is retained. The correlation between crop yield data and cumulative modified DMP, CGLS-DMP, fAPAR (Fraction of Absorbed Photosynthetically Active Radiation), and NDVI (Normalized Difference Vegetation Index) values are analyzed for different crop growth stages. A leave-one-year-out cross validation is used to test the robustness of the model. On average, R² values increase from 0.49 for CGLS-DMP to 0.68 for modified DMP, RMSE (t/ha) values decrease from 0.84–0.61, RRMSE (%) values reduce from 13.1–8.9, MBE (t/ha) values decrease from 0.05–0.03 and the index of model performance (E1) increases from 0.08–0.28 for the selected sites and crops. The best results are obtained when combinations of the most appropriate stress factors are included for each selected region and the modified DMP during part of the growing season that includes the reproductive stage are cumulated. Though no single solution to an improvement of a global product can be demonstrated, the findings support an extension of the methodology to other regions of the world.
1.1. Introduction
Regional to global scale crop monitoring and yield forecasting are important for agricultural management and food security [52,53]. Satellite remote sensing enables assessment of agricultural crop growth and yield across large territories [12,54–57]. Various Biophysical Proxies (hereafter BPs) have been developed from remote sensing
1
Adapted from Durgun, Y.Ö.; Gobin, A.; Gilliams, S.; Duveiller, G.; Tychon, B. Testing the Contribution of Stress Factors to Improve Wheat and Maize Yield Estimations Derived from Remotely-Sensed Dry Matter Productivity. Remote Sens. 2016, 8, 170.
imagery to be used in empirical regressive models that monitor agricultural crop growth and estimate crop yield [58–60]. NDVI, fAPAR, LAI, GAI and EVI (Enhanced Vegetation Index) are examples of BPs that have been derived from remote sensing and that are used in vegetation monitoring and crop yield forecasting [55,57,61–66]. Though relationships between BPs and yield have been established, few studies relate Dry Matter Productivity (DMP) to crop yield [37,38].
Vegetation productivity can be defined in several ways. Gross primary productivity (GPP) is the rate at which plants capture and store atmospheric carbon dioxide (CO2) to
generate oxygen and energy as biomass [24]. Net primary productivity (NPP) is the difference between GPP and the energy lost during plant autotrophic respiration. NPP is thus the rate of atmospheric carbon uptake through the process of photosynthesis and represents the daily accumulation of standing biomass. DMP is analogous to NPP, but expressed in different units (kgDM/ha/day instead of gC/m2/day), for agro-statistical
purposes [33]. The efficiency of the conversion between carbon and dry matter is on average 0.45 gC/gDM [67].
Three types of models are used to estimate the photosynthetic carbon uptake and understand its spatio-temporal variability [68–70]. The first group consists of empirical models often with a limited applicability outside the area where they have been calibrated. The second group of models is based on major biophysical and biochemical processes of photosynthesis and respiration measured under laboratory conditions [71]. These models have a high computational demand. The third group of models are parametric models driven by remote-sensing-derived variables and weather data, calibrated with data derived from flux measurement sites. Constant parameters are used to link measurements to biophysical processes rendering these models particularly suitable for the local scale. While such assumptions may be difficult to hold at a global scale, parametric models may offer a balance between simplicity and process description [69].
Production efficiency models, such as Monteith parametric models, have been developed to monitor the primary production of vegetation [72,73]. Monteith suggested that crop growth under non-stressed conditions linearly correlates with their Radiation Use Efficiency (RUE) times the amount of Absorbed Photosynthetically Active Radiation (APAR) [74,75]. According to a review of experimental studies, RUE values for C3 species
range from 1.32–3.50 gDM/MJ of intercepted PAR and for C4 species from
1.48 to 4.32 gDM/MJ of intercepted PAR during different crop development stages [76]. The seasonal variability of photosynthetic activity, however, depends on environmental constraints [68]. For example, RUE is negatively related to water stress and positively related to temperature for annual crops [68]. Water stress has been estimated as a function of soil moisture [77,78], water deficits [79] or satellite-derived land surface water index [80].
Production efficiency models have been widely used to estimate regional or global carbon balances in crops, grasslands and forests due to the simplicity of the RUE concept and the availability of remotely sensed data [37,77,78,81–87]. However, their performance has been shown to vary in describing the carbon budget [88]. A comparison of modelled gross and net primary productivity [72] of six different models, CASA [89], GLO-PEM [90], TURC [91], MOD17 [92], BEAMS [93] and C-Fix [94], illustrates how the various methodologies used to calculate vegetation productivity can be generalized in the following two equations:
![Figure 1. Key variable percentage changes from 2005/2007 to 2050 and 2080, adapted from Alexandratos and Bruinsma [2]](https://thumb-eu.123doks.com/thumbv2/123doknet/5521778.131856/17.892.185.683.518.794/figure-key-variable-percentage-changes-adapted-alexandratos-bruinsma.webp)