HAL Id: hal-03100474
https://hal.archives-ouvertes.fr/hal-03100474
Submitted on 6 Jan 2021
HAL is a multi-disciplinary open access
archive for the deposit and dissemination of
sci-entific research documents, whether they are
pub-lished or not. The documents may come from
teaching and research institutions in France or
abroad, or from public or private research centers.
L’archive ouverte pluridisciplinaire HAL, est
destinée au dépôt et à la diffusion de documents
scientifiques de niveau recherche, publiés ou non,
émanant des établissements d’enseignement et de
recherche français ou étrangers, des laboratoires
publics ou privés.
Distributed under a Creative Commons Attribution - NonCommercial - NoDerivatives| 4.0
International License
Experimental study of steady and transient subcooled
flow boiling
Valentin Scheiff, Frédéric Bergame, Julien Sebilleau, Pierre Ruyer, Catherine
Colin
To cite this version:
Valentin Scheiff, Frédéric Bergame, Julien Sebilleau, Pierre Ruyer, Catherine Colin. Experimental
study of steady and transient subcooled flow boiling. International Journal of Heat and Mass Transfer,
Elsevier, 2021, 164, pp.120548. �10.1016/j.ijheatmasstransfer.2020.120548�. �hal-03100474�
OATAO is an open access repository that collects the work of Toulouse
researchers and makes it freely available over the web where possible
Any correspondence concerning this service should be sent
to the repository administrator:
[email protected]
This is an author’s version published in:
https://oatao.univ-toulouse.fr/27205
To cite this version:
Scheiff, Valentin and Bergame, Frédéric and Sebilleau, Julien and
Ruyer, Pierre and Colin, Catherine Experimental study of steady and
transient subcooled flow boiling. (2020) International Journal of
Heat and Mass Transfer, 164. 120548. ISSN 0017-9310
Open Archive Toulouse Archive Ouverte
Official URL :
Experimental
study
of
steady
and
transient
subcooled
flow
boiling
V. Scheiff
a,b,
F.
Bergame
b,
J.
Sebilleau
b,
P.
Ruyer
a,
C.
Colin
b,∗a Institut de Radioprotection et de Sûreté Nucléaire (IRSN), PSN-RES/SEMIA/LSMA, BP3, St Paul-Lez-Durance, 13115, France b Institut de Mécanique des Fluides de Toulouse, Université de Toulouse, CNRS, Allée Camille Soula, Toulouse, 31400, France
a
r
t
i
c
l
e
i
n
f
o
Keywords:Nucleate flow boiling Transient heating Wall heat flux Bubble dynamics Infrared thermography
a
b
s
t
r
a
c
t
This study aims to better characterize the heat transfer and flow structure in the fully developed nucleate flow boiling regime in a semi-annular duct. Experiments with a refrigerant HFE70 0 0 were performed in the range of Reynolds numbers from 13 0 0 0 to 40 50 0, subcoolings close to 15 ◦C, for constant heating
power, constant wall temperature and constant heating rates (linear increase of the wall temperature). With constant heating power, the wall heat flux is well predicted by a Chen-type correlation based on a contribution due to the forced convection and a contribution due to nucleate boiling, including the effect of the liquid subcooling. A thin layer of bubbles sliding along the wall is observed. The character- istic diameter of the bubbles increases with the heat flux and decreases with the liquid velocity and its subcooling. The bubble diameters can be well predicted versus 3 dimensionless numbers: the Reynolds number of the flow, the Jakob number based on the liquid subcooling and the Boiling number. A drag coefficient of the bubbles sliding on the wall is estimated from the measurements of the bubble relative velocities and is in good agreement with the recent numerical simulation of Shi et al. [1] for a spherical bubble moving close to a wall in a shear flow. In the experiments with a constant set temperature, a non-homogeneity of the surface temperatures is observed as well as high fluctuations of temperatures and heat fluxes. The heat transfer is strongly degraded ( ! 60%) by comparison with heating with a set power. Finally a transient nucleate boiling regime with a constant temperature increase dT/ dt is investi- gated. For dT/ dt < 50 ◦C.s −1, the results are similar to those of Auracher and Marquardt and a correlation
for the prediction of the wall heat flux versus the wall temperature in the transient nucleate boiling regime is provided.
1. Introduction
Nucleate boilingisknown asan efficientheat transferregime, thanks toa combinationofbubblyinducedconvectionandlatent heattransport.Insteadyconditions,heatfluxfromthewalltothe fluid isfullydetermined,foragivenset offluid andwall proper-tiesandgeometries,bytheliquidbulktemperature,theliquidflow rateandthewallsuperheat.Inthisstudy,weconsidertheimpact oftransientheatingofthewallonthenucleateboilingheat trans-fer, i.e.: how a fast variation of these control parameters affects the boilingheattransfer.From aphenomenologicalpoint ofview, when the wall temperature varies over time scales smaller than the typical boilingprocess (e.g. thebubblelife cycleon thewall, fromnucleation todeparture),the heattransferisexpectedtobe impactedbythewallheatingrate.
∗Corresponding author.
E-mail addresses: [email protected] , [email protected] (C. Colin).
Auracher andMarquardt [2] studied the transient heat trans-fer inpool boiling withrates ofwall temperature increase up to 40 K.s−1 . Sakuraiand Shiotsu [3]more extensively studied tran-sientboilingup tocriticalheatfluxonimmersedwires for expo-nentiallyincreasing power transients,identifying specific sponta-neous heterogeneous nucleation phenomenafor very rapid heat-ing,whichwerealsoobservedby Fauetal.[4].Forrathersimilar conditions,Suetal.[5]haveconsidered convectiveboiling overa plate.Inlessacademicalconfigurations,relatedtothestudyof hy-potheticalaccidentalpowertransientinthereactorvesselofa nu-clearpowerplant(socalledreactivityinitiatedaccident scenario), a large deviation of the heat transfer coefficient with respect to correspondingsteadyconditionshasalsobeenreported[6,7].The authorspointedout thatthe boilingcrisis isnotdueto hydrody-namic instabilities, asit is proposed by the classical correlations oftheliterature,buttothe coalescenceofvapourbubbles onthe rodsurface:relativelylow powertransientslead tothe establish-mentofthesteadynucleateboilingregimewhilehighpower tran-sientsleadtotheboilingcrisis,namelytotheformationofavapor blanketandtheestablishmentoffilm boiling.Theyconcludethat
Nomenclature
Bo Boilingnumber, Bo =!gen
hlv.G Re Reynoldsnumber, Re =GDh µl S Surfacesection(m2 ) U Voltage(V) I Current(A)
P Generatedpower,P=UI,(W)
e Thickness(m)
C p Specificheatcapacity(J.kg−1 .K−1 ) t Time(s) T Temperature(K) L c Capillarylength(m) Ja Jakobnumber Ja =ρlCp,l#T ρvhlv La Laplacenumber La = ρlLcσ µ2
h lv Latentheatofvaporisation(J.kg−1 )
D b Bubblesize(m) D h Hydraulicdiameter(m) F D Dragforce(N) C D DragCoefficient V Speed(m.s−1 ) g Gravity(m.s−2 ) R Resistance(
%
) R Height(m ) M th ThermalMass(J.m−2 .K−1 ) a ElectricalresistivitycoefficientG Massflux(kg.m−2 .s−1 )
ρ
Density(kg.m−3 )τ
Characteristictime(s)φ
Heatflux(W.m−2 )σ
Surfacetension(N.m−1 ) w Wall exp Experimental th Theoretical l Liquidgen GeneratedbyJouleeffect
v Vapour
p Paint
sat Saturation
set Setpoint
sub Subcooled
a moredetailedanalysisofthephysicalmechanismsisneededto provideareliablemodelingoftheheattransferonthenuclearfuel rodduringareactiveinitiatedaccident.
In order tobetter analyse andunderstand the physical mech-anisms encountered in transientboiling regimes,a dedicated ex-perimental facility has been built by Visentini et al. [8]. It al-lowsgeneratingvariouspowertransientswithina wallincontact withasubcooledturbulentliquidflowofHFE700withamaximal Reynolds numbervalue of60000. Thankstoan infraredcamera and a high-speedcamera, it ispossible to evaluate theheat flux transferred to theliquidandstudyall theregimesfromthe con-vection (Baudin et al. [9]) to the film boiling while relatingthe time evolutionoftheheattransferwiththedevelopmentof two-phaseflowstructuresalongthewall.Onsetofnucleateboilinghas beenalreadystudiedindetailsinacompanionpaper[10].
In recent studies (Golobiˇc and Zupanˇciˇc [11], Petkovsek et al.
[12],Richenderferetal.[13])theauthorsusenewmetrology (high-speed infrared thermography) that allow to accessthe wall tem-peraturefieldandtodetermineitscorrelationwiththebubble nu-cleation andgrowth processes. Coupled with a high-speed cam-era, the infrared camera allows to accurately measure the wall
Table 1 Test conditions.
Generic symbol Test section # Test conditions
Re = 13 500 27 0 0 0 40 500 ! SE 1 Jasub = 21.5 Jasub = 20 Jasub = 20.8
! SE 2 Jasub = 22 ∅ ∅
♦ SE 2 Jasub = 27 Jasub = 26 ∅
✚ SE 3 Jasub = 23 ∅ ∅
–♦ – SE 4 Jasub = 22 ∅ ∅
temperature, estimate the wall-to-fluidheat transfer and charac-terize the boiling flow topology inthe FullyDeveloped Nucleate Boiling regime and in particular how the bubbly layer thickness is relatedto heattransfer. The main goal ofthe presentstudyis therefore to characterize the nucleate boiling process in convec-tivesubcooledconditionsbothinsteadyandtransientconditions. Itisdifficulttocontrolnucleateboilingexperimentswithimposed transientpowerconditions.Indeed,forrapidpowerincrease, tran-sientnucleateboilinglastsaveryshorttime(beforeboilingcrisis): thepowersupply iscutoff duringthe testto avoidaburnoutof the test section. Using a Proportional Integrator Derivator (P.I.D.) systemtocontrol transientpowerbysettingaconstantwall tem-peratureincrease rate, allowsto studymoreextensivelytransient nucleateboilingregimeupto500K.s−1 .
Thepaperisorganizedasfollows.First,inSection2,wepresent theexperimentaldeviceanditsinstrumentation.Heattransferand related bubbly layer characteristics are analyzed in Section 3 for steady conditions. Transient nucleate boiling is then studied in
Section4.
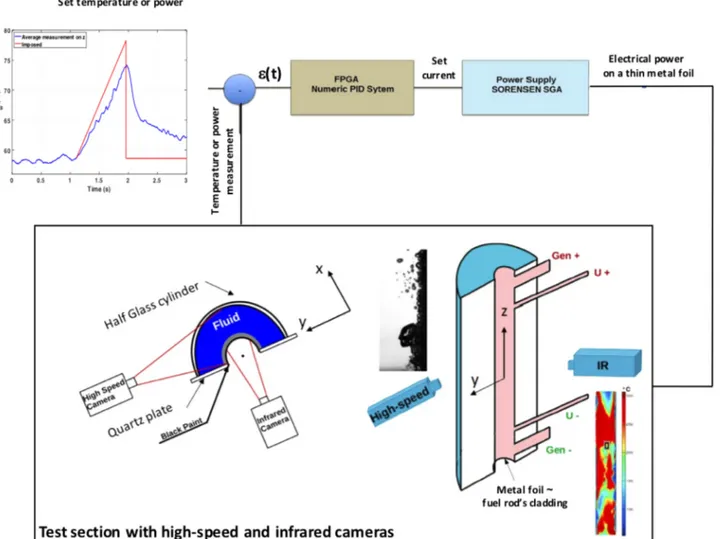
2. Descriptionoftheexperimentalset-up
Theexperimental set-upused forthisstudyhasbeendetailed intheprevious worksofVisentinietal.[8]andScheiff etal.[10]. Themainpartofthecellconsistsofasubcooledflowofa refriger-ant,HFE7000,inasemiannularsectioncomposedofathinmetal foil of thickness e w = 50 µm andradius 4.1mm rapidlyheated
by Jouleeffect.Thefluid isconfined inthesemi-annular gap be-tweenthemetal foilandan outerglasscylinderofradius17mm asillustratedinFig.1.Thetestcellisinsertedinaflowloop con-sisting of a gear pump, a Coriolis flow meter, a preheater to fix theliquidtemperature(T l
(
[15;25]◦C.),a1mlongchannelup-streamthetestsectiontoestablishtheflow,andacondenser.The experimentsare carriedout ata constantliquid flowrate (corre-spondingtoReynoldsnumbersbetween0and60,000).The veloc-ityfieldinsingle-phaseflowhasbeencarefullymeasuredbyP.I.V. inthesymmetryplaneandcomputedinthecrosssectionbyusing StarCCM+ [9]. The mean axial velocity in the symmetry plane is ingoodagreementwiththeanalyticalexpressionofKanedaetal.
[14]foran annulargeometry. Theelectrical power isapplied be-tween thetwo endsofthe metal foil(Gen+,Gen-in Fig.1). Itis
providedby a powersupplySORENSENSGA with0–40Vvoltage
rangeand0–250Acurrentrange.
Boilingcrisisoccurrenceleadstopartialburnoutofthefoiland itisthenrequiredtorebuildthetestsection.Evenusingthesame metal, thefoilproperties differbetweendifferenttest sectionsin termsofpositionandthesizeofthenucleation sites.The experi-mentalresultspresentedareobtainedforthreedifferenttest sec-tions namedSE1 ,SE2 andSE3 forpowercontrolbuta singletest section SE4 fortemperature control. The experimental conditions aregiveninTable1.
Flow rates correspond to different colors. red: 0.1 l.s−1 , blue: 0.2l.s−1 ,green:0.3l.s−1 .Liquidbulktemperaturearerepresented bydifferentsymbols.Thesubcoolingoftheinletliquidflow
#
T =T sat - T l ishereindicatedintermsof Ja sub= ρlCp,l#T
Fig. 1. Test section with high-speed and infrared images.
#
T =13 ◦C for Ja sub=20to#
T =17 ◦C for Ja sub=27. Finally, thegeneratedheatflux,
!
genisimposedbetween40and80kW.m−2 .Notethat intheexperiments,themeanliquidtemperature in-creasealongtheheatedtestsectionislessthan1◦Cforthe
high-est heatflux andthe lowerliquid flowrate. Therefore,the liquid subcooling (namely the Ja sub value) measured at the inlet ofthe
test section can be consideredasrepresentative ofthe local sub-coolingallalongthetestsection.
2.1. Measurements techniques and image processing
Two perpendicular camerasare used duringthe tests(Fig.1). AninfraredcameraCEDIPJADEIIIplacedbehindthefoilprovidesa temperaturefieldoftheheatedfoil’sbacksurface.Thecamerahas a[3.5-5.1]µmsensitivityrangeandafocalplanearraydetectorof 240x320px2 cooledby aStirlingMCT.Forthisstudy,the acquisi-tionfrequencyis500fpsandtheviewfieldis20x120px2 .1pixel corresponds to470µmandthewholepicturecovers a5cmlong portionofthemetalfoilfilmedalongtheflowdirection.The inte-gration timeranges between20and500
µ
s.Theinfraredcamera iscalibratedthankstoaDCN1000N4blackbody.The uncertain-tiesonthemeasurementtemperatureoftheblacksurfacedepend on the temperaturerangeof calibration.Over the [20◦C-100 ◦C]temperaturerangeofourexperiments,theuncertaintyvariesfrom ± 0.6◦Cat20◦Cto± 0.1◦Cat100◦C.
To increase temperaturemeasurements accuracy, thebackside ofthemetalfoiliscoveredwithalayer(e p~ 35± 5µmthickness)
ofblackpaintwithlargeemissivity(0.94).Theblackpaintusedis aBeltonSpectralRAL9005MATBLACKpaint,whichthermal prop-ertieswere measuredby thecompany NeoTIM(Albi, France),and aregiveninTableB1.Thethicknessofthepainthasbeenchosen as a best compromise between getting the largest surface emis-sivityandsufficientlylowthermalinertia.Solvinga1Dconduction throughthemetalfoilandthepaintlayer,showedthatthethermal gradientbetweenthepaintandthemetalfoilisnegligible(Scheiff etal.[10]).Since thesurfaceiscurved, its emissivitydependson theobservationangle.Onlya widthof5pixels (2.35mm)onboth sidesofthesymmetryplaneistakenintoaccountinthe measure-mentofthesurfacetemperature.Ahigh-speedcamerafocuseson a lateral view of the two-phase flow along the test section (see
Fig.1).Thehigh-speedcameraimagesizeis384x1024px2 where 1 pixel corresponds to 80 µm. So these high-speed camera im-agesallowaresolutionofapproximately10pxforeachindividual bubble(given the typicalbubble sizeobserved duringour exper-iments). Thoseimages areused tofocus onthe bubblylayerjust over thewall. Using Matlabsoftware,afterbinarizing theimages andremovingbubbles notincontactwiththe wall,thefollowing quantitiesaredeterminedoverthisbubblylayer:timeevolutionof itsthickness, bubbleaxialvelocities,percentageofsurfacewetted bytheliquid.
It is not the case for the infrared camera with a lower spa-tialresolution. It isnot possible toidentify nucleation sitesfrom thermal analysis. Both camerasprovide complementary informa-tion duringtests that are usefulfor the interpretation ofthe
re-Fig. 2. Raw and processed images obtained with the high speed camera, coupling with the infrared camera on the same zone at the same time.
sults. Visualizations of the two cameras havebeen synchronized inspaceandtime (Fig.2). Anintegratedtriggerconnectedto the NIboxallowssynchronizingvideoswithdatafromother measure-mentchannels.
2.2. Heating control
The experimental set-up allows the study ofsteady and tran-sient nucleateboiling regimes.Forthe transientboiling phenom-enastudy,eitherthepowerorthetemperaturecan becontrolled thanks toa P.I.D. feedback control systembased on a Labview15 code.The CompactRIO9035 chassisisusedwithseveralmodules (oneforreadingdatathermocouples,oneforanalogreadingofthe other dataandone lastmodule forgeneratingvoltagesand com-municatingwiththepowersupply)toacquirethedataandcontrol theheatingduringexperiments.TwoP.I.D.controllerscanbeused:
• Apowercontrolbasedonthemeasurementofthepower(P= UI)deliveredbythepowersupplywherethegainsoftheP.I.D. havebeendeterminedexperimentally.ThisP.I.D.isquite flexi-bletoimposesignalsofseveraltypesonthewallandobtaina steadycasewitha constant powercontrol ora transientcase witheitherlinearorexponentialpowerevolution.
• Atemperaturecontrolbasedonthemeasurementofthe resis-tance ofthe metal foilthat evolves withits temperature. The resistanceof thefoil R isa linearfunctionofthe temperature inthe studiedtemperaturerange: R = R o+ a .(T w - T ref) where R o = 0.031
%
is the resistance at the temperature ofrefer-ence T ref = 50 ◦C, T w is the metal foil temperature and a =
7.110−5
%
.K−1 thecoefficientofelectricalresistivity.Usingthe resistanceofthe metalfoilis notintrusiveandalmost instan-taneous as the resistance is directlymeasured on the electri-calconnectionsofthefoil.Acomparisonbetweentheimposed temperature(throughthemeasurementoftheresistanceofthemetalfoil)andtheaveragedwalltemperaturemeasuredby in-frared thermography shows that the P.I.D. correctly generates therampoftemperaturesbutloses inaccuracyastheheating rateincreases(Fig.3a).Athighimposedtemperatures,thewall temperature of the heated foil is not homogeneous anymore withtheappearance ofhotspots.As illustrated inFig.3b,for anhypotheticallyimposedleveloftemperature,themedianand meanwall temperaturesasrevealed byIR thermographyshift fromthislevelandthereexistsasignificantstandarddeviation
σ
T around the medianvalue. Thishas some consequences onthestandarddeviationsofthelocalvalueofthefoilresistance. MoredetailsontheseP.I.D.controllersaregiveninAppendixA.
2.3. Wall-to-fluid heat flux determination
The wall-to-fluidheat flux
!
w is determinedlocally (foreachanalyzedpixeloftheinfraredcamerapicture)byconsideringa lo-calenergybalanceoftheheatedwallasfollows:
!
w =!
gen−!
sensibleheat−!
naturalconvection−
!
conductive f lux−!
radiation (1)where
!
gen=UIS is the volumetric heating source generatedby Joule effect,
!
sensibleheat is the sensible heat of the wall1,!
naturalconvection isthe heatflux transferred by natural convectionfromthebacksideofthewallincontactwithair,
!
conductive f lux is theconductionalongthewall and!
radiation corresponds toradia-tiveheatfluxfromtheblacksurfacetothesurrounding.
Allthefluxcontributionshavebeenestimatedfordifferenttest conditions.
!
genissimplydeducedfromthepowergeneratormea-surements.
!
sensibleheat is considered thanks to thelocaltemper-ature variation rate from the IR measurements.
!
naturalconvectionis estimated with a Grashoff number value ranging from 107 to 3.107 .
!
conductive f lux estimation is based on both azimuthal andaxialtemperaturegradients fromIRpictures.
!
radiation isdeduced fromview factorofaconcavegeometry.Moreinformationcan be foundinScheiff etal.[10]andScheiff[15].OntheFig.4,weplottedthedifferentcontributionsofthe en-ergybalance(1)foratypicaltransienttestduringnucleateboiling. Forthistest,thetemperaturecontrolisusedtoimposearapid variation on the heat flux. It shows that, even for this type of rather transient test conditions, the generated heat flux and the sensibleheat ofthe solid are dominant inthe estimation of the wall-to-fluidheatflux withrespecttoother contributions. There-foreweneglecttheothercontributionsintherestoftheanalysis.
Due to the unsteady conduction through the paint layer, the sensibleheat termshavetoconsiderthelayersofbothmetaland paintandthereforetheenergybalancereads:
!
w=!
gen−(
ρ
wCp,wew+ρ
pCp,pep)
!
"#
$
Mth
.dTw
(
t)
dt (2)
where M thcorrespondstothethermalmass.
Theabsoluteuncertaintyontheheatfluxisdeterminedas:
(
#!
w)
2 =%
∂
!
w∂
!
gen&
2#!
2 gen+%
∂
!
w∂
ep&
2#
e2 p +%
∂
!
w∂
(
dTw/dt)
&
2#
'
dTw dt(
2 (3)The generated heat flux variesfrom40 to 400 kW.m−2 , andthe time derivative of the wall temperature atthe onset of nucleate
1 The wall is composed of the metal foil (high resistivity and thermal conductiv-
ity) and a black paint used to improve emissivity of the wall (low resistivity and thermal conductivity)
Fig. 3. a. Generation of a temperature ramp with the P.I.D. compared to the measurement and b. Statistic analysis of the metal foil resistance with the temperature for a steady case.
Fig. 4. Energy balance during transient nucleate boiling.
boilingvariesfrom10to500K.s−1 .Duetotheuncertaintyonthe paintlayer thickness(35 ± 5
µ
m),it yieldsa maximal3% un-certainty on M th andanuncertaintyof4.4kW.m−2 on!
w forthemostrapidtransientat500K.s−1 .
So the relative wall heat flux uncertainty can reach at most 6.5%.
3. Steadynucleateboiling
Inthisfirststudy,theimposedsteadypowerlevelissufficiently large toonset anucleateboiling regime. Apowerstep leadingto aheatfluxofapproximatelymorethan40kW.m−2 issufficientto establishsteadynucleateboiling.Forpowerlevels leadingtoheat fluxeslargerthan1MW.m−2 ,theregime doesnotstabilizeanda transitiontowardfilmboilingoccurs.Inthissection, wefirst con-sider theheat transfer and then focus on bubblehydrodynamics fordataobtainedwiththreedifferenttestsections.
3.1. Heat transfer analysis
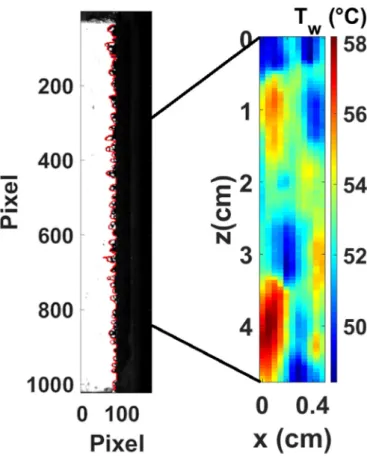
InFig. 5,the infraredmeasurement ofwall temperature T w is
represented for a typical test condition leadingto such a steady nucleateboilingregime.OntheLHS(Fig.5.a),thewalltemperature atagiven z elevationisplottedasafunctionoftimeforthewhole test sequence. Afterthe first blue part of the curve, correspond-ingtotheonsetofnucleateboiling,weidentifiedbyagreencircle thetemperature T NB,0 atthefirsttime when d T /dt =0.Afterthat point, andtill the power isset off (i.e.till approximately t =4.2 s forthis test), the red part of the curve corresponds to steady nucleateboiling.Fluctuationlevelsarearound afewdegreeswith typicaltimevariationsaround0.1s .Thecolor-levelgraphinFig.5.b showsthewalltemperaturealongthesymmetryaxisoftheheated foilforlocationsalonga4.5cmlongsectionandduringatime se-quenceinthestablenucleateboilingregime(identifiedontheLHS graphbydottedverticallines).
Duringthissequence the temperaturelevelis relativelystable ina [50− 55] ◦C range.Some fluctuations, that are tobe related
to theone on theLHS graph,can beidentified andtheir pattern isasetofquasiverticalparallellines,indicatingacouplingofthe temperature time and spacevariation withthe main flow direc-tion(decreasing z whenincreasingtime).Thesetemperature fluc-tuations arecertainly linked to thesliding ofthe vapour bubbles thatare advectedbytheflow. Suchvapour bubblesdynamicscan beseeninfig.7(a)andsimilarquasiverticallinesareclearly vis-ible.Obviously,theslidingofthesevapour bubbleswillaffectthe wall to fluid heat transfer and thus can be associated with wall temperaturevariations.
Letusdefine T NB asthetime andspaceaveragedvalueofwall
temperatureforgiventestconditions,namelyflowrateintermsof Reynoldsnumber Re ,subcoolingintermsofJakobnumber Ja sub=
ρlCpl(Tsat−T l)
ρvhlv and imposed power level
!
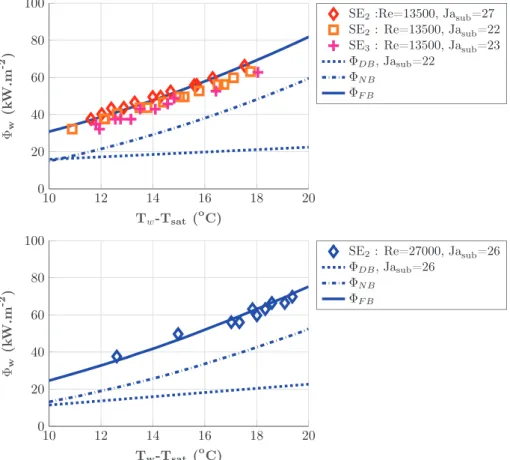
gen (W.m−2 ). The resultsfor two test sections (SE2 and SE3 ) are plotted on the curve of
Fig.6intermsofwall-to-fluidheatflux asa functionofwall su-perheat (T NB− Tsat). Symbols identifying different flow conditions
ortest sectionsarelittledispersedfortherangeofconditions ex-plored.Themaintendencyisthereforeanincreaseofthe wall-to-fluidheattransferwithrespecttowallsuperheat.Insaturatedflow boiling, a classical correlation forthe predictionof the wall heat
Fig. 5. a. Evolution of temperature at z = 2 cm and b. Spatio-temporal curves, obtained with infrared camera measurements, of a test with imposed power to !gen =
40 kW.m −2 , Re = 13 500, #T
sub = T sat − T l = 15 ◦C, Ja sub = 22 where the nucleate boiling is fully developed. z corresponds to a vertical coordinate, the flow direction being
oriented from the bottom to the top of the graph.
Fig. 6. a. Wall heat flux in nucleate flow boiling for Re = 13 500 b. for Re = 27 0 0 0, Ja sub = 26. fluxhasbeenproposedbyChen[16].
!
Chen=!
DB+S.!
FZ (4)where
!
DB is predicted by Dittus and Boelter [17] and!
FZ is aheat flux due to the bubble nucleation predicted by Forster and Zuber [18]. S is a suppression factor S =
)
1+2.53.10−6 .Re1 . 17*
−1 proposed by Butterworth [19] (see Collier and Thome [20]). In order to take into account the liquid subcooling, a factor S sub=1+3.27.10−4 .Ja2 sub according to Baudin [21] is introduced in the heatfluxduetonucleateboiling
!
NB:!
FB=!
DB+!
NB (5)!
DB=0.023Re0 . 8 .Pr0 . 696 .λl.(
Tw− Tl)
/Dh (6)Fig. 7. a. Spatio-temporal curve of the bubble diameter obtained with the images of the high-speed camera for each location taken in the nucleate boiling zone as in the
Fig. 5 ; b. Evolution of the fraction of wetted surface P wetted depending on the generated heat flux; c. Probability density of bubble diameters with its distribution function
correlated to a normal distribution law in c. The characteristics of the test are an imposed generated heat flux !gen = 40 kW.m −2 , Re = 13 500, #T sub = 13 ◦C, i.e. Ja sub = 21.5.
!
FZ=A.Pr0 . 21 .La0 . 25 .λl.(
Tw− Tsat)
.Ja0 . 24 /rc (8)where Ja isbasedonthewallsuperheat, La istheLaplacenumber,
r c theradiusofavaporembryoinequilibriumforthewall
super-heat. A is aconstant takenequalto0.0017. Forthetwo Reynolds number values the boiling curves reproduced in Fig. 6 are simi-lar.Neverthelesstherelativecontributionofthebubblenucleation
!
NB andtheconvectiveheatflux!
DB isnot thesameinthetwocases.For Re =13 500,thecontributionofthebubblenucleation inthe totalheatflux isthemostimportant,whereas for Re =27 000, the two contributions are of the same order of magnitude. This tendency isrelated to thebubbly layer structure inthe fol-lowingsection.
3.2. Hydrodynamic study 3.2.1. Bubbly layer thickness
As illustrated by the high-speed camera picture of Fig. 2,the bubblylayerinthesteadysubcoolednucleateboilingregime con-sistsofamonolayerofsmallbubblesalongthewallthatcoversa partofthewall.TheimageprocessingdescribedinSection2.1 al-lowstodeterminethethickness D bofthisbubblylayerattachedto
thewallforeachpositionalongtheflowdirectionandateachtime frame.Fig.7-(a)illustrates,foragiventestcondition,thevariation ofthisthickness D b alonga 3cmlong sectionduringa 1.4s long
timesequence. D bisoftheorderof0.1cmandappearstobevery
homogeneousalongthe z direction.Spaceandtimeevolutionof D b
clearlysuggestssome bubblepathin themain flowdirection. D b
valuesduringstablenucleateboilingregime arethenanalyzedfor alargedata-set(280000points).Fromthevideosduringastable nucleateboilingregime,threetypicalbubblesizevariationscanbe distinguished:
• The bubble grows and begins to slide along the wall. During thisslidingmotionthebubblediameterisalmostconstantasit canbeseenwiththeinclinedstraight linesofthesamecolour (samebubblesize)inFig.7a.
• Strongsuddengrowthcan pushthetop ofthebubbleoutside ofthesuperheatedliquid;thebubblewillthencondense.
• Thebubblegrows rapidlyandis abletodepart fromthewall. Inthiscase,thisbubbleeithercondensesinthesubcooledflow, orstaysclosetothebubblelayerandpotentiallycoalescewith neighborbubbles.
Wetted area - The lower value of the data is 0 meaning that the algorithm does not detect any bubble contour above a spe-cific z location on the wall. According to our visual observation ofcorrespondingpicturesandtothecodingofthecontour detec-tion algorithm, it means that the pixel just above the wall does not showanydifference withthepure liquidcase. Thepixel size being80 µm, we interpret this0 value as thewall beinglocally
wettedandneglectthepotentialexistenceofverytinybubbles be-low this typical size.A firstanalysis corresponds to thestatistics ofhavinga0valueforthetimeandspacerangeofdataanalyzed. It allows defining a ratio P wetted whose value 1 corresponds to a
non-boiling regimeandwhosevalue 0corresponds toawall con-tinuouslycoveredbyabubblylayer.Foreachgiventestcondition, a single P wetted value is thus defined. Fig. 7-(b)shows the P wetted
valuesfordifferenttestconditions(testsection name,flow condi-tionsintermsof Re and Ja subandpowervalue
!
gen).Thetendencyis clear:forgivenflowconditions( Re and Ja sub), P wetted decreases
withincreasing
!
gen. Therefore,itcorrespondstothevisual obser-vationthatthewallisallthemorecoveredwithbubblesthanthe heatfluxislargeandthereforethenucleateboilingisintense.Data divergetoward1forsufficientlylowheatfluxvalues!
genthatcor-respondstovaluesclosetothelimitfortheonsetofnucleate boil-ing. Whereasthe Jakob numberimpact seems ratherlow forthe rangeinvestigated,theReynoldsnumbervalueclearlyimpactsthe data: for asame wall heat flux, thelarger the Reynolds number, the larger the value of P wetted. Thereforethe wall is all themore wetted than the bulk flow is large. This result can be linked to the thinningofthesuperheated fluidlayer astheReynolds num-berincreasesthatwillproducesmallerbubbles(dueto condensa-tionattheirtop) thatarenotdetected withthespatialresolution of a highspeed camera. Furthermore a higher Reynolds number willinducesmallerdetachmentdiameterforthebubblesthatwill condense in the subcooled flow. This resultcan explain the ten-dency observed inFigs. 6a and 6b. The contributionof the heat fluxduetonucleateboilingdecreasesastheReynoldsnumber in-creases.Nucleateboilingmaybepartlysuppressed.
Db distribution and mean value Let us now consider statistics concerning the thickness of the bubbly layer whenever it is de-tected on the wall. We therefore exclude zero Db values
(corre-sponding to the absence of detection of any bubble at a given time andlocation over thewall) fromthe dataand considerthe statistics oftheremaining non-zero Db values.The corresponding
statistics correspondthereforetothesizedistributionofthe bub-blylayeroverthewallandareillustratedbythegraphofFig.7-(c). The distributionfunctionisdiscretized bystepsof80µm accord-ing tothepixelsizeofthehigh-speedcameraimage. Thisbubbly layerthicknesshasvalueslyingbetween0.1mmto2mmandthe distribution function is very well fitted by a normal distribution law.Themostlikelysizeis0.7mm.
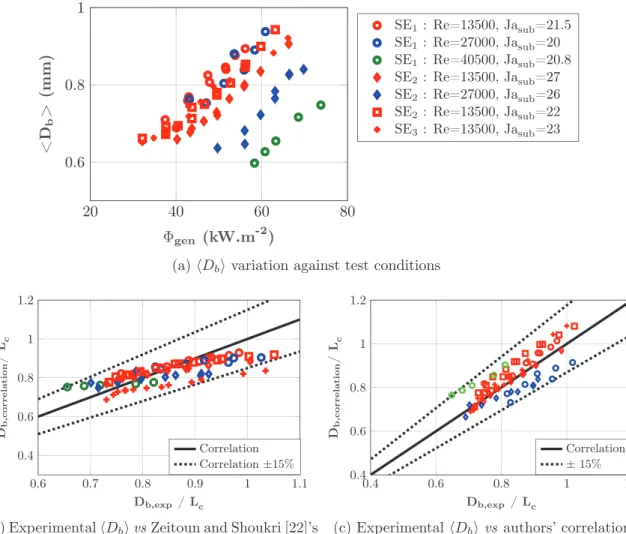
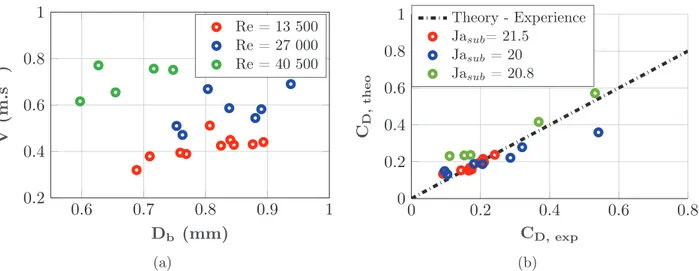
Db variation against test conditions- The mean bubbly layer thickness < Db > is plotted in Fig. 8a for various test
condi-tions. For givenflow conditions(same symbol), < Db > clearly
increaseswithheat flux,that canbe interpretedasahigherheat fluxassociatedwithlatentheattransportintheoverallheat trans-fer process. For a given wall-to-fluid heat flux, the meanbubbly layer thickness decreases with higher Jakob number orReynolds number. Subcoolingandflowrateclearlyenhancecondensation at thetop ofthebubblylayerthickness.Fromthispreviousanalysis, weidentifythedependencyofthebubblylayerthicknesswith re-spect!gen tothreemainparametersasbeing,theboilingnumber Bo =
hlv.G that scales the heat fluxwith the heat transfersufficient to
vaporize theentireliquidmassflux,theReynoldsnumber Re and the Jakobnumber Ja sub.Letusnote thatfromthevisual observa-tionofthehighspeedcamerapictures, thebubblylayerisclearly mono-layer. We then refer to the work of Zeitoun and Shoukri,
[22] thatempiricallyderived acorrelationfortheSautermean di-ameterofbubblesonaverticalwallwithwaterflowinginan an-nular section atlow pressures. In their study,they alsoobserved a mono-layerof bubbles and their sizes are measured thanks to a high-speedcamera thatfilmsbubbles fromabove.We therefore consider fittingourdatathanks to ZeitounandShoukri’s correla-tion.Inourexperiment,bothfluidandflowsectiongeometrydiffer
fromZeitounandShoukri’swork.Theparameters(empirical coeffi-cientsappearingintheformulaincludingexponentsofthepower laws) ofthis correlation havebeen adjusted by the leastsquares method.Thefittedcorrelationthenreads:
$
Db%
Lc = 0.69)
ρl ρv*
1 . 76 Re0 . 54%
Jasub+ 165 . 9(
ρl ρv)
1.76 Bo0.75.Re 1.73&
(9) with L c=+
σg#ρ ∼ 0.9 mm corresponding to thecapillary length.
Please consider that, since we did not vary the pressure, the
additional non-dimensional number considered by Zeitoun and
Shoukri[22] as the density ratio
ρ
l/ρ
v is constant in ourexper-iments andthat we kept the same 1.76 power coefficient in the correlation.
The comparison of this correlation with the experimental re-sults fordifferent parameters andtest sections is represented in the Fig. 8b. This correlation correctly approaches our measure-ments inthe range
!
gen ∈ [35- 90]kW.m−2 whichcorrespondstoboilingnumber Bo ∈ [4.10−4 -2.10−3 ], Re ∈ [13000-41000],
Ja sub ∈ [20-30]. Thedifference betweenthemodelandthe
ex-perimental results remains rather small on the range of our pa-rameters (lower than 15%),considering that thebubble diameter distributionsarequitelargeinourexperiments.However,this cor-relationseems to over-predict thesmallestbubble diametersand tounderestimate thelargestones. We thereforeproposeda best fittingofourexperimentaldataversus Bo, Re and Ja subnumbers:
Db
Lc =
49.419+5.846BoRe
Re0 . 3 Ja0 sub. 7 (10)
The comparison of this correlation with respect to our experi-mentaldata is plottedin Fig.8c andshowsto agree betterwith our datathan the adaptation of Zeitoun andShoukri correlation. Ourproposedcorrelation dependsontheparameters
!
gen, G and T sat− Tl independently through the dimensionless numbers BoRe, Re and Ja sub,respectively.Itallowstoconsiderthefollowingcorre-lationsbetweenindividualparametervariation:
• Whentheheatfluxincreases,onlythe BoRe valueincreasesand thebubblediameterincreases
• When Ja subincreases,thedenominatoroftheequationwill in-creasethusdecreasingthebubblediameter,whichisconsistent withthefactthatthestrongsubcoolingresultsinsmaller bub-blediameters.
• Asthemassfluxincreases,theReynoldsnumberincreases,the denominatorofthe equationwill increasethus decreasingthe bubblediameter.Thisresultconfirmsthedecreaseinthe bub-blesizewithincreasingtheflowvelocity.
3.2.2. Bubbles velocity
Fromvisualobservation,seee.g.Fig.2,manyvaporbubblesare presentalongtheaxisofsymmetryofthefoilandslidealongthe wall in the main flow direction. Let us consider the analysis of their velocity. Bubble velocity on raw images of the high-speed camera are complicated to determine from an image processing based on a Lagrangian tracking of particles mainly because they are soclosefromeach other that a contourrecognition doesnot easily identifyindividual particles. Nevertheless,oblique and par-allellinesare distinguishedclearlyinFig.9.a:thoselinesare tra-jectoriesofthepatternsofthebubblylayerthatweassumeto cor-respondtobubblepaths.
Toquantitatively estimate the velocities along thetrajectories, analgorithm thattrackstheseobliquelines slopesonthe experi-mentallymeasured D b(z,t)fields(likeFig.9.a)hasbeendeveloped.
Trajectoriesareidentifiedthankstosamplesoftrackedcorrelations inthe spaceandtime diagram ofbubbly layerthickness D b(z, t ).
Fig. 8. Mean bubbly layer thickness < D b > for different experimental conditions.
Fig. 9. a. Trajectories of bubbles obtained in two different zones (black lines) on a spatio-temporal curve and b. Probability density and average velocity obtained for 30 tests in (b) with SE1 : Re = 13 500 and #Tsub = 13 o C, Ja sub = 21.5.
Fig. 10. a. Experimental velocity determined for bubble diameter range of 0.6 to 1 mm on SE1 and b. Comparison of the experimental drag coefficients with the theoretical values obtained by Shi et al. [1] .
Trackingalgorithmisasfollows.Firstastartingpointisrandomly selected across non-zerovaluesin theorder ofmagnitudeofthe meanbubblesizealongthebottomlineofthediagram(lower po-sition z 0 along the flow direction). It corresponds therefore to a given value D b(z 0 , t 0 ) of the diameter at a specific time t 0 .
Sur-rounding D b valuesare then filtered thanks toa weighting func-tion p (z, t ), an Euclidian transformation that equals the distance withrespectto(z 0 , t 0 )tillanarbitrarythresholdvalueandcancels overthisvalue.Thenextpositionofthetrackedtrajectoryis iden-tifiedasthemaximalvalueof p (z, t )∗D b(z, t ),thatis(z 1 , t 1 ),inthe
neighborhood of (z 0 , t 0 ). The process is then repeatedtill either
z =zmin atthetop (here zmin =0cm)ofthediagram or t =tmax
at therighthand side ofthe diagram (here tmax =1.5s). The ob-tained trajectoriesarerelatively straightlines,parallel tothe pat-tern visuallyseen onthe diagram asillustrated bythe two black lines on Fig. 9 a. For giventest conditions,30 different trajecto-ries are randomly selected.For each trajectory, the averageslope isthendeterminedandassociatedtothebubblevelocityalongthe wall V exp .
Statistics on V exp values for a given test condition are rep-resented in Fig. 9.b as a probability density function over ! 0.5 m.s−1 width intervals. Scattering around the mean value (indicatedbytheredline)isratherlow.
Themeanbubblevelocity V isplottedversusthemeanbubble diameter D b fordifferenttest conditionsinFig.10a.Thisvelocity
increases with the bubblediameter and withthe liquid velocity. The bubble relative velocity V R = V − u can also be calculated, u
beingtheliquidvelocityatthepositionofthecenterofgravityof thebubble D b/2.Thevelocityprofileinthesemi-annulargapclose to theinnercylinderiscalculatedfromthelogarithmiclawgiven byKanedaetal.[14] u+ =uu ∗= A+1
κ
ln(
y+)
(11) y+ =ρ
yu∗µ
(12)where y isthedistancetothewall, u ∗=
+
τwρ isthefriction
veloc-ity. Thewall shearstress
τ
w hasbeen measuredby Baudin etal. [9].Theconstant A isestimatedbyKanedaetal.as A =6.13andκ
isthevonKarmanconstantκ
=0.436.Therelativebubblevelocitiesrangefrom0.1m.s−1 to0.3m.s−1 . Fromthemeasurementofthebubblerelativevelocityitispossible todeterminethedragcoefficient C Donthebubblesfromabalance
betweenthebuoyancyforce F Bandthedragforce F D:
FB+FD=0 (13) FD=−ρ
π
(
Db/2)
2 2 CDV 2 R (14) FB=π
D3 b 6(
ρ
l−ρ
g)
g (15)The dragcoefficients obtainedexperimentally from the measure-mentof V R arecomparedtothetheoreticalexpressionderived by
Shi etal.[1]fromnumericalsimulations ofa slidingbubblein a shearflowinawallvicinity:
CD=CD0
(
1+#
CWD)
(16)#
CWD =0.47L−4R +0.0055L−6 R Re 3 / 4 b +0.002S 1 . 9 R Reb +0.05LR−7 / 2 SRRe1 b/ 4 (17) where Re b=2(Db/ 2) VRρµ , L R=2L/D b, L beingthe distancebetween
the center of gravity of the bubbleand the wall, S R=
γ
D b/VR isthedimensionlessshearrate,
γ
=d u/d y and C D0 isthedragcoeffi-cientofMeiandKlausner[23]forasphericalbubbleinaquiescent liquidandunboundedmedium:
CD0 = Re16 B
1+.
8 ReB+ 1 2.
1+3/
.315 ReB0
0
−1
(18)Theexperimental dragcoefficientsplottedinFig.10b areingood agreementwiththetheoreticalexpressionextrapolatedfor L R=1.
One discrepancy is observed for the largest value of C D which
correspond to thehighestvalues ofthe dimensionless shearrate
S R> 0.8outoftherangeofthenumericalsimulationsbyShietal. [1]performedfor S R≤ 0.5.Thegoodpredictionofthebubble
rel-ativevelocity foralarge rangeofheatfluxesandReynolds num-bers isof great interest forthe elaboration of an advanced heat transfer model based on heat flux partitioning.The effect of the bubbles’slidingalongthewallinverticalflowhasnamelyan im-portantcontributioninthe totalheatflux transferredtothe fluid (Basuetal.[24]).
3.3. Imposed temperature
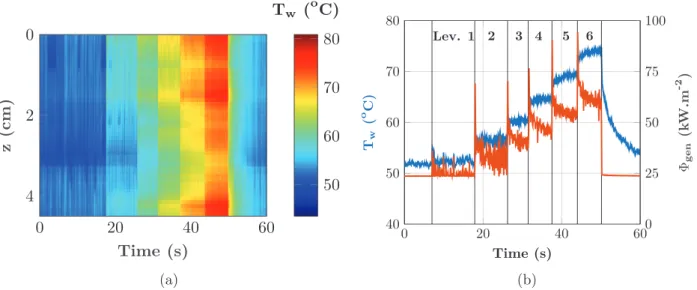
With the help of the P.I.D. control system, it is possible to impose constant wall temperatures and therefore deduce boiling curves.First,aspatio-temporaldiagramofthetemperatureisgiven
Fig. 11. a. Spatio-temporal temperature diagram of the nucleate boiling regime when the temperature is imposed and b. Axial average of T w with generated heat flux
synchronization, Re = 13 500, #T sub = 14 ◦C, Ja sub = 22.
Fig. 11.a.The different temperature levels are easily identifiable herewithdelimitedareasintime.Theheatfluxgeneratedbythe P.I.D. toobtain theseconstanttemperatures isshowninFig.11.b. TheresultsaredeterminedononetestsectioncalledSE4 .
The controlsystemP.I.D.correctlyfollowstheinstructions:the temperature averagein thefoil (measuredfromthe resistance of the foil) is constant evenfor thehighest values.The overheating obtained can be of the order of 40 ◦C or more. These
tempera-turelevels areparticularlyhighforanucleateboilingregime and cannot be classicallyreachedforconstant powerlevelcontrols. It allows describing the nucleateboiling process athigher wall su-perheatsinsteadyconditions.Ateachset-pointlevel,anovershoot onthegeneratedheatfluxisobservedthenarelativelyfast stabi-lization towards a constantgenerated fluxis reached. Inorderto characterize thecomplexityofthetransientregime,the probabil-itydensityfunctionofthewalltemperatureforeach temperature level,isestimated.Frequencyacquisitionoftheinfraredcamerais 500Hzandeachtemperaturelevellastsonaverage5seconds.
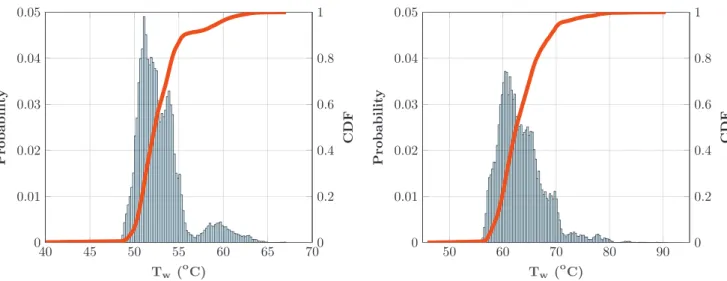
In order to investigate the wall temperature distribution at a steady temperature level, a similar analysis to Golobiˇc and Zu-panˇciˇc [11] is performed. There are 2500 images in total, which makes a total of3,300,000 temperaturepointsfor each constant temperaturestep.Theprobabilitydensityaswellasthecumulative distribution function(CDF) arecalculated forthreelevels of tem-peratureplateauintheFig.12a-c(correspondingto#1,#3and#6 test conditionsofFig.11).TheCDF(in orangeonthecurve)isan averageofeachCDFdeterminedforeachtimestep.Thedifference islessthan1%andsoremainsstableintimetobeabletoconsider anaverageCDF.
Nucleate boiling isfullydeveloped onthe wall,yetthe densi-tiesofprobabilitiesinFigs.12(a-c)showone peakfollowedbya temperaturetail.Afirsttemperaturepeakthatcorrespondstothe settemperatureandatailwherethetemperaturesarehigherand correspond(fromanIRpicturesanalysis)ofseveraldifferent local-izedareas.These,socalled,hotspotsarethusinterpretedasbeing either areas where boiling has not been triggered (for low tem-peratures Fig. 12.a and.b),orzonesof intense vaporization(close to the vapor film)which insulatethe wall of theliquid (valid at hightemperatures,Fig.12.c).Inthislattercase,higheris the im-posed temperature, the morethese areasappear anddisturb the thermalsystem.Thesehotspotsarethesameforeachdistribution andareprecursorsforthefilmboilingestablishment.Aspreviously pointedout inFig.3b,itbecomesmoredifficulttoreach the
im-posedresistance,throughtheP.I.D.controlofthesystemwhenthe temperatureishigh.
A spatio-temporal diagram of the heat flux transferred to the liquidisdeterminedfromthespatio-temporaldiagramofthe tem-perature (Fig. 11) andis illustrated inFig. 13.a. The wall to fluid heatfluxappearsnottodependonthezpositionforeachimposed temperaturelevel. Fig. 13.b isa local boiling curve (taken in the middleofthesectiontest).ThedifferentovershootsintheFig.13.b comefromtheP.I.D.andarecharacteristicsofitsregulation param-etersto adaptthe fluxto thetemperatureset point.Inour tests, to maintain the constant temperature to the set-point, the P.I.D. quasi-instantaneouslyadaptsthepowerthatleadstoovershootin heatfluxatthetimeofchangingtheset-pointasshowninFig.11. Foreach step intemperatureduringa typical test, theovershoot lastsa few ms beforestabilization.The flux andthetemperature haveahighvariabilityduringeachimposedtemperaturelevelbut itisalwayspossibletoextract aclassicalaverageboilingcurve by averagingthewalltofluidheattransferoneachaxialposition z for eachtemperaturelevel.ThisyieldstothefittedcurveonFig.13.b. Thestandard deviationbetweentheaverageboiling curveand the local one is only 2.5% for this test. Similar standard devia-tions are obtained for all the test performed and thus average boiling curvescan be compared to those resultingfromimposed power tests. OnFig. 14, we plottedwith linesthe boiling curves obtainedfordifferentflowratesconditions:itshowsverylittle im-pactoftheReynoldsnumbervalueon thewall-to-fluidheat flux. Thesametrendpreviouslyobtainedfortheimposedpowertestsis thusrecovered.
3.4. Power vs temperature
Powercontrolandtemperaturecontrolofthesystemare com-paredonthesameboilingcurveontheFig.14.
Forthesame fluxtransferred to theliquid,theoverheating at the wall ismore importantduring temperaturecontrol: heat ex-changes are thereforerelatively degraded. Tokeep constant over-heatingasintenseaspossible,thecontrolsystemhastoadaptthe generated heat flux quicklyandirregularly to avoidboiling tran-sient nucleus. The establishment of P.I.D. changes for each test section and especially the temperature levels are not identical. Indeedforsignificantoverheating,theresistance ofthe foilisnot necessarily linear with the temperature, which implies that the P.I.D. takes a little more time to react. Because of these settings
Fig. 12. Statistical study on the temperature field.
Fig. 13. a. Spatio-temporal diagram for the heat flux transferred to liquid during nucleate boiling regime when the temperature is imposed and b. Local boiling curve with the averaged heat flux on a test where Re = 13 500, #T sub = 14 ◦C, Ja sub = 22.
Fig. 14. Boiling curves with power control (point) and temperature control (solid line) depending on the overheating at the wall for several flows (red = 13 500, blue = 27 0 0 0, green = 40 500) and subcoolings ( #T sub : ! / + = 15 ◦C, " = 17 ◦C,
line- " = 14 ◦C and Ja sub : ! / + = 22, " = 27, line- " = 22.) . (For interpretation
of the references to colour in this figure legend, the reader is referred to the web version of this article.)
in particular, the temperature, and thus the flux generated, will go througha transitional phase beforestabilizing.Aspecificity of thetemperaturecontrolresultsisthusa highscatteringofpower andtemperaturevaluesaroundtheirmeanvalueretainedfor com-parisonwithpowercontrolresults.Wedidnotidentifysome cor-relation between instantaneous temperature and heat flux value and therefore can not rely on these fluctuations to any specific boiling mechanismthat could help interpreting the difference in heattransferefficiencywithrespecttomorestablecasesofpower control. Perspectivescould be to analyzemoredeeply those fluc-tuations, attemptingto identifysome frequencies,butalsoto ob-servesynchronizedhighspeedcameratoseewhetherthose ther-mal fluctuations could be relatedto some specific events within thebubblylayer.
4. Transientnucleateboiling
High-speedtemperaturerampsareimposedthankstotheP.I.D. Thedifferentrampscanbeeitherlowfrom1to50K.s−1 ,andthus becomparedtothetestsofAuracherandMarquardt[2],orsteeper from50to 500K.s−1 ,to obtainfasttransientscloserto the phe-nomenaobservedduringaRIA.PlotsofFig.15illustratetimeand spacewall temperaturevariationsfordifferentP.I.D.setups yield-ing to low ramps for a Reynoldsnumber value of 27 000 anda subcooling
#
Tsub=14◦C.A comparisonbetweentheimposed temperature(throughthe value ofaverageresistanceofthefoilonits length)andthe aver-age temperaturemeasured by Infrared Thermography showsthat the P.I.D. correctly generates constant temperature increase rates (Fig. 15 d-f). However, the higher thedesired temperature ramp, the lower the accuracy of theP.I.D. Figs. 15 show that takingan averageofthetemperaturedoesnotallowtorepresentallthe phe-nomena(boilingincipience,hot spotformation,...)thatcanappear on thewall.It isnecessaryto takeinto accountthe standard de-viationstoensureintervalsoftrustforalltests.Thisstandard de-viation is atmost 2 ◦C: thislow value allows us to consider an
axial average.The resultsobtainedforseveraltemperatureramps areshowninFig.16.
The resulting wall temperature ramps as recorded by the IR camera areplottedinFig.16.Theacquisitionfrequencyofthe
in-fraredcamera isequalto500Hzandthefastesttestlasts0.05s, whichproduces25framesduringthetemperatureramp.The char-acterization of the heat transfer at these high heating rates is thereforepossibleexperimentallybutalittlelessaccurate.
4.1. Comparison of steady and transient heat fluxes
Theboilingcurves(heatfluxversuswallsuperheat)areplotted fortransientnucleateboilingandcomparedtothesteadystatein
Fig.17.
The results show that the higher the heatingrate, the higher theheatfluxtransferredtothefluid.Theseresultsarequalitatively similartothoseofAuracherandMarquardt[2].
Curves have a common starting point (the beginning of the ramp) thanks to a normalization with respect to the initial
!
wvalue (all tests begin from approximately the same condition), noted
!
NB,0 .Thisvalue correspondstotheheatfluxinthesteady nucleateboilingregimewithimposedwalltemperatureTNB,0pre-cedingthetemperatureriselinkedtotheheatingrateattNB.Note
that
!
NB,0 corresponds to the generated heat flux which is alsoequaltotheheatfluxtransferredtothefluidinsteadystate.It ap-pearsthatthetimeevolutionisallthemoresteepthantheramp issteeper,the inflexionchanging fromconcaveto convexforthe steepest ramps. The time evolution ofthe wall-to-fluid heat flux duringarampcanbethenestimated.
Thetestslast between0.5s (for thesteepest ramp) and2.5s (forthelowest).TheP.I.D.imposes,atveryshorttimes,arapid in-creaseofthegeneratedheatfluxbeforereachingalower increase rate.Theratio
!
w/!
NB, 0 increaseswiththeheatingrate.Thisratiocanbefittedbyapowerlawthatdependsonacharacteristictime scale
τ
ofthetransientheatingaccordingto:!
w(
t,dT/dt,Re,Ja)
!
NB,0 =3
t− t NB,0τ
4
A0(Re,Ja) +1 (19)A 0 isavariablethatdepends,apriori,ontheparametersofthe
experimental system, Reynolds numberand Jakob number based
on thesubcooling ofthe flow. It is specified herethat the influ-enceofsubcoolingcouldnotbestudiedinthecontextofthis ex-perimentalcampaign.Toreducethevariabilityassociatedwiththe specificity of each test section, evolutions are presented for the sametestsection.
InFig.18thefittedvalue oftheparameters
τ
and A 0 are plot-tedagainstthemainparameteroftheramp,namely dT /dt .Forthe lowestramps,τ
and A 0 areclearlycorrelatedto dT /dt ,whiletrends cannotbe inferredforsteepestrampsandthefittingbyapower law(19)doesnot seemrelevant.Forthelowest ramps,the value of A 0 isalways larger than 1that leadsto time evolutionthat is consistent withtheprevious remarks.Forthe lowest ramps,τ
is clearlyadecreasingfunction of dT /dt that canbe wellfittedby a 1/x law.Therefore,thetypicaltimescalefortheheatfluxvariation isclearlyrelatedtothetypicaltimescaleofthetemperatureramp. This motivates to model the heat flux variation with respect toinstantaneoustemperaturevalueratherthanwithtime.Forthe lowest ramps, thevariation of wall temperaturewithtime obeys thelinearlaw:Tw= dT dt
(
t− tNB,0)
+TNB,0 ⇒ t− tNB,0 =(
Tw− TNB,0)
dT dt (20)Thustheheatfluxtransferredtotheliquidcanbemodeledby:
!
w=!
NB,03
Tw− T NB,0 dT/dt 1τ
4
A0(Re,Ja) +1 (21)4.2. Comparison with Auracher and Marquardt
Acomparisonbetweenthemodelandtheexperimentalresults isgiveninFig.19a.forourexperimentsandinFig.19 b.forthe
Fig. 15. a-c. Spatio-temporal field of the wall temperature at the center of the foil for several temperature ramps. d-f. Comparison between mean wall temperature (set value in red) and the temperature deduced from the resistance of the foil (in blue). With Re = 27 0 0 0, #T sub = 14 ◦C, Ja sub = 22. (For interpretation of the references to colour in
this figure legend, the reader is referred to the web version of this article.)
Fig. 16. a. Slow temperature ramps and b. Steep ramps as measured by the infrared camera for Re = 27 0 0 0 and, #Tsub = 14 ◦C, Ja sub = 22. (For interpretation of the references
to colour in this figure legend, the reader is referred to the web version of this article.)
experiments of Auracher and Marquart. The model correctly de-scribes the heat flux forheatingrates lower than 50 ◦C.s−1 .The
valuesofthefittingparameters:characteristictimescaleand con-stantA0 aredisplayedinTable2forthetwo studies.Thetestsof AuracherandMarquardtandourtestscanbeapproachedwiththe samecharacteristictimescalefoundinFig.18becauseboth exper-iments are performedwiththe sameheatingrates.However, the ratiobetweentheheatfluxinthetransientheatingandinsteady state evolves differently in Auracher and Marquardtexperiments andinours.In bothexperiments,theinitial conditionisa steady nucleate boiling regime at a constant temperature TNB,0 , butthe
initial heat flux
!
NB,0 is much lower in ourexperiments. In theconditionof an imposedwall temperature, the heatflux ismuch smallerthanwithanimposedpoweraspointedoutinFig.14.This initialconditionmayexplainwhytheheatfluxintransientboiling
Table 2
Comparison of the characteristic time scales and the parameter A 0 between our experimental re-
sults and Auracher and Marquardt study [2] . dT/dt τexp τAM A o,exp A o,AM
10 0.83 0.66 1.22 0.49 15 0.55 0.56 1.38 0.59 20 0.4 0.38 1.52 0.63 30 0.26 0.23 1.72 0.65 40 0.19 0.19 1.83 0.56 50 0.15 0.17 1.84 0.54
inourexperimentsismuchsmallerthanthatofAuracherand Mar-quardt.The2experimentsalsodifferbythethermalinertiaofthe
Fig. 17. Comparison between the steady and transient case for Re = 27 0 0 0 and, #Tsub = 14 ◦C, Ja sub = 22.
Fig. 18. a. Characteristic time scale τand b. Experimental variable A 0 : Parameters of the model according to several Reynolds number Re and imposed heating rates dT / dt ,
for #Tsub = 14 ◦C, Ja sub = 22.
heatedwall.Inourexperimentstheheaterwallisonly50µmthick whereasinAuracherandMarquardtexperimentsacopperblockof 5mm isused witha muchhigherthermal inertia.Then the boil-ing curvesevolution do not have the sameconcavity inthe two experimentsandtheconstantA0 ishigherforourexperiments.
5. Conclusion
In steady nucleate subcooled boiling regime with a constant heatingpower,thewall heatfluxcan bepredictedbythe combi-nationoftheheat transferduetoforcedconvectionandnucleate boiling.AmodificationofChencorrelationisproposedandallows to pointout thattherelative contributionoftheheatflux dueto convectionincreaseswiththeReynoldsnumberwhiletheonedue to bubble nucleation decreases. This tendency is consistent with our observationof the bubblylayer: the partof the surface cov-eredby thebubbles decreasesasthe Reynoldsnumberincreases. The diametersofthebubblesslidingalong thewallaremeasured byimageprocessingandarewellpredictedbyacorrelationbased ontheReynolds,JakobofsubcoolingandBoilingnumbers.The ve-locitiesalongthebubbletrajectoriesaremeasuredallowingthe es-timation oftheirrelativevelocity.Theserelativevelocitiesare be-tween 0.1 m.s−1 and0.3m.s−1. Adragcoefficient for thesliding
bubbles has beencalculated froma force balance andis ingood agreementwiththerecentnumericalsimulationsofspherical bub-blemotioninashearflownearawallperformedbyShietal.The resultsobtainedonthecharacterisationofthebubblelayer:bubble diameter, velocity,portion of the surfacecovered by the bubbles are ofa crucialinterest fortheimprovementofthe predictionof heat transfer insubcoolednucleate boiling.Namely themost ad-vancedmodelsbasedonheatfluxpartitioningrequirethesedata.
Steadyboilingisthenstudiedwithasetconstanttemperature. Undertheseconditions,strongheterogeneitiesonthetemperature field areobserved,especiallywiththeapparitionofhotspots.The heat transferisstronglydegraded bycomparisonwithheatingby a setpower. The specificityof the temperature control resultsis a high scatteringof power andtemperature values around their meanvalues.Afurtheranalysisofthesefluctuationssynchronised with thehigh-speed imageswould be necessaryfora better un-derstandingofthephysicalmechanisms.
Transientboilingisalsostudiedbyimposinghighconstant tem-perature increase ratesthanks to thededicated P.I.D. control sys-tem. The results are similar to those obtained by Auracher and Marquardt.Thewallheatfluxincreaseswiththeheatingrate dT/ dt.
For heating rates below 50 ◦C.s−1 , the heat flux time variation
scaled bytheheatfluxinsteadyboilingiswellfittedbya power lawofadimensionlesstime t/
τ
.Thetimescaleτ
isinverselypro-portionaltotheheatingrateforbothourexperimentsandthe ex-perimentsofAuracherandMarquardt.Theexponentofthepower law A 0 differsin thetwo studies.It dependson theflow param-eters (Reynolds number and subcooling) and the steady boiling regime precedingthe temperatureramps. Finallya correlationfor thewall heatflux intransientnucleateboilingregime versus the wallsuperheatisprovided.
Additionnalmaterial
Some flow visualisations are available on the website:
https://www.irsn.fr/en/research/theses-post- docs/theses/defended- thesis/psn-res/pages/2018-scheiff-study-transient-boiling-context-ria-accident-videos.aspx
DeclarationofCompetingInterest
Theauthorsdeclarethattheyhavenoknowncompeting finan-cialinterestsorpersonalrelationshipsthatcouldhaveappearedto influencetheworkreportedinthispaper.
CRediTauthorshipcontributionstatement
V. Scheiff:Methodology, Investigation,Formal analysis, Visual-ization, Writing - original draft. F. Bergame: Software,Writing -original draft. J. Sebilleau: Conceptualization, Resources, Supervi-sion,Writing -review & editing.P. Ruyer: Conceptualization, Su-pervision,Writing -review &editing.C. Colin:Conceptualization, Resources,Supervision,Project administration,Writing -review& editing.
Acknowledgments
ThisworkisfundedbyInstitutdeRadioprotectionetdeSûreté Nucléaire (IRSN) andÉlectricité de France (EDF) in the frame of their collaborative research programs. The authors would like to thankGregoryEhsesandSebastienCazinfromtheInstitutde Mé-caniquedesFluidesdeToulousefortheirtechnicalsupportonthe experimentalpartincludingvisualisationswithhigh-speedandIR cameras.
AppendixA. Powercontrol
Thisappendixpresentsthetechnicalpropertiesofthe temper-atureandpowercontrol,performedbyusingacontrolloop mech-anism:ProportionalIntegralDerivative.
Fig. A2. NI Embedded Control and Monitoring System for our application.
Fig. A3. LabView FPGA programming reconfigure a single FPGA chip.
The device used to control the system is a CompactRIO 9035 whichisanembeddedcontrollerwithdifferentintegratemodules developedbyNationalInstruments(Fig.A1).
The CompactRIO 9035 works with Linux real time processor
andusesthetechnologyreconfigurableFPGA(FieldProgrammable GateArray)toacquiresignalsandcontroldevices.TheCompactRIO 9035discusseswiththeHumanMachineInterfacebythelocal net-workviaEthernetport(Fig.A2).
FPGA technology increases the performance of the software program.TheFPGAcircuitryisachipthatoffersthesamecapacity asanelectroniccard(instantaneoussignalsprocessing).With Lab-ViewFPGAprogramming,thesystemenablesthedeploymentofan executablefileontheCompactRIOdevicethatreconfiguremillions logicgatesinsideasingleFPGAchip(Fig.A3).
For comparison,the time response of a DACsystem is25 ms while the time response of a RIO system is 25 ns. In addition, theP.I.D. controlloopofRIOsystemcanreacharateof200MHz andsimultaneouslyperformdataprocessing.Thus,withthe Com-pactRIO 9035, we have designeda P.I.D. control for high perfor-mance in terms of rapidity, stability andaccuracy. In this study, therampcontrolisexecutedat1000Sample/s.Thesignalsare ac-quiredat1000Hz andthe rateofP.I.D. control loopis200 MHz. Thesecharacteristicsarelargelysufficienttogeneratetemperature rampwithveryfasttransients(≥ 100K.s−1 ).
AppendixB.Thermophysicalproperties TableB1
Table B1
Thermophysical properties of different materials.
Solid
Foil properties at 20 ◦C (stainless steel AISI 304)
ρw (kg.m −3 ) C p,w (J.kg −1 .K −1 ) λw (W.m −1 .K −1 ) 7930 500 16.18 αw (m 2 .s −1 ) E w (J.K −1 .m −2 .s −1/2 ) e w (µm) 4 . 08 × 10 −6 8010 50 Solid Paint properties at 20 ◦C ρp (kg.m −3 ) C p,p (J.kg −1 .K −1 ) λp (W.m −1 .K −1 ) 1200 1480 0.13 αp (m 2 .s −1 ) E p (J.K −1 .m −2 .s −1/2 ) e p (µm) 7 . 3 × 10 −8 480 25 − 30 Fluid
HFE7000 properties at T sat = 35 ◦C and at P = 1 bar ρl (kg.m −3 ) Cp,l (J.kg −1 .K −1 ) λl (W.m −1 .K −1 ) 1376 1185 0.073 αl (m 2 .s −1 ) νl (m 2 .s −1 ) hlv (kJ.kg −1 ) 4.5 ×10 −8 2 . 8 × 10 −7 132 ρv (kg.m −3 ) σ(N.m −1 ) 7.9 4 . 7 × 10 −3
References
[1] P. Shi , P. Rzehak , D. Lucas , J. Magnaudet , Hydrodynamic forces on a clean spherical bubble translating in a wall-bounded linear shear flow, Phys. Rev. Fluids 5 (2020) 073601 .
[2] H. Auracher , W. Marquardt , Heat transfer characteristics and mechanisms along entire boiling curves under steady-state and transient conditions, Int. J. Heat Fluid Flow 25 (2) (2004) 223–242 .
[3] A. Sakurai , M. Shiotsu , Transient pool boiling heat transfer-part 2: boiling heat transfer and burnout, J. Heat Transfer 99 (4) (1977) 554–560 .
[4] S. Fau , W. Bergez , C. Colin , Transition between nucleate and film boiling in rapid transient heating, Exp. Therm Fluid Sci. 83 (2017) 118–128 .
[5] G.-Y. Su , M. Bucci , T. McKrell , J. Buongiorno , Transient boiling of water un- der exponentially escalating heat inputs. part II: flow boiling, Int. J. Heat Mass Transf. 96 (2016) 685–698 .
[6] V. Bessiron , T. Sugiyama , T. Fuketa , Clad-to-coolant heat transfer in NSRR ex- periments, Journal of Nuclear Science and Technologyy 44 (5) (2007) 723–732 .
[7] V. Bessiron , Modelling of clad-to-Coolant heat transfer for RIA applications, J. Nucl. Sci. Technol. 44 (2) (2007) 211–221 .
[8] R. Visentini , C. Colin , P. Ruyer , Experimental investigation of heat transfer in transient boiling, Exp. Therm Fluid Sci. 55 (2014) 95–105 .
[9] N. Baudin , C. Colin , P. Ruyer , J. Sebilleau , Turbulent flow and transient convec- tion in a semi-annular duct, Int. J. Therm. Sci. 108 (2016) 40–51 .
[10] V. Scheiff, N. Baudin , P. Ruyer , J. Sebilleau , C. Colin , Transient flow boiling in a semi-annular duct: from the onset of nucleate boiling to the fully developed nucleate boiling, Int. J. Heat Mass Transf. 138 (2019) 699–712 .
[11] I. Golobi ˇc , M. Zupan ˇci ˇc , Wall-temperature distributions of nucleate pool boiling surfaces vs. boiling curves: a new approach, Int. J. Heat Mass Transf. 99 (2016) 541–547 .
[12] J. Petkovsek , Y. Heng , M. Zupancic , H. Gjerkes , F. Cimerman , I. Golobi ˇc , Ir ther- mographic investigation of nucleate pool boiling at high heat flux, Int. J. Refrig 61 (2016) 127–139 .
[13]A . Richenderfer , A . Kossolapov , J. Seong , G. Saccone , E. Demarly , R. Komma- josyula , E. Baglietto , B. J. , M. Bucci , Investigation of subcooled flow boiling and CHF using high-resolution diagnostics, Exp. Therm Fluid Sci. 99 (2018) 35–58 .
[14]M. Kaneda , B. Yu , H. Ozoe , S.W. Churchill , The characteristics of turbulent flow and convection in concentric circular annuli. part i: flow, Int. J. Heat Mass Transf. 46 (26) (2003) 5045–5057 .
[15]V. Scheiff, Étude expérimentale et modélisation du transfert de chaleur de l’ ¸E bullition transitoire, Université de Toulouse, 2018 Ph.D. thesis .
[16]J. Chen , Correlation for boiling heat transfer to saturated fluids in convective flow, Industrial & Engineering Chemistry Process Design and Development 5 (3) (1966) 322–329 .
[17]F. Dittus , L. Boelter , Heat transfer in automobile radiators of the tubular type, Publication on Engineering 2 (13) (1930) 443 .
[18]H. Forster , N. Zuber , Dynamics of vapor bubbles and boiling heat transfer, AlChE J. 1 (4) (1955) 531–535 .
[19]D. Butterworth , The correlation of cross flowpressure drop data by means of a permeability concept, Technical Report, AERE-R9435, UKAEA, 1979 .
[20]J.G. Collier , J.R. Thome , Convective boiling and condensation, 3 rd , Oxford:
Clarendon Press, 1994 .
[21]N. Baudin , Étude expérimentale et modélisation de l’ ¸E bullition transitoire, Uni- versité de Toulouse, 2015 Ph.D. thesis .
[22]O. Zeitoun , M. Shoukri , Bubble behavior and mean diameter in subcooled flow boiling, J. Heat Transfer. 118 (1) (1996) 110–116 .
[23]R. Mei , J. Klausner , Unsteady force on a spherical bubble at finite reynolds number with small fluctuations in the free-stream velocity, Physics of Fluids A: Fluid Dynamics (1989–1993) (1992) 63–70 .
[24]N. Basu , G.R. Warrier , V.K. Dhir , Wall heat flux partitioning during sub- cooled flow boiling: part 1model development, J. Heat Transfer. 127 (2) (2005) 131–140 .