HAL Id: hal-00608280
https://hal.archives-ouvertes.fr/hal-00608280
Submitted on 12 Jul 2011HAL is a multi-disciplinary open access archive for the deposit and dissemination of sci-entific research documents, whether they are pub-lished or not. The documents may come from teaching and research institutions in France or abroad, or from public or private research centers.
L’archive ouverte pluridisciplinaire HAL, est destinée au dépôt et à la diffusion de documents scientifiques de niveau recherche, publiés ou non, émanant des établissements d’enseignement et de recherche français ou étrangers, des laboratoires publics ou privés.
Quantitative CT imaging for adipose tissue analysis in
mouse model of obesity
Arnaud Marchadier, Catherine Vidal, Jean-Pierre Tafani, Sylvain Ordureau,
Roger Lédée, Christophe Léger
To cite this version:
Arnaud Marchadier, Catherine Vidal, Jean-Pierre Tafani, Sylvain Ordureau, Roger Lédée, et al.. Quantitative CT imaging for adipose tissue analysis in mouse model of obesity. SPIE Medical Imaging 2011, Feb 2011, Orlando, United States. �hal-00608280�
Quantitative CT imaging for adipose tissue analysis in mouse model of
obesity
A. Marchadier
a,c, C. Vidal
b, J.-P. Tafani
d, S. Ordureau
c, R. Lédée
aC. Léger
aa
Institut PRISME, UPRES EA n°4229,12 rue de Blois, 45067 Orléans, France;
bInstitut Pasteur and INSERM U747, 45 rue des Saints Pères, 75006 Paris
c
UsefulProgress, 23 rue d’Anjou, 75008 Paris, France
d
APCIS, 14 avenue du Général Leclerc, 94700 Maisons Alfort
ABSTRACT
In obese humans CT imaging is a validated method for follow up studies of adipose tissue distribution and quantification of visceral and subcutaneous fat. Equivalent methods in murine models of obesity are still lacking. Current small animal micro-CT involves long-term X-ray exposure precluding longitudinal studies. We have overcome this limitation by using a human medical CT which allows very fast 3D imaging (2 sec) and minimal radiation exposure. This work presents novel methods fitted to in vivo investigations of mice model of obesity, allowing (i) automated detection of adipose tissue in abdominal regions of interest, (ii) quantification of visceral and subcutaneous fat.
For each mouse, 1000 slices (100µm thickness, 160 µm resolution) were acquired in 2 sec using a Toshiba medical CT (135 kV, 400mAs). A Gaussian mixture model of the Hounsfield curve of 2D slices was computed with the Expectation Maximization algorithm. Identification of each Gaussian part allowed the automatic classification of adipose tissue voxels. The abdominal region of interest (umbilical) was automatically detected as the slice showing the highest ratio of the Gaussian proportion between adipose and lean tissues. Segmentation of visceral and subcutaneous fat compartments was achieved with 2D ½ level set methods.
Our results show that the application of human clinical CT to mice is a promising approach for the study of obesity, allowing valuable comparison between species using the same imaging materials and software analysis
Keywords: small animal imaging, medical CT, adipose tissue, gaussian mixture model, expectation maximization, level
set segmentation
1. INTRODUCTION
In human, the accurate determination of adipose tissue deposits throughout the body is an important issue in medical analysis of obesity. Different types of adipose tissue at different locations (subcutaneous versus visceral) play different physiological roles. Visceral adipose tissue is a significant risk factor for coronary artery diseases or diabetes [1] and more predictive of obesity-induced pathologies than total or subcutaneous adipose tissues. MRI and CT imaging techniques allow accurate and non invasive analysis of adipose tissue distribution. These imaging modalities differ in term of cost, reproducibility, accuracy and acquisition time. Both MRI and CT, have been used in 2D [2-6] and in 3D [7-12] in human. Better assessment of adipose tissue distribution is provided using a 3D region of interest than using a single slice [6].
Equivalent methods in murine models of obesity are still lacking. Micro-MRI technique was used for adipose tissue analysis in rodent but involves prohibitive costs and long acquisition time [13,14]. Current small animal micro-CT involves long-term X-ray exposure precluding longitudinal studies [15-17]. We have overcome this limitation by using a human medical CT which allows accurate and very fast 3D imaging and minimal radiation exposure. The resolution, reaches in the last generation of medical CT, is similar to the resolution needed to image adipose tissue in small rodent [16].
For both human and small animal, manual adipose tissue quantification is often performed using two fixed level of thresholds [15-17]. Several automatic methods have been developed to classify adipose tissue voxel using connectedness map [7] or FCM [4,5] and to segment visceral and subcutaneous compartments [4,5,10,13]
We present an automatic method that classify adipose tissue id 3D, segment visceral and subcutaneous adipose tissue and detect the abdominal region of interest. Our method uses Gaussian mixture model, expectation maximization algorithm like Positano’s method, and Chan-Vese based level sets.
2. MATERIAL AND METHODS
2.1 Method overviewA human medical CT was used for imaging adipose tissue in mice. The global data processing of the data included three studies : 1) a Gaussian mixture model (GMM) designed to identify voxels of adipose tissue and lean tissue, 2) analysis of GMM proportions along the mouse body in order to automatically define the region of interest and 3) segmentation of visceral versus subcutaneous adipose tissue using level sets method (Figure 1).
Fig 1: Fat tissue classification process
2.2 Mouse model of obesity
Male and female Swiss OF1, 10 weeks old, were obtained from the Charles River laboratory (France). The control group (n=8) received normal diet. Experimental obesity was produced in mice fed with highly energetic food pellets (A4010 rodent food pellets, Safe, Augy, France). Group1 mice (n=4) received a controlled amount of pellets. Group2 mice (n=4) was fed ad libitum (group2). For the CT imaging, mice were briefly anesthetized with isofluorane.
2.3 Scanning procedures
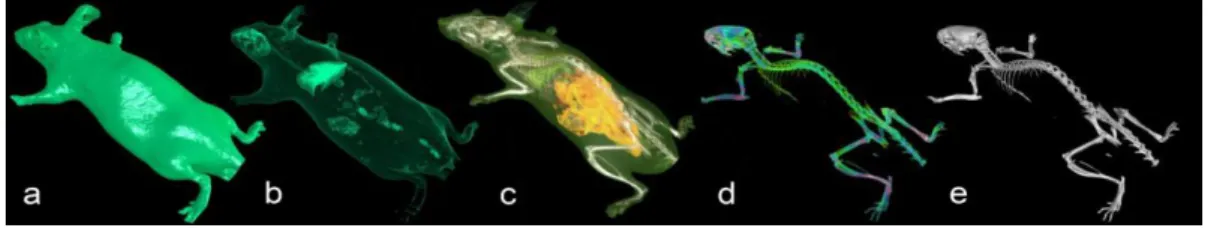
We used a medical multi-detector row CT (Aquilon 64, Toshiba Medical Systems Corp., Tochigi, Japan). The X-ray source was set with a voltage peak of 135 kV and a tube current of 400mAs. The imaging time of the mouse whole body was two seconds allowing the acquisition of 1000 slices. The resolution of the reconstructed image was a non-isotropic voxel of 160x160x100 µm. Figure 2 shows different views obtained from the same scan illustrating various organs and tissues visualization.
Figure 2 : Different views of the same CT scan of a mouse : skin (a), lung (b), adipose tissue (c), mineralization (e) and bone (e) visualisations
2.4 Voxel classification of fat and lean tissues
We focused the analysis on a subpart of the Hounsfield curve [-400 HU ; 300 HU] to avoid contribution of other tissues such as lung or bone. We used a mixture model of three Gaussians, two for adipose and lean tissues and one for others tissues. Each Gaussian can be expressed as:
(1)
where µ is the mean and the variance of the Gaussian function . The mixture model is the linear combination of three Gaussian functions as described below:
(2)
where G represents the Gaussian mixture model, is the proportion corresponding to the Gaussian function . The three Gaussian proportions are driven by the following equation:
(3)
For each Gaussian, three parameters were estimated by means of the Expectation Maximization algorithm (EM). EM is an iterative method which alternates between performing an expectation (E) step and a maximization (M) step [18]. The parameter values used at the initial step are shown in Table 1 :
Mean Variance Proportion Gaussian 1 : Fat -135 HU 2500 HU 0.3 Gaussian 2 : Lean 80 HU 2500 HU 0.3 Gaussian 3 : Others tissues 300 HU 2500 HU 0.3 Table 1: Values of the initialization of the parameters of the Gaussian model
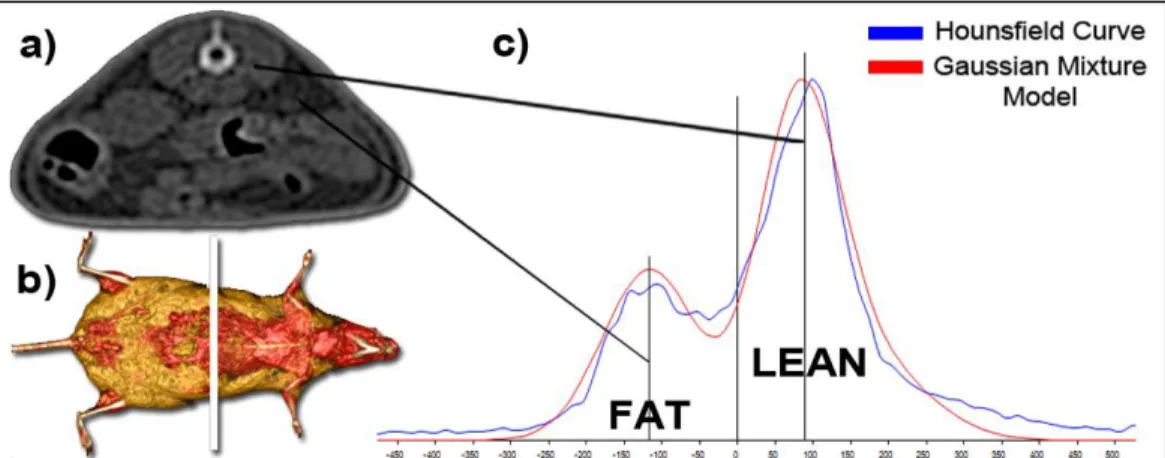
The Figure 3 illustrates the Hounsfield curve obtained from a slice in the abdominal area and the corresponding fitted curve obtained with the Gaussian mixture model (GMM).
Fig 3: On the left, example of 2D slice (a) and its localization on whole body mouse. On the right, Hounsfield curve of the slice and corresponding Gaussian mixture model of the distribution of fat and lean tissues (c).
Fig 4: Serial slice associated mixture model of the whole body.
Analysis of adipose tissue volumes was performed with two methods : 1) the GMM method and 2) the method with a Fixed Thresholding (FT method) range of [-250 HU ; -50 HU].
2.5 Automatic detection of the region of interest
We defined a reference abdominal slice of interest (corresponding to umbilical in human) by the image showing the highest amount of adipose tissue compared to amount of lean tissue. This slice was automatically detected using the proportions of the GMM previously computed as described in the following equations :
i lean i fat i R , ,
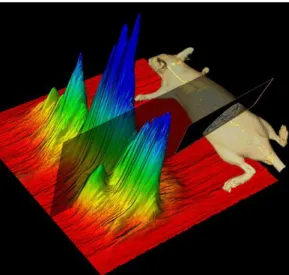
(4) ) ( maxi Ri I (5)where Ri represents the ratio of slice i, αadipose,i the proportion parameter of the adipose tissue Gaussian model of slice of index i, and αlean,i the proportion parameter of the lean tissue Gaussian model of slice of index i and I the index of the detected slice. The distribution of the ratio R along the body is shown in figure 5.
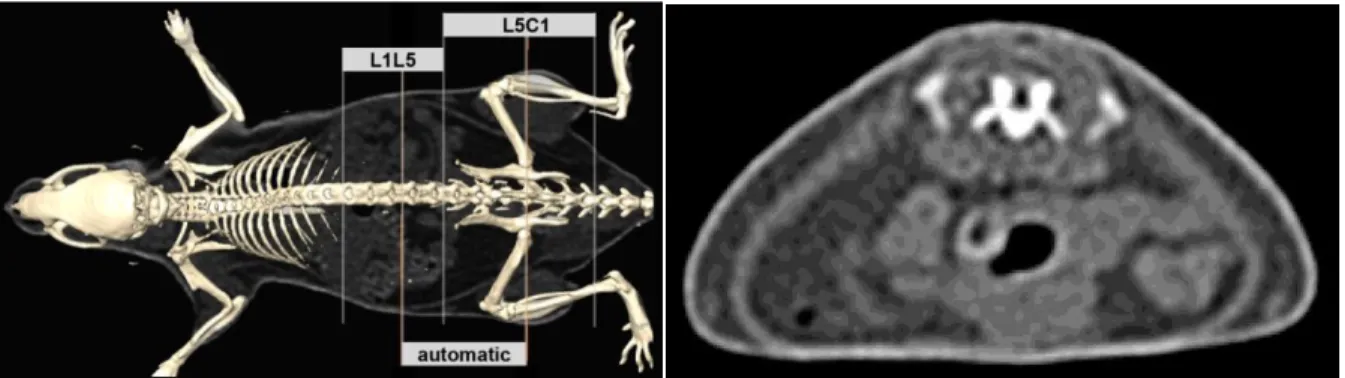
Figure 5 : The bottom curve shows the ratio R for each slice. The slice of interest has been detected around the slice numbered 300. The up picture illustrates the anatomical localization of the slice.
The Region Of Interest (ROI) included 200 slices (20 mm) centered on the detected slice. This ROI was compared to previously described regions of interest [] [], extracted manually in vertebral levels : 1) L1-L5 and 2) L5-C1.
2.6 Segmentation of visceral and subcutaneous adipose tissue
Segmentation of visceral adipose tissue (SAT) and subcutaneous adipose tissue (VAT) was performed using active contours. Our method was based on level set without edges [19] and used the dense implementation of the Chan and Vese method [20] available in the Insight toolkit (ITK) in 2D to segment the fat compartments limited by the abdominal muscular wall and the skin. The segmentation protocol was initialized on the slice of interest and then extended to the adjacent slices as a 21/2 method.
3. RESULTS
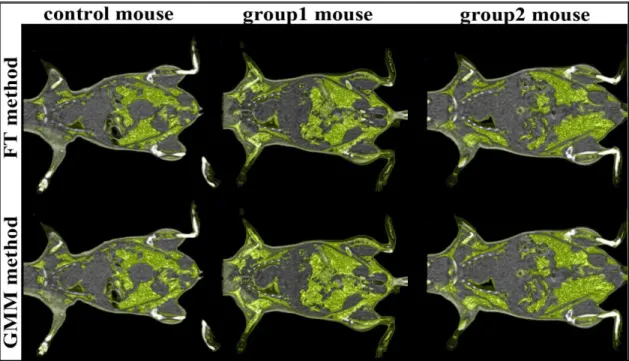
3.1 Analysis of whole body adipose tissue volumesFigure 6 shows the repartition of adipose tissues in obese and control mice using the GMM method and the FT method.
Figure 6 : Fat tissue visualization of a mouse of each group with the GMM method and with the FT method The quantitative analysis confirms the imaging data showing higher adipose tissue in obese mice than in control mice (Table2).
Group
Mice wheight
Total adipose tissue volume
in mm3 in g FT GMM control 33.9 +/- 3.5 2212.4 +/- 583.6 2063.2 +/- 365.5 group1 40.1 +/- 3.8 2795.2 +/- 491.5 3000.0 +/- 377.5 group2 42.8 +/- 3.3 3564.0 +/- 530.2 3308.8 +/- 120.1 Total 38.5 +/- 5.1 2768.8 +/- 692.8 2725.9 +/- 629.6
The comparative analysis shows minor differences between GMM and FT measurements. When adipose tissue volumes are correlated with the mouse weight, we obtain slightly better correlation with the GMM method than with the FT method (Table 3).
Group
Coefficient of correlation weight/adipose tissue volume
FT GMM
control 0.791 0.968
group1 0.952 0.981
group2 0.997 0.998
Total 0.937 0.981
Table 3: Coefficient of correlation between the weight and the adipose volumes computed with FT and GMM As the whole, these results demonstrate the validity of the GMM method as compared to the FT method.
3.2 Automatic detection of the region of interest
In our protocol, the automatic localization of the slice of interest was based on the relative amounts of adipose and lean tissues. Interestingly, this criteria corresponded to skeletal landmark : the lumbosacral junction of L6 and S1 vertebras. The mean distance between this landmark and the detected slice was of 1.01 +/- 0.45 mm. Figure 7 illustrates the ROI compared to others regions.
Figure 7 : Localization of the detected slice and comparison of the region with others area used in literature (left) ; detected slice of interest (right)
Group
Coefficient of correlation weight/fat volume
Automatic thresholds L1-L5 L5-C1 ROI control -0.9997 0.7661 0.9416 group1 0.8671 0.9993 0.9996 group2 0.9898 0.8874 0.9991 Total 0.1058 0.9157 0.9679
Table 4: Coefficient of correlation between the weight and the adipose volume for the three regions of interest. The adipose tissue volumes used for the correlation were computed with the automatic thresholds.
The volumes of adipose tissue were computed on the three regions showing a higher amount of fat tissue in group1 and group2 as compared to control (respectively : 1107.1 mm3, 1396.3 mm3, 816.9 mm3). Adipose tissue volumes in the ROI were better correlated with the body weight than the two others regions (Table 4).
3.3 Segmentation of visceral and subcutaneous compartments
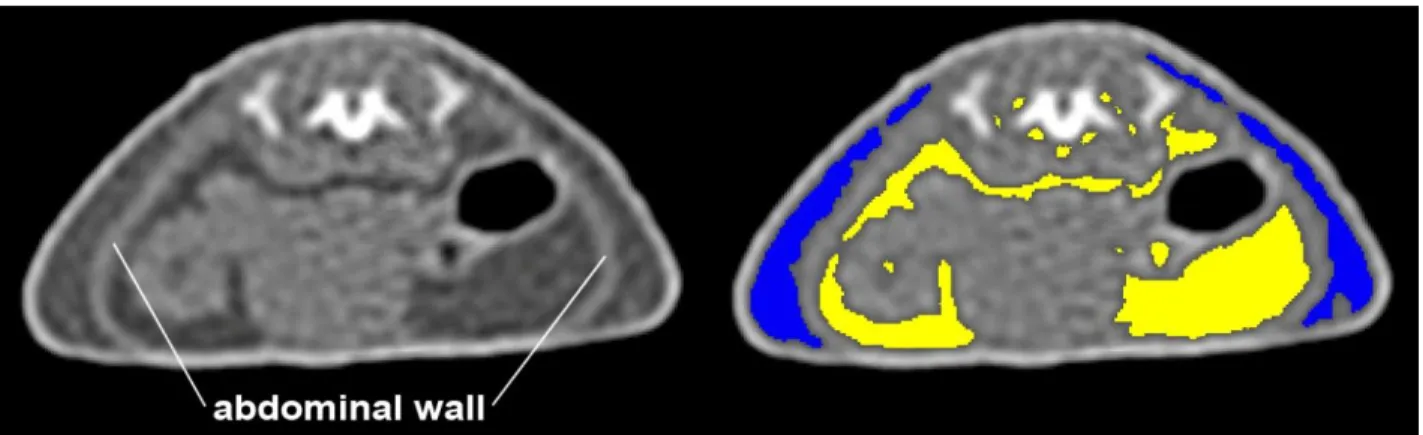
Figure 8 illustrates the visceral and subcutaneous adipose tissue compartments.
Fig 8 : Segmentation of fat compartments limited by the abdominal wall (visceral fat, yellow) and the skin (subcutaneous fat, blue) in the reference slice.
The segmentation protocol did not show any obvious correlation between weight and VAT, SAT and ratio VAT/SAT (Table 5).
Group
Coefficient of correlation weight/fat volume
VAT SAT Ratio VAT/SAT
control 0.410 0.580 0.061
group1 0.539 0.682 -0.857
group2 0.842 0.142 0.876
Total 0.694 -0.349 0.008
Table 5 : Correlation coefficients between weight and fat volumes in subcutaneous and visceral adipose tissue area and for the ration VAT/SAT
This result may be due to our animal model of obesity which exhibits relatively limited visceral fat accumulation as compared to genetically modified mice model of obesity.
4. CONCLUSIONS
This work presents novel methods fitted to in vivo investigations of mice model of obesity, allowing (i) automated detection of adipose tissue in abdominal regions of interest, (ii) automated detection of the region of interest, (iii) quantification of visceral and subcutaneous fat.
Our results show that medical CT imaging combined with automatic image analysis provide precise and reproducible quantification of adipose tissue in mice in vivo allowing repetitive examinations for longitudinal studies. This new approach in experimental animals is of particularly interest for the study of obesity, allowing valuable comparison between species using the same imaging materials and software analysis
REFERENCES
[1] J.C. Seidell, P. Bjorntorp, L Sjostrom, R. Sannerstedt, M. Krotkiewski, H, Kvist, "Regional distribution of muscle and fat mass in men – new insight into the risk of abdominal obesity using computed tomography", Int J Obes 13, 289-303 (1989)
[2] A.E. Summe, N.M. Farmer, M.K. Tulloch-Reid, "Sex differences in visceral adipose tissue volume among African Americans", Am J Clin Nutr 76 (2002)
[3] W. Shen, M. Punyanitya, Z. Wang, "Visceral adipose tissue : relations between single-slice areas and total volume", Am J Nutr 80 (2004)
[4] D. L. Sussman, J. Yao, R. M. Summers, "Automated fat measurement and segmentation with intensity inhomogeneity correction," Proc. SPIE Medical Imaging Vol. 7623 (2010)
[5] V. Positano, T. Christiansen, F. Santarelli, S. Ringgaard, L. Landini, A. Gastaldelli, "Accurate segmentation of subcutaneous and intermuscular adipose tissue from MR images of the thigh", Journal of Magnetic Resonance Imaging 29, 677–684 (2009)
[6] K. J. Ellis, B. Grund, F. Visnegarwala, L. Thackeray, C. G. Miller, C. E. Chesson, W. El-Sadr, A. Carr, "Visceral and Subcutaneous Adiposity Measurements in Adults: Influence of Measurement Site", Obesity 15(6), 1441-1447 (2007)
[7] S. A. Al-Attar, R. L. Pollex, J. F. Robinson, B. A. Miskie, R. Walcarius, B. K. Rutt, R. A. Hegele, "Semi-automated segmentation and quantification of adipose tissue in calf and thigh by MRI: a preliminary study in patients with monogenic metabolic syndrome," BMC Med Imaging, 6(11) (2006)
[8] D. D. Brennan, P. F. Whelan, K. Robinson, O. Ghita, J. M. O’Brien, R. Sadleir, S. J. Eustace, "Rapid automated measurement of body fat distribution from whole-body MRI," AJR 185, 418-423 (2005).
[9] Y. Jin, C. Z. Imielinska, A. F. Laine, J. Udupa, W. Shen, S. B. Heymsfield, "Segmentation and Evaluation of Adipose Tissue from Whole Body MRI Scans", Medical Image Computing and Computer-Assisted Intervention - MICCAI 2003, Lecture Notes in Computer Science, 2003, Volume 2878/2003, 635-642, DOI: 10.1007/978-3-540-39899-8_78
[10] P. S. Jørgensen, R. Larsen, K. Wraae, "Unsupervised Assessment of Subcutaneous and Visceral Fat by MRI", Image Analysis, Lecture Notes in Computer Science, 2009, Volume 5575/2009, 179-188, DOI: 10.1007/978-3-642-02230-2_19
[11] S. Makrogiannis, S. Serai, K.W. Fishbein, W. Laney, C. Schreiber, W.B. Ershler, L. Ferrucci, R.G. Spencer, "Automated Quantification of Muscle and Fat in the Thigh from Water-, Fat- and Non-suppressed MR Images", IEEE International Conference on BioInformatics and BioEngineering (BIBE) (2010)
[12] K. Furukawaa, T. Katabamia, Y. Nakajimab, T. Satoa, H. Katoa, R. Koganeia, S. Asaia, T. Matsuia, Y. Sataa, T. Kawataa, A. Kondoa, A. Ohtaa, Y. Tanaka, "Evaluation of whole-abdominal fat volume by 700-slice CT scanning and comparison with the umbilical fat area anthropometric indices", Obesity Research &Clinical Practice 4, e111-e117 (2010)
[13] S. Tu, S. Zhang, Y. Chen, M. T. Freedman, B. Wang, J. Xuan, Y. Wang, "Automatic tracing and segmentation of rat mammary fat pads in MRI image sequences based on cartoon-texture model", Transactions of Tianjin University, Volume 15, Number 3, 229-235, DOI: 10.1007/s12209-009-0041-2
[14] D. H. Johnson, C. A; Flask, P. R. Ernsberger, W. C. K. Wong, D. L. Wilson, "Reproducible MRI measurement of adipose tissue volumes in genetic and dietary rodent obesity models," Journal of Magnetic Resonnance Imaging, 28:915-927 (2008).
[15] A.L. Hildebrandt, D. M. Kelly-Sullivan, S. C. Black, "Validation of a high-resoltuion X-Ray computed tomography system to measure murine adipose tissue depot mass in situ and longitudinally," Journal of Pharmalogical and Toxicological Methods 47, 99-106 (2002).
[16] S. Judex, Y.K. Luu, E. Ozcivici, B. Adler, S. Lublinsky, C.T. Rubin, "Quantification of adiposity in small rodents using micro-CT," Methods 50, 14-19 (2010).
[17] Y.K. Luu, S. Lublinsky, E. Ozcivici, E. Capilla, J.E. Pessin, C.T. Rubin, S. Judex, "In vivo quantification of subcutaneous and visceral adiposity by micro-computed tomography in a small animal model," Medical Engineering and Physics 31, 34-41 (2009).
[18] A. Dempster, N. Laird, D. Rubin. "Likelihood from incomplete data via the EM algorithm". J Royal Statistical Society 739, 1–38 (1977)
[19] T. Chan and L. Vese. An active contour model without edges. In Scale-Space Theories in Computer Vision, pages 141–151 (1999).
[20] K. Mosaliganti, B. Smith, A. Gelas, A. Gouaillard, S. Megason, Level Set Segmentation: Active Contours without edge. The Insight Journal - 2009. http://hdl.handle.net/1926/1532