HAL Id: hal-00318056
https://hal.archives-ouvertes.fr/hal-00318056
Submitted on 3 Jul 2006
HAL is a multi-disciplinary open access
archive for the deposit and dissemination of
sci-entific research documents, whether they are
pub-lished or not. The documents may come from
teaching and research institutions in France or
abroad, or from public or private research centers.
L’archive ouverte pluridisciplinaire HAL, est
destinée au dépôt et à la diffusion de documents
scientifiques de niveau recherche, publiés ou non,
émanant des établissements d’enseignement et de
recherche français ou étrangers, des laboratoires
publics ou privés.
Long-term behavior of the Kelvin waves revealed by
CHAMP/GPS RO measurements and their effects on
the tropopause structure
M. Venkat Ratnam, T. Tsuda, T. Kozu, S. Mori
To cite this version:
M. Venkat Ratnam, T. Tsuda, T. Kozu, S. Mori. Long-term behavior of the Kelvin waves revealed by
CHAMP/GPS RO measurements and their effects on the tropopause structure. Annales Geophysicae,
European Geosciences Union, 2006, 24 (5), pp.1355-1366. �hal-00318056�
www.ann-geophys.net/24/1355/2006/ © European Geosciences Union 2006
Annales
Geophysicae
Long-term behavior of the Kelvin waves revealed by
CHAMP/GPS RO measurements and their effects
on the tropopause structure
M. Venkat Ratnam1, T. Tsuda1, T. Kozu2, and S. Mori3
1Research Institute for Sustainable Humanosphere (RISH), Kyoto University, Uji, Japan 2Faculty of Science and Engineering, Shimane University, Nishi-kawatsu Matsue, Japan 3Institute of Observational Research for Global Change (IORGC), Yokohama-city, Japan
Received: 4 August 2005 – Revised: 20 December 2005 – Accepted: 22 December 2005 – Published: 3 July 2006 Part of Special Issue “The 11th International Symposium on Equatorial Aeronomy (ISEA-11), Taipei, May 2005”
Abstract. The vertical and temporal variations of Kelvin
waves and the associated effects on the tropical tropopause were studied using long-term (from May 2001 to Octo-ber 2005) CHAMP/GPS (CHAllenging Mini satellite Pay-load/Global Positioning System) radio occultation (RO) measurements. The periods of these waves were found to be varying in between 10 and 15 days, with vertical wavelengths 5–8 km. These variations clearly show eastward phase prop-agation in the time-longitude section and eastward phase tilts with height in altitude-longitude, displaying the characteris-tics of Kelvin waves. The peak variance in the temperature is found over the Indian Ocean and into the western Pacific within the broad region of the equator. Kelvin wave am-plitudes were found significantly enhanced in the eastward shear of the quasi-biennial oscillation (QBO) and are con-fined in and around the tropopause during westward phase of QBO, where it extends between 17 and 25 km during the eastward phase of QBO and is damped away above, consis-tent with earlier reported results. The amplitudes are increas-ing durincreas-ing the months of Northern Hemisphere winter and sometimes they are highly sporadic in nature. Seasonal and inter-annual variations in the Kelvin wave amplitudes near the tropical tropopause coincide exactly with the tropopause height and temperature, with a sharp tropopause during max-imum Kelvin wave activity. A clear annual oscillation, along with a month-to-month coincidence is evident most of the time in both the tropopause height and Kelvin wave activ-ity, with maximum and minimum Kelvin wave amplitudes during the Northern Hemisphere winter and summer, respec-tively. In addition, a signature of quasi-biennial oscillation (QBO) in the tropopause structure is also seen in long-term tropopause variations, although the amplitudes are less when compared to the annual oscillation. In the westward phase
Correspondence to: M. V. Ratnam
of QBO (during strong Kelvin wave activity) at 20 km (in 2001–2002 winter and 2003–2004 winter), the tropopause height was slightly larger with a sharp tropopause and low temperature. The process behind these observed features has been discussed.
Keywords. Meteorology and Atmospheric Dynamics
(Mid-dle Atmospheric Dynamics; Waves and tides; Convective processes)
1 Introduction
The interaction between tropical convection, atmospheric waves and the large-scale atmospheric circulation has been recognized as being crucial in the understanding of the dy-namical processes in the equatorial atmosphere, such as per-turbations ranging from meso-scale (gravity waves) to plane-tary spatial scales (tides, Kelvin waves, etc.) in the upper tro-posphere and lower stratosphere (UTLS) regions. Among the various atmospheric waves in the tropics, the Kelvin waves are the most dominant with a planetary scale and have great practical importance in the Earth’s atmosphere. We employ in this study the CHAMP/GPS radio occultation (RO) data in 2001–2005, which provides a good opportunity to study the long-term behavior of Kelvin waves and their effects on the tropopause structure.
Using various observational techniques considerable progress has been attained in studying the Kelvin waves since their discovery by Wallace and Kousky (1968). These waves are eastward propagating (Matsuno, 1966), having periods from 3 to 20 days with vertical wavelengths of 5 to 12 km and are trapped within 15◦ of the equator (Andrews et al., 1987; Tsuda et al., 1994; Shiotani et al., 1997; Holton et al., 2001; Mote et al., 2002). These waves are assumed to be generated particularly by convective forcing, and remarkable
progress has been made in connecting the wave character-istics with the perturbations in cloud convection from out-going long-wave radiation (OLR). Therefore, they are of-ten called “convectively coupled” Kelvin waves which were also noticed with the pressure fields in the models (for exam-ple, Takayabu, 1994; Wheeler et al., 2000). Further, the up-ward propagating Kelvin waves have significant importance in stratospheric circulation, in addition to the gravity wave effects (Hitchman and Leovy, 1988).
A number of studies have been done using intensive radiosonde campaigns in characterising the Kelvin waves (Wallace and Kousky, 1968; Tsuda et al., 1994 and refer-ences therein; Sato et al., 1994; Holton et al., 2001; Shimizu and Tsuda, 1997; Fujiwara et al., 1998) and their impact on the tropopause. But network of these observations was small and hence the global morphology of Kelvin waves was poorly known. Later, satellite observations were used to study the global structures of the Kelvin waves. For example, Kelvin waves were studied using Nimbus-7 by Salby et al. (1984) and using Microwave Limb Sounder (MLS) measurements with ∼2.7 km vertical resolution by Canziani et al. (1995), Srikanth and Ortland (1998), Mote et al. (2002) and using cryogenic limb array etalon spectrom-eter (CLAES), having a vertical resolution of 2.5 km by Sh-iotani et al. (1997). All the height resolutions of these ob-servations are not good enough to retain the fine structures of Kelvin waves, which are sometimes confined to within the narrow layer near the tropopause.
A novel GPS RO technique has been introduced which is capable of providing global measurements with high ac-curacy and resolution. Tsuda et al. (2000) showed that the temperature fluctuations observed by GPS/MET occultations were appropriate for global studies of gravity wave activ-ities in the stratosphere. Randel et al. (2003) also stud-ied temperature variations in the tropical tropopause region with GPS/MET data and found characteristics of Kelvin waves, although the observation periods by GPS/MET were restricted to limited times.
The German (CHAMP) and Argentine (SAC-C) satel-lites were successfully launched in 2000. Using one-year data from CHAMP and SAC-C, for the first time, Tsai et al. (2004) showed the evidence of the Kelvin waves in the UTLS region. Randel and Wu (2005) extended the study with special emphasis on how these Kelvin waves are in-fluenced by background stratospheric winds and showed the link to tropical deep convection.
The present study further extends the analysis of Tsai et al. (2004) and Randel and Wu (2005), however, consid-ering larger data set giving more statically significant re-sults. Much attention has been given to find the extent of various background parameters on the observed Kelvin wave amplitudes by utilizing long-term CHAMP/GPS RO measurements, particularly emphasizing modulation of the tropopause structure by these Kelvin waves in more detail.
2 Database
2.1 Long-term global data: CHAMP/GPS RO observations The CHAMP/GPS satellite was launched on 15 July 2000 into an almost circular and near polar orbit (with the incli-nation of 87◦) with an initial altitude of 454 km; see Reig-ber et al. (2000) for the system details. The first occulta-tion measurement was performed on 11 February 2001, and since then, about 150–200 occultations per day have been recorded. For the present study, we use the level 3 ver-sion 005 data from May 2001 to October 2005, which were produced by the GeoForschungsZentrum (GFZ), Potsdam, using their standard method for the RO processing; see Wick-ert et al. (2001; 2005) for more details of the data analysis, its processing, initial results and validation. In comparison with radiosonde data, the temperature bias in the CHAMP/GPS RO data is less than 0.5 K. The height resolution varies from 0.4 to 1.5 km near the tropopause. The latitudinal and lon-gitude distribution of the radio occultations can be seen in Schmidt et al. (2004). Data has been interpolated to 200 m and considered in the height range between 10 and 30 km. 2.2 Long-term Singapore radiosonde data
For background wind information over the equator, long-term radiosonde observations over Singapore (1.36◦N,
103.98◦E, Station number: 48 698), with height coverage up
to 30 km from January 2001 to November 2005, has been utilized. The entire data has been interpolated to a height interval of 200 m, in accordance to CHAMP/GPS RO obser-vations.
2.3 Satellite outgoing long-wave radiation observations The daily gridded outgoing long-wave radiation (OLR) data provided by the NOAA Climate Diagnostics Center web-site (http://www.cdc.noaa.gov), interpolated in 2.5◦×2.5◦ latitude-longitude grids, have been archived during Jan-uary 2001 to August 2005 and used as a proxy for tropical deep convection.
3 Background conditions
The long-term monthly mean zonal velocity from Jan-uary 2001 to November 2005 observed at Singapore is plot-ted in the contour plot of Fig. 1a. The zonal wind veloc-ity, having oscillation of 24–26 months (Quasi-biennial os-cillation) with downward phase propagation, can be clearly noticed, particularly from 17 km and above, with peak am-plitudes around 28-km altitude. There exists two com-plete cycles of QBO during the entire GPS RO used for the present study, with westward and eastward directions during November 2001–March 2002, December 2003–April 2004 and April 2002–November 2003, May 2004–October 2005,
19
Figure 1. Height-time cross section of (a) monthly mean zonal wind (m/s) observed during January 2001 to November 2005 at Singapore. The vertical lines show the times of different phases of QBO considered for further analysis. (b) Longitude-time section of outgoing long-wave radiation (W/m2) observed during January 2001 to August 2005. Blue regions (low OLR values) correspond to area of deep convection.
Fig. 1. Height-time cross section of (a) monthly mean zonal wind (m/s) observed during January 2001 to November 2005 at Singapore. The vertical lines show the times of different phases of QBO considered for further analysis. (b) Longitude-time section of outgoing long-wave radiation (W/m2)observed during January 2001 to August 2005. Blue regions (low OLR values) correspond to an area of deep convection.
respectively, around the 20-km altitude. The westward winds are always noticed below 17 km with peak amplitudes around 14.5 km during the Asian monsoon months (June–August), although the intensity is smaller than at mid-latitudes.
The longitude-time section of OLR observed from Jan-uary 2001 to August 2005 is shown in Fig. 1b. Note that enhanced convection (low OLR values) is particularly oc-curring in between the 60◦E and 180◦E longitudes (Indian ocean to Pacific), with significant enhancements during the Northern Hemisphere winter months. There exists another enhancement over the South American continent (around 300◦E longitude), however, restricted to a narrow region with less intensities when compared to the former case.
4 Long-period oscillations (Kelvin waves)
The global variability of the Kelvin waves has been studied using long-term CHAMP/GPS RO observations. Previous studies reveal that the dominant wave number is 1 and/or 2 (Mote et al., 2002; Tsai et al., 2004; Randel and Wu, 2005). For the extraction of Kelvin waves with dominant wave num-bers 1 and 2, using GPS measurements, the procedure imple-mented by Tsai et al. (2004) is closely followed. In brief, we have selected latitudes within ±10 deg from the equa-tor, considering that Kelvin waves are dominant in ±15 deg (Mote et al., 2002). Tsai’s procedure involves three steps.
First, 30-day median profiles (15 days before and after) were removed to obtain temperature fluctuations (Ts). In order to avoid the contribution by inertia-gravity waves, in the second step profiles are further smoothed in altitude, with a cutoff at 4 km using 2 Chebyshev low-pass filter, considering that the inertia-gravity waves often have vertical wavelengths of about 2–3 km (Tsuda et al., 1994; Shimizu and Tsuda, 1997; Ratnam et al., 2006. Finally, to isolate dominant wave num-bers along longitude, a fitting function,
f (x) =
2
X
s=1
Assin s (x − φs) . (1)
is used. The mixing of the wave numbers 1 and 2 components is then applied to best fit the T s at 10-30 km (hereafter called fitted T s). The amplitude As and phase φs for all longitudes
xare solved by means of a nonlinear least-squares method. Figure 2 shows the longitude-time distribution of RO which occurred in between 10◦N and S from May 2001 to
October 2005. In total, 14 936 occulations almost equally distributed in all the longitudes are considered. Although the number of occultations significantly increased after Febru-ary 2002, a greater number of occulations can be no-ticed from July 2003 in the equatorial latitudes. Since CHAMP/GPS is a polar orbiting satellite with an inclina-tion angle of 87◦, there are, on average, only 10–13 occulta-tions per day near the equator. Instead, T s and fitted T s are
20
CHAMP/GPS 2001-2005 10
oN-10
oS
Figure 2. Longitude-time distribution of CHAMP GPS Radio Occultations (RO) observed in
between 10
oN and S during May 2001 to October 2005.
Fig. 2. Longitude-time distribution of CHAMP GPS Radio Occultations (RO) observed in between 10◦N and S during May 2001 to October 2005.
constructed by using 3 adjacent day’s data, vertically shifted to the middle date (3-day running fitting). This method can be effectively used to study the Kelvin waves with periods greater than 10 days and with reduced amplitudes for less than 7-day oscillations (Tsai et al., 2004; Randel and Wu, 2005).
Kelvin wave amplitudes determined with CHAMP/GPS RO measurements are compared by using intensive ra-diosonde (CPEA) campaigns conducted over the Indonesian maritime continent (Tsuda et al., 2006), which reported a considerable decrease for the former, mainly due to the sinu-soidal fitting along the longitude and a smoothing by spher-ical symmetric assumptions. Nevertheless, GPS RO data gives important information on the global variability of the Kelvin waves. Temperature fluctuations also showed a clear eastward phase propagation in the time-longitude section
(Tsai et al., 2004). Here we discuss the generation of Kelvin waves and their interaction wind with the background zonal wind, along with the effects on the tropopause on a long-term basis.
4.1 Long-term variations of Kelvin waves by CHAMP/ GPS RO measurements
Since previous studies with GPS RO data reveal the ma-jor features of Kelvin waves (Tsai et al., 2004; Randel and Wu, 2005; Tsuda et al., 2006), we study the long-term char-acteristics of the Kelvin waves, especially under different background wind conditions. Note that Randel and Wu (2005) already presented the Kelvin wave characteristics dur-ing one complete cycle of QBO. Figure 3 shows the time-longitude sections of the fitted T s contours at 20-km altitude,
M. Venkat Ratnam et al.: Kelvin waves revealed by CHAMP/GPS RO measurements 1359
21
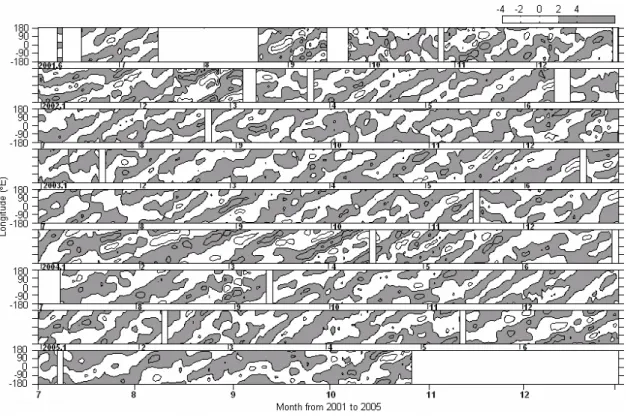
Figure 3. Time-longitude sections of fitted Ts’ contours at 20 km altitude constructed from
wave 1 and wave 2 components between June 2001 and October 2005. The month number
starts from the first of each month and the vertical blank periods indicate the missing data.
The positive and negative perturbations are shown in gray and white color, respectively.
Note that this is the extension figure of Tsai et al. (2004).
Fig. 3. Time-longitude sections of fitted T s contours at 20-km altitude, constructed from wave 1 and wave 2 components between June 2001 and October 2005. The month number starts from the first of each month and the vertical blank periods indicate the missing data. The positive and negative perturbations are shown in gray and white colors, respectively. Note that this is the extension figure of Tsai et al. (2004).
constructed by a 3-day running fitting for wave numbers 1 and 2 between 1 June 2001 and 31 October 2005. (This is an extension figure of Fig. 4 in Tsai et al., 2004 with three addi-tional years of data.) The time series of the waves were gen-erally regular and nearly periodic with eastward phase pro-gression. The wave amplitude is about 2 K, in general, and can reach up to 4 K around January–February 2002 and also during March–April 2004. An eastward phase progression is clearly seen most of the time, but the phase progression is sometimes random and obscured, for example, in October 2001, mid June 2002 and the early months of 2003. Most
T spatterns show mixed waves dominating the entire period; however, few pairs of positive/negative T s patterns along the longitude indicate a dominant wave number 2, for exam-ple, during the mid August–mid September 2001, January– February 2002, mid April-mid May, July 2002, mid January– mid February 2004 and end of April–mid May 2004, Novem-ber 2004, and March 2005.
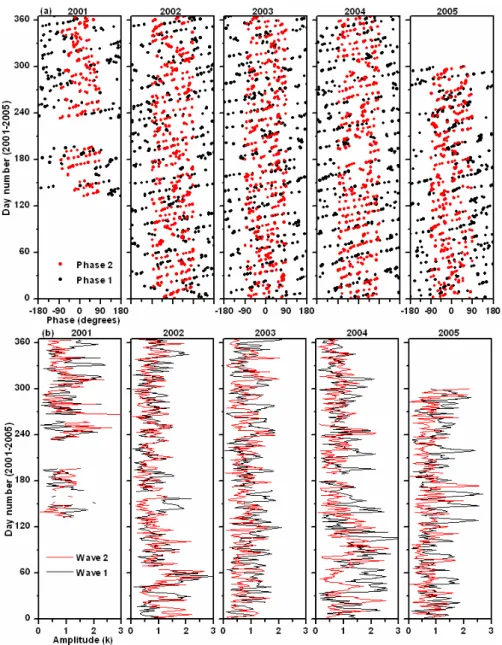
4.2 Amplitude and phases of Kelvin waves at 20 km In order to define the dominant wave number of Kelvin waves, long-term variations of amplitudes and relative phases of both wave numbers 1 and 2 at 20 km are shown in Fig. 4. The phase progression indicates that the dominant wave period is from 10 to 20 days, mostly in between 10 and
15 days. As seen in Fig. 4b, most of the time, wave num-ber 1 is dominant, but wave numnum-ber 2 component coexists. Both the wave numbers 1 and 2 show similar time variations, possibly either due to having the same generation source or a predominance of background wind effects which acts sim-ilarly on both wave numbers.
Enhanced wave amplitudes were seen clearly from November 2001 to February 2002 and also in January–May 2004. Most of these features had already been reported by Tsai et al. (2004) and also by Randel and Wu (2005). An-other striking feature noticed is that wave number 2 is dom-inant, particularly during eastward shear, and throughout the year, 2003 wave number 1 is dominant.
4.3 Generation of Kelvin waves
We further report on the long-term characteristics of Kelvin waves under different background conditions, including con-vective activity and background wind conditions, which can be related to the generation of Kelvin waves and wave mean flow interaction, respectively.
Figure 5a shows the long-term Kelvin wave amplitudes of both wave numbers 1 and 2 at 17-km altitude in 2001– 2005, and Fig. 5b shows the OLR deviations from a yearly mean for both zonal average and also the average in between 60◦E and 180◦E longitude in the 10◦N to 10◦S latitudes.
22 Figure 4. Long-term time series of (a) phases and (b) amplitudes of both wave numbers 1 (black) and 2 (red) observed using CHAMP/GPS observations at 20 km altitude region.
Fig. 4. Long-term time series of (a) phases and (b) amplitudes of both wave numbers 1 (black) and 2 (red) observed using CHAMP/GPS observations at the 20-km altitude region.
Note that the OLR variations averaged over the longitude band mentioned above clearly follow the zonal mean aver-aged OLR variations plotted in the same figure, revealing that most of the convection is observed from Indian Ocean to Pacific. This figure also reveals that the peak amplitudes of Kelvin waves are mostly linked to tropical deep convection (negative OLR values), either with wave numbers 1 and/or 2 which are known as convectively coupled Kelvin waves, although they are not always matching exactly.
The correlation coefficients plotted in Figs. 5c and d in between zonal averaged OLR and the amplitudes of Kelvin waves with wave numbers 1 and 2 shows only 0.29 but have a significant correlation (R = –0.52) with the OLR in between the 60◦E and 180◦E longitude. These results are consistent
with that reported by Randel et al. (2003) and also by Ran-del and Wu (2005), using GPS/MET and also by the limited data of CHAMP/GPS RO. However, this kind of correlation is only observed on a long-term basis and will decline in the individual cases, although a lag of a few days can be noticed sometimes. Wheeler et al. (2000) observed a slight lag be-tween the OLR and the associated perturbations in the upper troposphere. In addition, an improved correlation has been noticed by Randel and Wu (2005) in lagging the temperature perturbations with respect to OLR. They also reported that this correlation will decay when we move to higher heights, where the influence of the background zonal wind will be-come significant. A striking feature to be noticed is the an-nual oscillation in both OLR anomalies and also the Kelvin
23
Figure 5. Long-term time series of (a) Kelvin wave amplitudes of wave number 1 and 2
observed using CHAMP/GPS measurements at 17 km altitude region. (b) Corresponding
outgoing long-wave radiation (OLR) anomalies (from yearly mean) observed in between
10
oN and 10
oS averaged in between 60
oE and 180
oE longitude (red) and 180
oW to 180
oE
(zonal average) longitude (black). For clarity 15-day running mean was applied in the both
the panels. Cross correlation observed between the amplitudes of Kelvin waves with both
the wave numbers (c) Vs. zonal mean OLR anomalies and (d) Vs. 60
oE and 180
oE longitude
band.
Fig. 5. Long-term time series of (a) Kelvin wave amplitudes of wave numbers 1 and 2 observed using CHAMP/GPS measurements at the 17-km altitude region. (b) Corresponding outgoing long-wave radiation (OLR) anomalies (from yearly mean) observed in between 10◦N and 10◦S averaged in between 60◦E and 180◦E longitude (red) and 180◦W to 180◦E (zonal average) longitude (black). For clarity a 15-day running mean was applied in both panels. Cross correlation observed between the amplitudes of Kelvin waves with both the wave numbers (c) vs. zonal mean OLR anomalies and (d) vs. 60◦E and 180◦E longitude band.
24
Figure 6. Examples showing the altitude-longitude sections of fitted Ts’ observed in westward (left panels) and eastward (right panels) phases of QBO during the periods shown with vertical lines in fig. 1(a). Note that ± 1 day observations are considered to the day/ day number (from January 01, 2001) mentioned on the top of each panel.
(c) 08 Feb. 2004 (D1134)
(a) 08 Nov.2001 (D312) (b) 17 Mar.2003 (D837)
(d) 23Jun.2005 (D1635)
T’(K)
Longitude (degrees)
Westward phase Eastward phase
Fig. 6. Examples showing the altitude-longitude sections of fitted T s observed in westward (left panels) and eastward (right panels) phases of QBO during the periods shown with vertical lines in Fig. 1a. Note that ±1-day observations are considered to the day/ day number (from 1 January 2001) mentioned on the top of each panel.
1362 M. Venkat Ratnam et al.: Kelvin waves revealed by CHAMP/GPS RO measurements
25
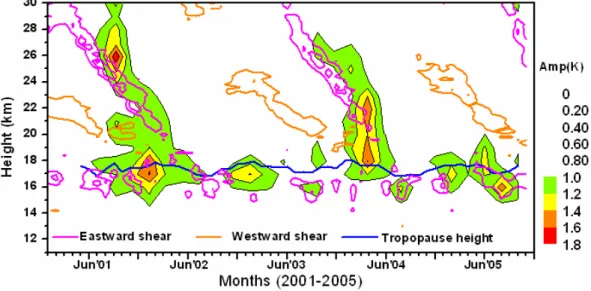
Figure 7. Time –height variations of Kelvin wave amplitudes (colored contours) observed at equatorial latitudes (±10o) using CHAMP/GPS during May 2001 – October 2005 using both wave number 1 and 2 (averaged). Vertical shear in eastward (magenta) and westward (orange) wind observed at Singapore is plotted in line contours. The contours are ± 0.1, 0.2, 0.3,…..m/s/s and the contours with zero magnitude are omitted. Monthly mean tropopause height (blue line) observed in between 0-120oE longitude band is also plotted. Note that this is the extension figure of Randel and Wu (2005).
Fig. 7. Time-height variations of Kelvin wave amplitudes (colored contours) observed at equatorial latitudes (±10◦)using CHAMP/GPS during May 2001–October 2005, using both wave numbers 1 and 2 (averaged). Vertical shear in the eastward (magenta) and westward (orange) wind observed at Singapore is plotted in line contours. The contours are ±0.1, 0.2, 0.3,. . . m/s/s and the contours with zero magnitude are omitted. Monthly mean tropopause height (blue line) observed in between 0–120◦E longitude band is also plotted. Note that this is the extension figure of Randel and Wu (2005).
wave amplitudes, which will be discussed in more detail in Sect. 5.
4.4 Interaction of Kelvin waves with background wind Figure 6 shows examples of the altitude-longitude section of fitted T s for 4 cases (each with adjacent 3 days) during dif-ferent phases of QBO. The amplitudes are significantly en-hanced near the tropopause in all the cases but during the westward phase of QBO (Figs. 6a and c), the enhancement is noticed from 15 km onwards, extending up to 25 km, but confined around the tropopause during the eastward phase of QBO (Figs. 6b and d). In all the cases the phase progression tilts eastward and upward and is nearly regular. The vertical wavelengths are estimated to be ∼7 km and ∼5 km during the westward and eastward phases of QBO, respectively, which are also consistent with that reported by Tsai et al. (2004) and Randel and Wu (2005). Since the large perturbations are located in and around the tropopause, the tropopause struc-ture will be significantly modified by the Kelvin waves which will be discussed in detail in Sect. 5.
A similar analysis was performed throughout the height re-gion (17–30 km) for the entire time series (2001–2005) and is shown in Fig. 7. This figure shows time-height variations of the amplitudes of the wave numbers 1 and 2 (averaged) from May 2001 to October 2005, along with the background monthly mean zonal wind shear (line contours) taken from Singapore radiosonde data. Enhancement of the wave ampli-tudes can be clearly seen in relation to the downward phase propagation of the background westward phase of QBO (or near strong eastward shear zone) at all the heights,
particu-larly from 18 km and above. This strong relation with the background winds is most likely due to thermal damping as proposed by Shiotani and Horinouchi (1993), using a long-term (15 years) rawinsonde data set from Singapore which is been reconfirmed using CHAMP/GPS RO data by Randel and Wu (2005). Kelvin waves don’t exist above the 20-km altitude during all the periods, expect during a strong east-ward shear. The amplitudes of the Kelvin waves are signif-icantly enhanced near the tropopause, which is also plotted in Fig. 7. Predominant annual variation in both Kelvin wave amplitudes and the tropopause can be noticed, with a peak occurring during the Northern Hemisphere winter. The am-plitudes of the Kelvin waves also show the signature of QBO. A few differences can be noticed from the earlier stud-ies with these long-term characteristics. Although a clear enhancement in the amplitudes is noticed in relation to the downward phase propagation of the background westward wind, a maximum enhancement in the amplitudes of Kelvin waves is, however, observed near the strong eastward shear (near 26 km) only in the first cycle of QBO. However,this maximum enhancement in the Kelvin wave amplitudes is ob-served significantly below the zones of the maximum east-ward shear in the second cycle.
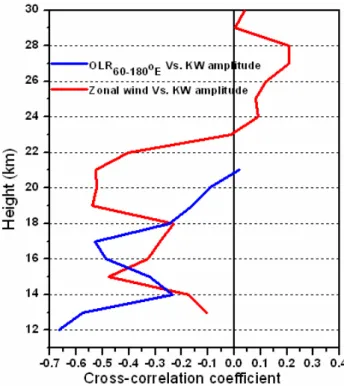
In order to estimate the impact of different background conditions at different altitude regions on the observed Kelvin wave amplitudes, a cross correlation analysis has been performed between the amplitudes, zonal wind and OLR, and is depicted in Fig. 8. A reasonable correlation (R = –0.52) between Kelvin wave amplitudes and OLR (neg-ative correlation) is observed as expected around the tropical
tropopause (around 17 km). The first maximum correlation seems to occur below 12 km. It can be noticed that the back-ground wind plays a significant role on the observed Kelvin wave amplitudes only above the 23-km altitude (positive cor-relation), with a peak around 27–28 km, the region of maxi-mum shear. There is a strong negative correlation especially near the tropopause between the Kelvin wave amplitudes and the zonal wind, giving evidence that the amplitudes are inde-pendent of background wind conditions near the tropopause.
5 Effect on the tropopause
Earlier studies reported that the Kelvin waves significantly affect the thermal structure around the tropopause (Tsuda et al., 1994), such as the dehydration and cirrus formation (Fu-jiwara et al., 1998). Production of enhanced turbulence asso-ciated with Kelvin wave breaking near the tropopause could play an important role in the Stratospheric-Tropospheric (S-T) exchange, causing a downward mixing of the stratospheric ozone into the troposphere (Fujiwara et al., 2003). Although a few studies were done earlier in relating the effects on the tropopause by the Kelvin waves, further research on long-term basis is still needed.
The effect on the tropopause height by these Kelvin waves is studied in much detail, using long-term CHAMP/GPS RO measurements, by separating the tropical region into three major longitudinal bands, each having similar tropopause variations (Ratnam et al., 2005). Figure 9 shows the tem-poral variation of the anomalies (deviation from the four and half years mean) of cold point tropopause height, tempera-ture, and the tropopause sharpness observed from May 2001 to October 2005 near the equator (±5◦ latitudes) at 0– 120◦E, 120–240◦E, and 240–360◦E longitudinal bands. The tropopause sharpness (ST P)is defined as the change in
vertical temperature gradient across the tropopause:
ST P =
TT P +1z−TT P
1Z −
TT P −TT P −1z
1Z (2)
with 1Z=1 km, where TT P is CPT temperature and TT P ±1z
is the temperature at 1 km above (for +) and below (for –) CPT (Wirth, 2000). Since a sharp tropopause in tropics oc-curs mainly when there is an adjustment between the radi-ation (in stratosphere) and the convection (in troposphere), focus on this parameter will give important information on when and where the radiative–convective equilibrium occurs (Highwood and Hoskins, 1998).
It can be noted that these three longitudinal bands show slightly different features, although in general clear annual variations can be noticed in all three parameters at all longi-tudinal bands. The tropopause height and sharpness (temper-ature) becomes maximum (minimum) during the Northern Hemisphere winter (summer) months. However, maximum and minimum tropopause height variations shown in Fig. 9b vary from one longitudinal band to the other, for example,
26
Figure 8. Cross correlation observed in between the amplitudes of Kelvin waves and background wind (red line) and OLR data from 60-180oE longitude band (blue line) observed during May 2001 to October 2005.
Fig. 8. Cross correlation observed in between the amplitudes of the Kelvin waves and the background wind (red line) and OLR data from 60–180◦E longitude band (blue line) observed during May 2001 to October 2005.
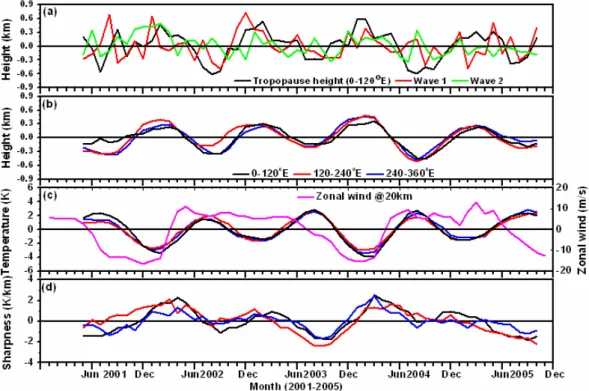
at 120–240◦E the tropopause height is slightly lower and higher during the Northern Hemisphere summer of the year 2002 and 2004, respectively, when compared to other longi-tudinal bands. The anomalies of the Kelvin wave amplitudes at 17 km for the wave numbers 1 and 2 in Fig. 9a also show the annual variation similar to the tropopause height (plotted for 0–120◦E longitude). Note that the month-to-month co-incidence of Kelvin wave activity and tropopause height is matching well most of the time, along with dominant annual variation. The correlation coefficient of the month-to-month comparison between these two parameters gives 0.56.
In addition, a signature of QBO is also evident, although small when compared to annual variations (clearly seen in the smoothed variations shown in Fig. 9b) from the interan-nual variations which can be inferred from the background zonal wind plotted in Fig. 9c. In the westward phase of QBO (during the strong Kelvin wave activity) at 20 km (in 2001– 2002 winter and 2003–2004 winter), the tropopause height is slightly higher, the temperature is lower, and the sharpness is larger. Even though the four and half year analysis pre-sented here cannot represent the actual trend as that prepre-sented using the long-term data set (Highwood and Hoskins 1998; Hoinka 1998; Randel et al., 2000; Seidel et al., 2001), most of the features,like the indirect response to the tropospheric convection, and the effect of QBO, etc., are consistent with earlier studies.
1364 M. Venkat Ratnam et al.: Kelvin waves revealed by CHAMP/GPS RO measurements
27
Figure 9. Temporal variation of anomalies derived from climatological means (four and half years) of (a) cold point tropopause height (black) observed at the equator (±5o) at 0-120oE longitude during May 2001-October 2005. Amplitudes of Kelvin waves for both wave number 1 (red) and 2 (green), observed at 17 km altitude is also plotted. (b) Tropopause height observed at the equator (±5o) at 0-120oE, 120-240oE, and 240oE -360o longitude bands. Note that 5 month smoothing was applied for this panel to show the inter-annual variations. Corresponding temporal variation of anomalies observed in (c) temperature, and (d) tropopause sharpness (see text). Monthly mean zonal velocity (magenta) observed at 20 km taken from Singapore radiosonde is plotted in (c) and the amplitudes are shown on the right side. Mean tropopause height, temperature and sharpness is found to be 17km, 191K, and 10K/km, respectively.
Fig. 9. Temporal variation of anomalies derived from climatological means (four and half years) of (a) the cold point tropopause height (black) observed at the equator (±5◦)at 0–120◦E longitude during May 2001–October 2005. Amplitudes of Kelvin waves for both wave numbers 1 (red) and 2 (green), observed at 17-km altitude is also plotted. (b) Tropopause height observed at the equator (±5◦)at 0–120◦E, 120–240◦E, and 240◦E –360◦longitude bands. Note that a 5-month smoothing was applied for this panel to show the interannual variations. Corresponding temporal variation of anomalies observed in (c) temperature, and (d) tropopause sharpness (see text). Monthly mean zonal velocity (magenta) observed at 20 km, taken from Singapore radiosonde, is plotted in (c) and the amplitudes are shown on the right side. Mean tropopause height, temperature and sharpness are found to be 17 km, 191 K, and 10 K/km, respectively.
The inference is that the tropopause structure is affected by the convection which has an annual cycle, thereby showing an annual oscillation. It also has a monthly variation which arises mainly due to the modulation by the Kelvin wave ac-tivity with a sharp tropopause at the equator. Since both are from the same source, if vertical propagation exists in the in-dividual cases of Kelvin waves, all the phases should cancel out each other when averaging long-term, leaving no residual variations. However, the annual oscillation is still seen in the Kelvin wave amplitudes, near the tropopause, perhaps due to the additional source from the quasi-stationary waves that are frequently observed over the Indian Ocean to the mar-itime continent, as suggested by Randel and Wu (2005).
The influence of QBO on the tropopause structure can be inferred through the wind shear where a descending eastward shear is responsible for warm perturbations which will warm up and lower the tropopause (Figs. 9b and c during the North-ern Hemisphere winter of 2002). AltNorth-ernatively, descending westward shear will raise and cool the tropopause, as shown in Figs. 9b and c during the Northern Hemisphere winter of 2001 and the early months of 2004.
6 Summary and discussion
A detailed study on the vertical and temporal character-istics of equatorial Kelvin waves and their effects on the tropical tropopause has been presented using long-term CHAMP/GPS RO measurements under different background conditions in relation to convective activity (source region) and also under different background wind conditions. Tem-perature fluctuations clearly showed eastward phase propa-gation in the time-longitude section (Fig. 3). By using OLR data the major centers of convective activity associated with MJO were found to be most prominent over the warm pool regions of the eastern hemisphere, starting from the cen-tral Indian and western Pacific Oceans (between 60◦E and
180◦) (Rui and Wang, 1990), picking up especially over
the Maritime continent and to the east (Fig. 1b). The east-ward moment of these convective centers is clear during the Northern Hemisphere winter when the warm pool extends from the Indian Ocean to the date line, consistent with that reported by Lau and Shen, (1988). These convective cen-ters will create perturbations which will move in all direc-tions, depending upon the background wind especially to the east (Kelvin waves), sometimes clearly correlating with
the convective centers (Fig. 5d) known as “convective cou-pled” Kelvin waves, and this effect is seen up to the tropical tropopause (around 17 km, from Fig. 8).
Since Kelvin wave amplitudes are seen at maximum near the tropopause, hence they sometimes modify the tropopause structure significantly with the coldest tropopause. The Kelvin waves, which are known as “Free mode” Kelvin waves, move up vertically, even above the tropopause and their vertical propagation depends on background wind con-ditions mainly above the 23-km altitude (Fig. 8). The dissi-pation of Kelvin waves will depend on the vertical compo-nent of group velocity which decreases with the increase of the height. Therefore, eastward propagating Kelvin waves will generally dissipate in the eastward shear zones (Fig. 7). Hence, when the background wind is eastward, the Kelvin waves are observed in and around tropopause with less ver-tical wavelengths (Figs. 6b and d), whereas they extend to higher heights during the westward phase of QBO with large vertical wavelengths (Figs. 6a and c). The amplitudes of Kelvin waves are significantly enhanced only during strong eastward shear in the zonal wind (Fig. 7), which is consistent with the earlier reported literature (Shiotani and Horinouchi, 1993; Randel and Wu, 2005). However, this enhancement is not always seen especially during the second cycle pre-sented here but noticed significantly at lower heights, which is inconsistent with earlier studies. Since the relation of OLR with the amplitudes of Kelvin waves is seen at 17 km, whereas with the background wind starts from 23 km on-wards, it is difficult to say which parameter will play a role for the observed enhanced amplitudes in between 17 and 23 km, which demands further research.
The modification of the tropopause structure is also no-ticed during strong Kelvin wave activity. A month-to-month coincidence is seen most of the time between Kelvin wave amplitudes and the tropical tropopause. From long-term measurements of CHAMP/GPS, a clear annual variation in tropopause height, temperature and sharpness is seen in re-lation to the Kelvin wave amplitudes. Vertically propagating Kelvin waves in individual cases should cancel out each other in the long-term averaging, leaving no residuals but still the annual oscillation is clearly seen. This could be perhaps due to an additional source by quasi-stationary waves, which are frequently observed over the Indian Ocean to the maritime continent (Randel and Wu, 2005). In addition, a signature of stratospheric QBO is also seen in the tropopause height, al-though the amplitude of variation is small when compared to the annual oscillation, possibly due to wind shear aris-ing from the different phases of QBO. Duraris-ing the west-ward phase of QBO, cold anomalies will raise the tropopause height by lowering the temperature with a sharp tropopause. The tropopause height will be decreased with higher tem-peratures and relatively less sharpness by warm anomalies during the eastward phase of QBO.
Acknowledgements. We thank H.-F. Tsai, T. Horinouchi, T.
Naka-mura, Y. Shibagaki for their fruitful discussions and comments on the manuscript. We also wish to thank GFZ (GeoForschungsZen-trum), Potsdam for providing CHAMP/GPS RO data through the ISDC (INTEGRAL Science Data Centre ISDC) data center. One of the authors (MVR) wishes to thank JSPS (Japan Society for Promo-tion of Sciences) for providing fellowship to carry out this work. This work is also supported partially by MEXT (Japanese Min-istry of Education, Culture, Sports, Science and Technology) using Grant-in-Aid for Scientific Research on Priority Areas (Grant num-ber: (A03) 13136206; (A04) 13136203).
Topical Editor U.-P. Hoppe thanks two referees for their help in evaluating this paper.
References
Andrews, D. G., Holton, J. R., and Leovy, C. B.: Middle Atmo-spheric Dynamics, Academic Press, San Diego, California, 1987. Canziani, P. O., Holton, J. R., Fishbein, E. F., and Froidevaux, L.: Equatorial Kelvin wave variability during 1992 and 1993, J. Geo-phys. Res., 100, 5193-5202, 1995.
Fujiwara, M., Kita, K., and Ogawa, T.: Stratosphere-troposphere exchange of ozone associated with the equatorial Kelvin waves as observed with ozonesondes and rawinsondes, J. Geophys. Res., 103, 19 173–19 182, 1998.
Fujiwara M., Xie, S.-P., Shiotani, M., Hashizume, H., Hasebe, F., V¨omel, H., Oltmans, S. J., and Watanabe, T.: Upper tropospheric inversion and easterly jet in the tropics, J. Geophys. Res., 108, 4796, doi:10.1029/2003JD003928, 2003.
Highwood, E. J., and Hoskins, B. J.: The tropical tropopause, Quart. J. Roy. Meteorol. Soc., 124, 1579–1604, 1998.
Hitchman, M. H. and Leovy, C. B.: Estimation of the Kelvin wave contribution to the semiannual oscillation, J. Atmos. Sci., 45, 1462–1475, 1988.
Hoinka, K. P.: Statistics of the global tropopause pressure, Mon. Weather Rev., 126, 3303–3325, 1998.
Holton, J. R., Joan Alexander, M., and Boehm, M. T.: Evi-dence for short vertical wavelength Kelvin waves in the Depart-ment of Energy-Atmospheric Radiation MeasureDepart-ment Nauru99 radiosonde data, J. Geophys. Res., 106(D17), 20 125–20 130, 2001.
Lau, K. M. and Shen, S.: On the dynamics of intra-seasonal oscil-lations and ENSO, J. Atmos. Sci.,45, 1781–1797, 1988. Matsuno, T.: Quasi-geostrophic motion in the equatorial area, J.
Meteo. Soc. Japan, 44, 25–42, 1966.
Mote, P. W., Dunkerton, T. J., and Wu, D.: Kelvin waves in strato-spheric temperature observed by the Microwave Limb Sounder, J. Geophys. Res., 107(D14), ACL 10–1, 2002.
Randel, W. J., Wu, F., and Gaffen, D. J.: Inter-annual variability of the tropical tropopause derived from radiosonde data and NCEP reanalysis, J. Geophys. Res., 105, 15 509–15 523, 2000. Randel, W. J., Wu, F., and Rivera R´ıos, W.: Thermal
variability of the tropical tropopause region derived from GPS/MET observations, J. Geophys. Res., 108(D1), 4024, doi:10.1029/2002JD002595, 2003.
Randel, W. J. and Wu, F.: Kelvin wave variability near the equato-rial tropopause observed in GPS radio occulation measurements, J. Geophys. Res., 110, doi:10.1029/2004JD005006, 2005.
Ratnam, M. V., Tsuda, T., Kozu, T., and Mori, S.: Gravity wave characteristics over equator observed during CPEA campaign us-ing simultaneous multiple stations data, J. Meteorol. Soc. Japan, in press, 2006.
Ratnam, M. V., Tsuda, T., Shiotani, M., and Fujiwara, M.: New Characteristics of the Tropical Tropopause Revealed by CHAMP/GPS Measurements, Scientific Online Letters on At-mosphere , 1, 185–188, doi: 10.2151/sola. 2005–048, 2005. Reigber, C., L¨uhr, H., and Schwintzer, P.: CHAMP mission
sta-tus and perspectives, Suppl. to EOS, Transactions, AGU, 81, 48, F307, 2000.
Rui, H. and Wang, B.: Development characteristics and dynamic structure of tropical intra-seasonal convection anomalies, J. At-mos. Sci., 47, 357–379, 1990.
Salby, M. L., Hartmann, D. L., Bailey, P. L., and Gille, J. C.: Evi-dence for equatorial Kelvin modes in Nimbus-7 LIMS, J. Atmos. Sci., 41, 220–235, 1984.
Sato, K., Hasegawa, F., and Hirota, T.: Short-period disturbances in the equatorial lower stratosphere, J. Meteorol. Soc. Japan., 72, 859–872, 1994.
Schmidt, T., Wickert, J., Beyerle, G., and Reigber, C.: Tropi-cal tropopause parameters derived from GPS radio occultation measurements with CHAMP, J. Geophys. Res., 109(D1), 3105, doi:10.1029/2004JD004566, 2004.
Seidel, J. D., Ross, R. J., Angell, J. K., and Reid, G. C.: Climato-logical characteristics of the tropical tropopause as revealed by radiosondes, J. Geophy. Res., 106, 7857–7878, 2001.
Shimizu, A. and Tsuda, T.: Characteristics of Kelvin waves and gravity waves observed with radiosondes over Indonesia, J. Geo-phys. Res., 102, 26, 159–26,171, doi:10.1029/96JD03146, 1997. Shiotani, M. and Horinouchi, T.: Kelvin wave activity and the quasi-biennial oscillation in the equatorial lower stratosphere, J. Meteorol. Soc. Japan., 71, 175–182, 1993.
Shiotani, M., Gille, J. C., and Roche, A. E.: Kelvin waves in the equatorial lower stratosphere as revealed by cryogenic limb ar-ray etalon spectrometer temperature data, J. Geophys. Res., 102, 26 131–26 140, 1997.
Srikanth, R. and Ortland, D. A.: Analysis of Kelvin waves in High-Resolution Doppler Imager and Microwave Limb Sounder strato-sphere measurements using a constrained least square method, J. Geophys. Res., 103, 23 131–23 151, 1998.
Takayabu, Y. N.: Large-scale cloud disturbances associated with equatorial waves. Part I: Spectral features of the cloud distur-bances, J. Meteorol. Soc. Jpn., 72, 433–449, 1994.
Tsai, H.-F., Tsuda, T., Hajj, G., Wickert, J., and Aoyama, Y.: Equa-torial Kelvin waves observed with GPS occultation measure-ments (CHAMP and SAC-C), J. Meteorol. Soc. Japan., 82, 397– 406, 2004.
Tsuda, T., Murayama, Y., Wiryosumarto, H., Harijono, S. W. B., and Kato, S.: Radiosonde observations of equatorial atmospheric dynamics over Indonesia, 1, Equatorial waves and diurnal tides, J. Geophys. Res., 99, 10 491–10 505, 1994.
Tsuda, T., Nishida, M., Rocken, C., and Ware, R. H.: A global morphology of gravity wave activity in the stratosphere revealed by the GPS occultation data (GPS/MET), J. Geophys. Res., 105(D6), 7257–7273, 2000.
Tsuda, T., Venkat Ratnam, M., Kozu, T., and Mori, S.: Behavior of the Kelvin waves during intensive radiosonde campaigns and comparison with CHAMP/GPS measurements, J. Meteorol. Soc. Japan, in press, 2006.
Wallace, J. M. and Kousky, V. E.: Observational evidence of Kelvin waves in the tropical stratosphere, J. Atmos. Sci., 25, 900–907, 1968.
Wheeler, M., Kiladis, G. N., Webster, P. J.: Large-scale dynamical fields associated with convectively couples equatorial waves, J. Atmos. Sci., 57, 613–639, 2000.
Wickert, J., Reigber, C., Beyerle, G., Konig, R., Marquardt, C., Schmidt, T., Grunwaldt, L., Galas, R., Meehan, T. K., Mel-bourne, W. G., and Hocke, K.: Atmosphere sounding by GPS ra-dio occultation: First results from CHAMP, Geophys. Res. Lett., 28(17), 3263–3266, 2001.
Wickert, J., Beyerle, G., Koenig, R., Heise, S., Grunwaldt, L., Michalak, G., Reigber, C., and Schmidt, T.: GPS radio occulta-tion with CHAMP and GRACE: A first look at a new and promis-ing satellite configuration for global atmospheric soundpromis-ing, Ann. Geophys., 23, 653–658, 2005.
Wirth, V.: Thermal versus dynamical tropopause in upper tropo-spheric balanced flow anomalies, Quart. J. Roy. Meteor. Soc., 126, 299–317, 2000.