ALTERNATIVE PUBLIC SUPPLY WELL LOCATION ANALYSIS
(ZONE II STUDY) IN CAPE COD, MA
by
JUAN CARLOS PEREZ
B.S. Environmental Engineering Massachusetts Institute of Technology, 1996
Submitted to the Department of Civil and Environmental Engineering In Partial Fulfillment of the Requirements for the Degree of
MASTER OF ENGINEERING
IN CIVIL AND ENVIRONMENTAL ENGINEERING at the
MASSACHUSETTS INSTITUTE OF TECHNOLOGY June 1997
@ 1997 Juan Carlos Perez
All rights reserved
The author hereby grants to M.I.T. permission to reproduce and distribute publicly paper and electronic copies of this thesis document in whole or in part.
I,
\-Signature of the Author
lqpartment of Civil ana Environmental Engineering
(r)
44/,j/
ay 9, 1997 Certified by Professor of C Accepted by Chairman, Departn SVx /F Fnando Miralles-Wilhelmiivil and Environmental Engineering
,e
)
Thesis SupervisorProfessor Joseph Sussman nent Committee on Graduate Studies
Eng.
JUN 2
4
1997
ALTERNATIVE PUBLIC SUPPLY WELL LOCATION ANALYSIS
(ZONE II STUDY) IN CAPE COD, MA
by
Juan Carlos Perez
Submitted to the Department of Civil and Environmental Engineering on May 9, 1997, in Partial Fulfillment of the Requirements for the Degree of Master of Engineering in Civil and
Environmental Engineering
ABSTRACT
Public water supply is a critical issue in Cape Cod, Massachusetts. Extreme dependency on groundwater, increased levels of land development, and contamination of the aquifer by several pollutant plumes emanating from the Massachusetts Military Reservation (MMR) make the process of locating new public water supply wells in the area one of extreme importance. At this moment, several potential sites are being considered by the Massachusetts Department of Environmental Protection (DEP) and the Long Range Water Supply Process Action Team. These sites are located in the northern part of the Cape, near an environmentally sensitive area of the MMR known as the Live Fire Impact Area (LFIA). For this thesis, two of those sites will be analyzed in depth.
The main objective of this thesis was the use of a calibrated three-dimensional, finite element computer model to perform an analysis known in the Commonwealth of Massachusetts as a Zone
II Study. This test is an integral part of the approval process for new public water supply wells.
The purpose of the study is to determine the area of the regional aquifer that contributes to a well under severe pumping and recharge conditions. The secondary objective of this project was the inspection of the resulting zones of influence and their paths through the LFIA and the possible risks of pumping contaminated water from that area of the MMR.
In order to develop this analysis, each well was simulated for a period of 180 days with no recharge to the system. Furthermore, pumping rates of 600 and 1200 gpm were simulated in each case. All aquifer characteristics were interpolated from a developed regional flow model based on the same modeling program.
This study found that the use of this computer model proved to be an excellent tool in the development of this type of analysis in terms of the effectiveness and accuracy of the results. It was also found that both wells' zones of influence crossed the LFIA to various extents, and that the level of intrusion was dependent on factors such as pumping rate, amount of recharge,
location of the well with respect to the aquifer mound, and proximity to the LFIA itself.
Thesis Supervisor: Fernando Miralles-Wilhelm
ACKNOWLEDGEMENTS
I would like to express my most sincere gratitude towards Professor Dave H. Marks and Shawn Morrissey for the work and effort they put in making this program a complete success. I am deeply in debt to these two gentlemen; if it were not for their belief in me both as a student and as a person, I would definitely not be here today. Along the same lines, I would also like to thank Charlie Helliwell and Peter Shanahan for generously sharing their time and knowledge with us all.
I would like to thank my thesis advisor, Professor Fernando Miralles-Wilhelm, for his support and advice throughout this semester-long battle. I would certainly not have been able to complete this thesis without his patience, understanding and most of all, flexibility towards my slow-coming drafts. Gracias.
Very special thanks to my two unofficial advisors, Bruce Jacobs and Enrique L6pez-Calva, gurus of the DynSystem. They were always there when I needed help with the model or with any of the thousand other things I had trouble with this semester.
I would like to thank the entire M.Eng. crowd, especially Paul Cabral, Dave Lockwood, Darwin Salipsip, Roberto Le6n, Tina Lin, Mia Lindsey, and the rest of the late night crew. The members of the Water Resources team must also be acknowledged: Dave Cook, Jill Manning, Susanna Galloni, Al Tarrel, and Ken Motolenich-Salas.
And last but certainly not least, I would like to thank my mom and dad for all their sacrifices, endless support, and for being both my greatest role models and best friends. My brother Jose Eduardo, Cynthia, my best friends Eugene, Soto, and Annabelle, and my roommates Carlos, Enrique, Jose Oscar, and Victor; thank you all for putting up with me throughout this chapter of my life. "QVPRL"
A B ST R A C T .... ... ... ... 2
ACKNOWLEDGEMENTS... 3
LIST OF FIGURES... 6
LIST O F TA BLES...6
1. INTRO D U CTIO N ... ... ... ... 1.1 PROBLEM STATEM ENT ... 7
1.2 SCOPE...9
1.3 REGULATORY AND SITE BACKGROUND... ... 10
2. ZONE II DELINEATION AND PROTECTION ANALYSIS ... 13
2 .1 Z O N E II D EFIN ITIO N ... 13 2.2 INFORMATION REQUIREMENTS ... 15 2.3 PROCEDURE ... ... ... ... 15 3. MODEL DOCUMENTATION ... 17 3 .1 P U RP O SE... ... ... 17 3.2 CONCEPTUAL M ODEL ... 17 3.3 DATA COLLECTION ... ... 19 3.3.1 Data Sources ... 19 3.3.2 Pump Tests... 20
4. M ODEL DEVELOPM ENT ... ... 22
4.1 DESCRIPTION OF CODE ... 22 4.2 STUDY A REA ... ... 23 4.2.1 Location... ... ... ... 23 4.2.2 Geology... 25 4.2.3 H ydrology... ... 27 4.2.4 Hydrogeology ... 29 4.3 MODEL PARAMETERS... ... 29
4.3.1 Bedrock/Groundwater Surface Elevation...29
4.3.2 Boundary Conditions ... 30
4.3.3 Material Assignments and Properties...34
4.3.4 Pumping/Recharge Conditions...39
5. M ODEL CALIBRATION ... ... 40
5.1 C ALIBRA TION PHILO SOPHY ... 40
5.2 PU M PIN G R A TES ... 4 1 5.3 CALIBRATION OF MATERIAL ASSIGNMENTS AND PROPERTIES ... ... 42
6. DISCUSSION OF RESULTS ... ... 46
6.1 RESULTING ZONE OF INFLUENCE FOR SIMULATION #1 ... 49
6.2 RESULTING ZONE OF INFLUENCE FOR SIMULATION #2... ... 52
6.3 RESULTING ZONE OF INFLUENCE FOR SIMULATION #3...55
6.4 RESULTING ZONE OF INFLUENCE FOR SIMULATION #4... ... 58
6.5 RESULTING ZONES OF INFLUENCE FOR SIMULATION #5 ... 61
6.6 RESULTING ZONES OF INFLUENCE FOR SIMULATION #6... ... 64
6.7 RESULTING ZONES OF INFLUENCE FOR SIMULATION #7... ... 67
6.8 RESULTING ZONES OF INFLUENCE FOR SIMULATION #8... ... 70
7. CONCLUSIONS AND RECOMMENDATIONS ... ... 71
8. BIBLIO G RA PH Y ... ... 74
9. A PPEN D IC ES...76
9.1 APPENDIX 1- INFORMATION REGARDING OBSERVATION WELLS ... ...77
9.2 APPENDIX 2- DESCRIPTION OF GROUNDWATER CODE ... 81
LIST OF FIGURES
FIGURE 1 LOCATION OF THE LIVE FIRE IMPACT AREA WITHIN THE MMR SITE ... 8
FIGURE 2 PLAN VIEW OF THE STUDY AREA... ... ... 11
FIGURE 3 PLAN VIEW OF WEST CAPE FLOW CELL ... ... 18
FIGURE 4 TEST WELL LOCATION MAP ... ... 21
FIGURE 5 PLAN VIEW OF SITE 1 ... 24
FIGURE 6 PLAN VIEW OF SITE 2 ... 25
FIGURE 7 PLAN VIEW OF SANDWICH AND BUZZARDS BAY MORAINE ... 26
FIGURE 8 WATER TABLE CONTOURS OF THE WEST CAPE FLOW CELL ... 28
FIGURE 9 CROSS-SECTION VIEW OF SITE 1 ... 30
FIGURE 10 CROSS-SECTION VIEW OF SITE 2 ... 30
FIGURE 11 PLAN VIEW OF 3-D NUMERICAL GRID ... 32
FIGURE 12 CLOSER VIEW OF NUMERICAL GRID ... ... ... 33
FIGURE 13 BOUNDARY CONDITIONS OF NUMERICAL GRID...34
FIGURE 14 CROSS-SECTIONAL VIEW OF SITE 1 WITH MATERIALS... 35
FIGURE 15 CROSS-SECTIONAL VIEW OF SITE 2 WITH MATERIALS...35
FIGURE 16 VIEW OF MATERIALS IN LAYER... 36
FIGURE 17 VIEW OF MATERIALS IN LAYER 2...36
FIGURE 18 VIEW OF MATERIALS IN LAYER 3...37
FIGURE 19 VIEW OF MATERIALS IN LAYER 4...37
FIGURE 20 VIEW OF MATERIALS IN LAYER 5...38
FIGURE 21 VIEW OF MATERIALS IN LAYER 6...38
FIGURE 22 VIEW OF MATERIALS IN LAYER 7... ... 39
FIGURE 23 INITIAL RESULTS OF CALIBRATION... ... 45
FIGURE 24 FINAL RESULTS OF CALIBRATION...45
FIGURE 25 CAPTURE ZONE FOR SITE #1 AT 1200GPM UNDER ZERO RECHARGE ... 49
FIGURE 26 CAPTURE ZONE FOR SITE #2 AT 1200 GPM UNDER ZERO RECHARGE ... 52
FIGURE 27 CAPTURE ZONE FOR SITE # I1 AT 600 GPM UNDER ZERO RECHARGE ... 55
FIGURE 28 CAPTURE ZONE FOR SITE #2 AT 600 GPM UNDER ZERO RECHARGE ... 58
FIGURE 29 CAPTURE ZONES FOR SITES 1 AND 2 AT 1200 GPM UNDER ZERO RECHARGE... 61
FIGURE 30 CAPTURE ZONES FOR SITES 1 AND 2 AT 600 GPM UNDER ZERO RECHARGE...64
FIGURE 31 CAPTURE ZONES FOR SITES 1 AND 2 AT 1200 GPM UNDER NORMAL RECHARGE...67
FIGURE 32 CAPTURE ZONES FOR SITES 1 AND 2 AT 600 GPM UNDER NORMAL RECHARGE...70
TABLE 1 OBSERVED FIELD DATA FROM PUMPING TEST ... 41
TABLE 2 INITIAL AND FINAL VALUES OF MODELED AQUIFER PARAMETERS... ... 44
1.
INTRODUCTION
1.1 Problem Statement
Public water resources is a critical issue in Cape Cod, Massachusetts. Approximately 96 percent of available water on Cape Cod comes from groundwater (WR report). This area has experienced a steady rise in the amount of land development throughout the years due to an increase in tourism and several other factors. Furthermore, the aquifer in this region is contaminated by various pollutant plumes emanating from the Massachusetts Military Reservation (MMR) at various locations. For these reasons, the process of locating new public water supply wells is an extremely important one in terms of both the quantity and quality of the water which will ultimately be supplied to the area's residents. At this moment, the Massachusetts Department of Environmental Protection (DEP), together with the Long Range Water Supply Process Action Team (LRWS-PAT) is evaluating ten possible sites located in the northwestern part of the Cape, near the towns of Bourne and
Sandwich.
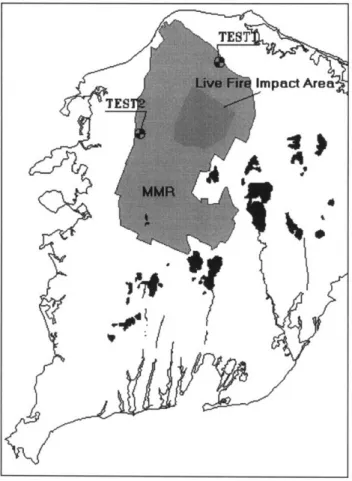
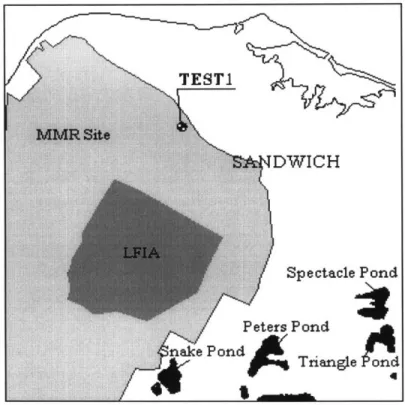
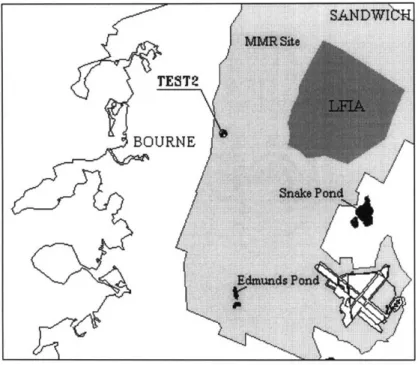
One specific location within the MMR, the Live Fire Impact Area (LFIA), is situated in the vicinity of the proposed well sites (Figure 1). Of the 22,000 acres occupied by the MMR, approximately seventy percent, or 14,000 acres, area occupied by the LFIA. This area has been and is currently used as a place for various forms of target practice. Various types of small arms, as well as grenades and mortars are fired regularly in this part of the MMR. Furthermore, tanks and other vehicles hold practice exercises at the site. At this moment, no specific sources of contamination have been identified and the area is
believed to be free of contamination. However, the effects and final fate of exploded munitions on the groundwater is not completely understood. Additionally, citizens of the surrounding communities are concerned about the possibility of contaminants such as heavy metals, explosives, and explosives by-products leaching into the groundwater of the aquifer and contributing more pollution problems (Cook, 1997).
Figure 1 Location of the Live Fire Impact Area within the MMR site
The purpose of the model described in this thesis is to analyze two of those ten locations, Sites 1 and 2, in order to determine the area of the regional aquifer that contributes to their zones of influence under various conditions. This analysis is known as a Zone II
study in the Commonwealth of Massachusetts. A more detailed description of this analysis is given in the following sections.
1.2 Scope
This project's main objective will be the use of a calibrated groundwater flow model as a tool in the development of a Zone II study for both proposed water supply wells. The secondary objective of this thesis will be to inspect the particular shapes and extents of the resulting capture zones and their paths through the Live Fire Impact Area and the possible risks of pumping contaminated water from that area of the MMR site.
This study covers all the technical aspects regarding the delineation of a Wellhead Protection Area, also known as a Zone II study, for two proposed public water supply wells in northern Cape Cod. First of all, the process by which new groundwater sources are found, developed and implemented in the Commonwealth of Massachusetts is described. Both the particular analysis of interest in this project (Zone II study) and the larger process to which it belongs to (Source Approval Process) are covered in this section. After this is done, the model documentation process is covered. In this section, the conceptual model is presented, the various data sources used for the creation of the model are mentioned, and the data resulting from the pumping tests performed by Stone & Webster is shown. Following that, a detailed description of the development of the flow model is given. First, a summary of the model code used in the project is presented. Next, the study area is described in detail; emphasis is given to the area in close
proximity to the two proposed well sites in terms of geographic location, geological and hydrological characteristics and other features of the area. Finally, the model parameters are covered in this section; bedrock/groundwater surface elevations, boundary conditions, material assignments and properties, and pumping and recharge conditions are all discussed here. The next section consists of the calibration process and its various steps, such as the input of the necessary field data into the model, the simulation of various pumping rate conditions and the ultimate calibration of the material assignments and properties. The final two sections of this project deal with the analysis and discussion of the simulation results and the conclusions and recommendations derived from them.
1.3 Regulatory and Site Background
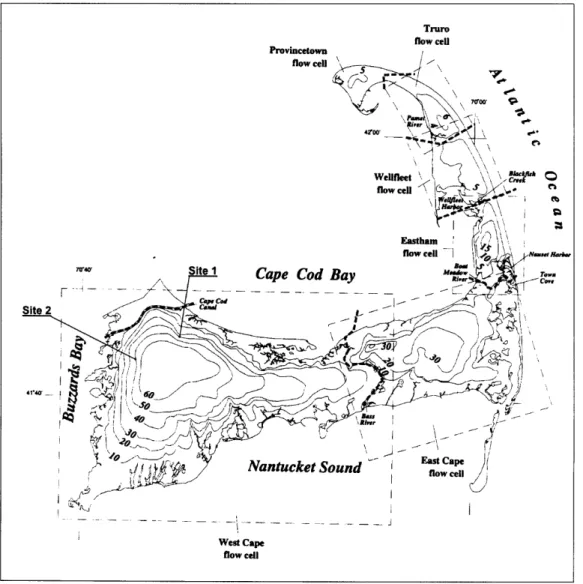
As mentioned earlier, the Massachusetts DEP, together with the LRWS-PAT, are considering ten possible sites to construct new public water supply wells. They are located in the northern part of the Cape, in the towns of Bourne and Sandwich (Figure 4). The purpose of the model described in this project is to investigate two of those sites, Sites 1 and 2, in order to determine the area of the regional aquifer that contributes to these two wells under severe pumping and recharge conditions. These two wells were chosen out of the ten sites because all pumping tests and preliminary Zone II results have already been completed for them, which provided me with the necessary field data to complete the model calibration and furthermore, served as a comparison for my resulting zones of influence. A plan view of the study area can be seen in Figure 2.
Figure 2 Plan view of the study area This Appr< resou analy Regu Mass, explo systel
The following (DEP, 1996): Step 1: Step 2: Step 3: Step 4: Step 5: Step 6: Step 7." Step 8: Step 9: Step 10: Step 11: Step 12: Step 13: Step 14: Step 15:
)utlines the major components of the SAP for all public supply wells
Explore Potential Sources of Groundwater
Request Site Exam
Conduct Site Exam
Assess Viability (for new small systems only)
Submit Pumping Test Proposal
Pumping Test Proposal Approved
Conduct Pumping Test
Shut Down Pumping Test
Submit Source Final Report to DEP Regional Office
Source Final Report Approved
Submit Design Plan for Permanent Works to the DEP Regional Office
Permanent Works Installation Approved
Notify DEP Regional Office When System is Complete
Site Inspection ofPermanent Works
2. ZONE
II
DELINEATION AND PROTECTION ANALYSIS
2.1 Zone II Definition
As discussed earlier, the Zone II Study, also known as Wellhead Protection Area Analysis, forms part of the SAP. Within the Source Approval Process, the Zone II analysis is performed after the pumping test proposal is approved by the DEP, and its results are submitted to them in the Source Final Report for further consideration.
The term "Wellhead Protection Area" refers to the surface and subsurface area surrounding a water well or wellfield supplying a public water system, through which contaminants are likely to move toward and reach such water well or wellfield (SDWA, 1986). As described by the DEP guidelines: "Zone II means that area of an aquifer which
contributes water to a well under the most severe pumping and recharge conditions that
can be realistically anticipated (180 days of pumping at the approved yield, with no recharge from precipitation)". It is bounded by the groundwater divides which result
from pumping the well, and by the contact of the aquifer with less permeable materials such as till or bedrock. In some cases, streams or lakes may act as a recharge boundaries. In all cases, Zone II shall extend upgradient to its point of intersection with prevailing hydrogeologic boundaries (DEP, 1996)
Prior to the Zone II study, a Zone I analysis is performed. The purpose of the Zone I study is to determine the protective radius around a public water system well or wellfield. The purpose of this protective radius is to insure that land development and other uses
within this area will not have a detrimental effect on the proposed public water supply well. It also serves the purpose of identifying possible sources of contamination in that area. For public water systems with approved yields of 100,000 gallons per day (gpd), the protective radius is 400 feet. For all other public water systems, the protective radius is determined by the following equation(DEP, 1996):
Zone I radius(ft) = (150 x log of pumping rate in gpd) - 350
As described in the DEP 1996 Guidelines: "The site should not be located within Y mile
ofpotentially serious sources ofpollution such as active or abandoned sanitary landfills,
major fuel storage and/or transmissions facilities, road salt stockpile areas, hazardous
substances storage areas, etc."
Zone III is defined as that land area beyond the area of Zone II from which surface water and groundwater drain into Zone II. The surface water drainage divides as determined by topography will be used to delineate Zone III. In some locations, where surface and groundwater are not coincident, Zone III shall consist of both the surface drainage and the groundwater drainage areas (DEP, 1996).
The major components of the Source Final Report are:
1. All data from and analyses of the prolonged pumping test.
3. Groundwater monitoring well program.
4. Final draft or Wellhead protection zoning and non-zoning controls.
2.2 Information Requirements
Zone IIs and Zone IIIs shall be delineated for all public water supply wells with planned yields 100,000 gallons per day (gpd) and greater unless the water supplier can demonstrate at the time of submittal of the SFP that a groundwater monitoring well program and an aquifer protection bylaw or ordinance have been implemented that provide suitable water quality protection for the entire Zone III or watershed area (DEP, 1996).
2.3 Procedure
The Guidelines and Policies for Public Water Systems, from the Massachusetts DEP outline the procedure for the delineation of a well's zone of contribution or capture zone. DEP specifies that a 180 day transient simulation be performed with pumping at safe yield and no recharge. The zone of contribution is then to be delineated using a flow net approach on the resulting piezometric heads.
The specific steps are:
1. Construct aprepumping water-table contour map.
3. Determine Zone II water-table contours by subtracting drawdowns from the
prepumping water-table configuration.
4. Construct aflow net using the Zone II water-table contours.
5. Identify the ground-water divide using the flow net.
6. Extend the divide upgradient to its point of intersection with prevailing
3. MODEL DOCUMENTATION
The following description of the Zone II modeling analysis performed for two of the ten proposed public well sites in the towns of Bourne and Sandwich follows the procedural guidelines provided by the Division of Water Supply in the Guidelines and Policies for Public Water Systems (DEP, 1996).
3.1 Purpose
The purpose of the model described in this project is to determine the area of the regional aquifer that contributes to two of the proposed sites in the towns of Bourne and Sandwich under severe pumping and recharge conditions.
3.2 Conceptual Model
As shown in Figure 3, Sites 1 and 2 are located on the area of the Cape Cod aquifer system known as the West Cape flow cell, which is located in the northwestern part of the Cape. A more detailed description of this flow system will be given later in this project. The West Cape aquifer is of the unconfined type and its only form of natural recharge is by infiltration from precipitation. The total thickness of the saturated zone is estimated to be in excess of 200 feet, with an average depth to water of 70 feet. The highest point of the water is located beneath the northern portion of the MMR. In general, groundwater flows radially outward from this mound and ultimately discharges to the ocean. The aquifer is bounded by the ocean in three sides, with groundwater discharging to Cape Cod
Bay on the North, to Nantucket Sound on the south, and to Buzzards Bay on the west. The eastern lateral boundary is comprised by the Bass River in Yarmouth.
In geologic terms, the two wells are situated on the Buzzards Bay and Sandwich glacial moraines, which border the western and northern shores of Cape Cod. These formations comprise the sole material in the vertical cross-section, with the possibility of some local variations.
Figure 3 Plan view of West Cape Flow Cell
ruro cell T flow 'F. WO*· 7000 "rWn
Nantucket Sound Eat cepl
- --i - --- - i West Cape flow cell U_-'______ J vsol I
3.3 Data Collection
3.3.1 Data Sources
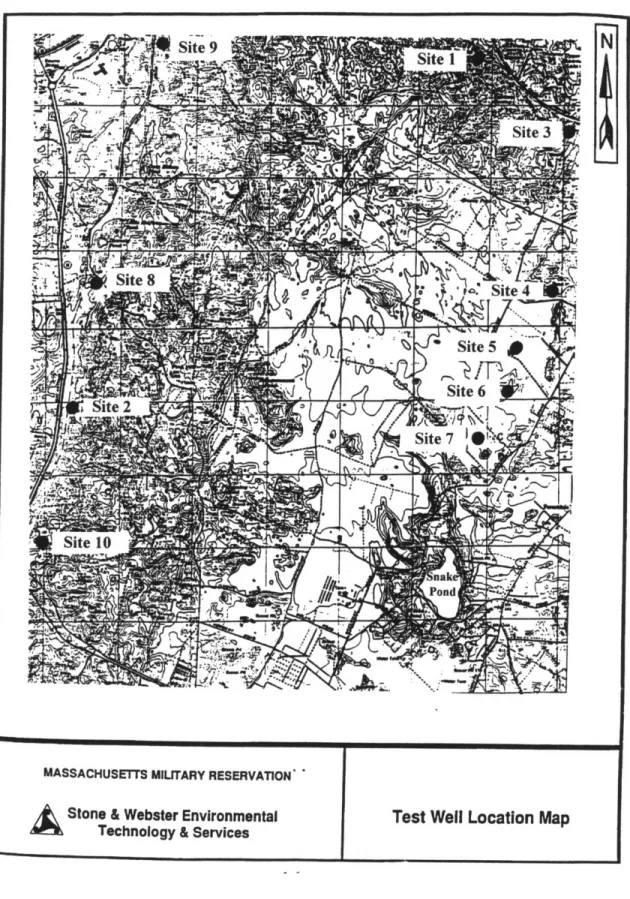
An initial evaluation of the site by Stone and Webster Engineering Corporation forms the basis for this study. The results of that work - detailed field logs depicting the test well layout and vertical geologic characteristics at each of the two sites, a matrix showing the resulting data from a series of test wells, results of drawdown tests performed on these test wells, and preliminary Zone I and II results based on analytical models - are contained in an unpublished draft report which has been given to DEP for further consideration. Figure 4 shows the locations of all the proposed sites, as presented by Stone & Webster.
This specific computer model obtains its regional flow and aquifer characteristics from a regional flow model developed by Susanna Galloni (Galloni, 1997). It incorporates actual site conditions such as water table contours, stratigraphy, and geologic material properties into a calibrated model of the entire West Cape flow cell. These and other area characteristics were interpolated into the computer model from various geologic maps generated by the United States Geologic Survey (USGS) and several other sources. The interpolation is then performed based on an initial triangulation between data points along the study area. The interpolation algorithm employed utilizes a quadratic interpolation incorporating the computed slope at each data point (CDM, 1991).
Materials regarding DEP regulations and requirements concerning the Source Approval Process and Zone II studies were obtained from the DEP's Guidelines and Policies for Public Water Systems and the Massachusetts Drinking Water Regulations. Also, selected sections of the Federal Safe Drinking Water Act were examined. Furthermore, individual Zone II studies performed by various private firms were reviewed and studied.
Finally, reports on various issues related to the Cape Cod area were also inspected. Among these, reports on water resource issues on Cape Cod, simulated pumping and recharge studies, and various particle tracking studies were studied.
3.3.2 Pump Tests
Pump tests have been performed by Stone & Webster Engineering Corporation at both Sites 1 and 2. A network of monitoring wells has also been installed as part of the testing procedure. For each site, a network of seven observation wells was put in place. The complete information regarding these observation wells is contained in Appendix 1.
Figure 4 Test Well Location Map
4. MODEL
DEVELOPMENT
4.1
Description of Code
The groundwater flow model code used in this analysis, DynSystem, was developed at Camp Dresser & McKee (CDM). This modeling package is composed of various components of which three were used in this study:
* DYNPLOT -a graphical interface code which processes all input and output * DYNFLOW -processes input files and runs flow simulations
* DYNTRACK -simulates particle transport through the aquifer
DYNFLOW uses a Galerkian finite element formulation to solve the partial differential equation that describes the transient, three-dimensional flow of a homogeneous incompressible fluid through a heterogeneous, anisotropic medium. The program uses linear finite elements, and incorporates induced infiltration from streams, artificial and natural recharge or discharge, and heterogeneous and anisotropic hydraulic properties. The program handles both linear (confined) and non-linear (unconfined) aquifer flow conditions, and has special routines to handle a change in status from a confined to unconfined situation. The program also has a "rising water" scheme to allow drainage to local streams if the potentiometric head in a phreatic aquifer rises to the elevation of the stream bed or land surface (CDM, 1991).
In plan view, a DYNFLOW grid appears to be made up of 2-dimensional triangular elements. In fact, the DYNFLOW grid allows a three-dimensional representation of the
aquifer statigraphy, with the vertical triangular prism as its fundamental unit. In the DYNFLOW vernacular, subsurface hydrological units are "layers". The interfaces between "layers" are referred to as "levels". Nodes are located on "levels" and are the locations at which the numerical solution is computed. The planar coordinates of a node do not vary between levels, but the elevation of different nodes in one level can vary. The DYNFLOW convention is to number layers starting with the lowermost (level 1/ layer 1) and proceeding upward. A more detailed description of the ground water code is contained in Appendix 2.
4.2 Study Area
4.2.1 Location
The study area is located on the northeastern part of Cape Cod, Massachusetts (see Figure 2). Cape Cod is located in the southeastern most point of the Commonwealth of Massachusetts. It is surrounded by Cape Cod Bay on the north, Buzzards Bay on the west, Nantucket Sound to the south, and the Atlantic Ocean to the east. Cape Cod, a peninsula, is separated from the rest of Massachusetts by the man-made Cape Cod Canal (Lizaro, 1996). The MMR is situated in the northern part of western Cape Cod (Figure 1). Previously known as the Otis Air Force Base, the MMR occupies an area of approximately 22,000 acres (30 square miles) (Lazaro, 1996).
Site 1 is located in the northeastern comer of the study area, in the town of Sandwich. It is situated approximately one kilometer east of the Upper Shawme Lake, in the area known
as Spruce Swamp. The Mid Cape Highway (Route 3) runs less than 300 meters from the proposed well location (Figure 5).
Figure 5 Plan view of Site 1
Site 2 is located in the southwestern corner of the study area, in the town of Bourne. It lies approximately 2 kilometers southeast of Monument Beach and is just off the MacArthur Boulevard (Route 28) (Figure 6).
Figure 6 Plan view of Site 2
4.2.2 Geology
The geology of western Cape Cod is predominantly composed of glacial sediments deposited during the Wisconsinan Period (7,000 to 85,000 years ago) (E.C. Jordan, 1989b). As a result of glacial activity during this period, two moraines, the Sandwich Moraine (SM) and the Buzzards Bay Moraine (BBM), were deposited along the northern and western edges of western Cape Cod, respectively. Site 1 is located directly on top of the Sandwich Moraine, while Site 2 sits on top of the Buzzards Bay Moraine (See Figure 7). Between the two moraines lies a broad outwash plain, known as the Mashpee Pitted Plain (MPP), which is composed of poorly sorted, fine to coarse-grained sands. At the base of unconsolidated sediments (below the MPP), fine grained, glaciolacustrine sediment and basal till are present.
Figure 7 Plan view of Sandwich and Buzzards Bay Moraine
At the regional scale, both the outwash and moraines have relatively uniform characteristics even though they contain some local variability. The way the sediments were deposited, it made the sands stratify and thus made the deposits anisotropic. The MPP is more permeable and has a more uniform grain size distribution than the moraines. Nonetheless, both the SM and the BBM have a relatively low fraction of silt and clay, making it more permeable than similar geologic formations.
The total thickness of the unconsolidated sediments (i.e., moraine, outwash, lacustrine, and basal till) is estimated to increase from approximately 175 feet near the Cape Cod Canal in the northwest to approximately 325 feet in its thickest portion in the BBM; it then decreases to 250 feet near Nantucket Sound in the southern region. The thickness of
the MPP outwash sediments ranges from approximately 225 feet near the moraines to approximately 100 feet near the shore of Nantucket Sound (E.C. Jordan, 1989b).
4.2.3 Hydrology
Cape Cod's temperate climate produces an average annual precipitation of about 48 inches, widely distributed throughout the year (Masterson and Barlow, 1994). High permeability sands and low topographic gradient, minimize the potential for runoff and erosion, and thus recharge values have been reported in the range of 17 to 23 inches/year (LeBlanc et al., 1986). Consequently, a large fraction of water that precipitates will migrate to the subsurface. This creates a high probability of contaminant transport from the surface to the groundwater.
Beneath western Cape Cod lies a single groundwater system (from the Cape Cod Canal to Barnstable and Hyannis) which the U.S. EPA has designated it as a sole source aquifer. Sole source designation is granted to an aquifer on the basis of its being needed to supply 50 percent or more of the drinking water for its service area. As mentioned earlier, this flow system is known as the West Cape Flow Cell, and it is one of six flow cells present on Cape Cod. Each of the flow cells are hydraulically distinct under present hydrologic conditions (Guswa and LeBlanc, 1985). The other five flow cells are known as: East Cape, Eastham, Wellfleet, Truro, and Provincetown flow cells (Figure 3).
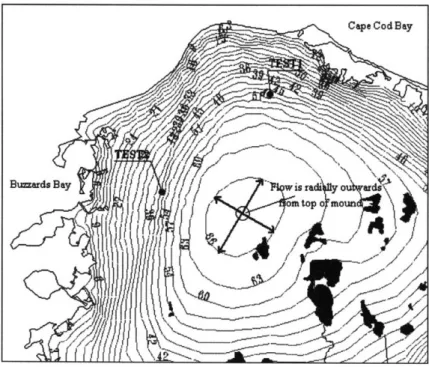
The West Cape aquifer is unconfined and its only form of natural recharge is by infiltration from precipitation. The highest point of the water table (the top of the
groundwater mound) is located beneath the northern portion of the MMR (Figure 8). In general, groundwater flows radially outward from this mound and ultimately discharges to the ocean. The aquifer is bounded by the ocean in three sides, with groundwater discharging to Cape Cod Bay on the North, to Nantucket Sound on the south, and to Buzzards Bay on the west. The eastern lateral boundary is comprised by the Bass River in Yarmouth.
Figure 8 Water table contours of the West Cape Flow Cell
Kettle hole ponds, depressions of the land surface below the water table, are common on the Mashpee Pitted Plains. These ponds influence the groundwater flow on a regional scale. Streams, wetlands and cranberry bogs serve as drainage to some of these ponds and as discharge to the groundwater, and thus comprise the rest of the hydrology of the western cape.
4.2.4 Hydrogeology
The geology and hydrology of western Cape Cod define the hydrogeologic characteristics of the aquifer. General information on the geology and hydrology of Cape Cod can be found in the works by Oldale (1982), Oldale and Barlow (1987), Guswa and LeBlanc (1985), and LeBlanc et al. (1986).Variability of the values may be due to natural heterogeneities of the soil, but also to differences in measuring techniques and data analysis (E.C. Jordan, 1989a).
4.3 Model Parameters
Aquifer parameters used in this model, such as hydraulic conductivity, porosity, and anisotropy ratio, were interpolated from the regional flow model developed by Susanna Galloni of the Master of Engineering Program, with the use of a feature in the DYNPLOT program called "regional-to-local" interpolation. With this option, all aquifer characteristics present in the calibrated regional model are applied to the specific grid developed for this Zone II study.
4.3.1 Bedrock/Groundwater Surface Elevation
Figures 9 and 10 show the vertical cross-sections depicting the bedrock contours at both proposed well sites. Bedrock and groundwater elevations in the study area were also interpolated from the regional flow model.
* i
...
!...
2500 8000
FEET
Ire 9 Cross-section view of Site 1
grouno sudace . .. lw 8.. ___ I-~C __S TIO __ _ .... lee.l3 .. ... .... ... .. . ... ... ... ... ... .... ... .... ..._ _ _ i 14 ... ... ... ... .... evl3... .. .. .... ...................... .............. ............... .............. .............. ............ ...... ....... 1100 s000 a 600 I00 930- Op " .. 00 FJ 3E E""
ire 10 Cross-section view of Site 2
)ns were chosen to coincide with surface water divides, hce water elevations meet. To the north, the model area is
)n the southern side, both Vineyard and Nantucket Sound
s; Buzzard's Bay serves as the model's boundary on the
PFEET 100 8o 00. 40 20 0 -- 0O -- eo0 -100 - .II O 0 Site 2 laverS lwver 4 000 000 1000 2000 TT il 1FEET 160 100 0 0 -00 -100 ... ....· ground owface I-I- - ...-"' ... ...
...
..
...-
··-···
.ii i ..i---western side, and Cape Cod Bay was used on the northeastern side of the model. Finally, on the eastern side, Bass River is used as the boundary on that area. Along these boundaries, a condition known as "fixed head" was chosen in DYNPLOT. This is done for nodes where the head is expected to stay constant but the flux is unknown, such as at
surface water bodies (CDM, 1995).
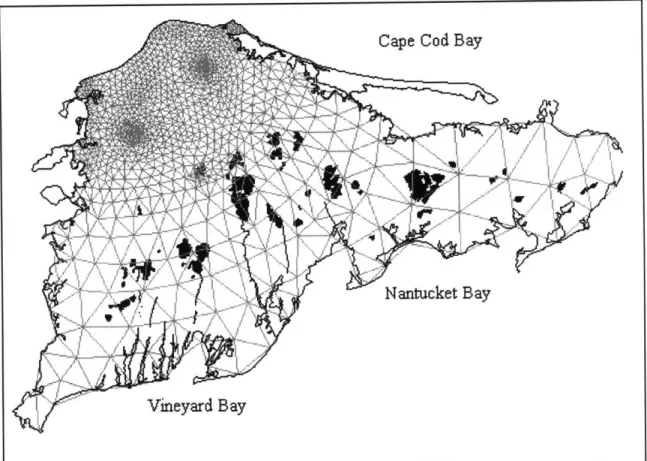
An automated grid generation routine was used to create the DYNFLOW numerical grid, within the boundaries described above. A plan view of the finished grid is shown in Figure 11. As shown earlier in Figures 9 and 10, the grid is divided into 8 levels and 7 layers within them. The top level represents the ground surface elevation at the study area. The bottom level coincides with the bedrock contours interpolated from various geologic maps.
Figure 11 Plan view of 3-D numerical grid
The specific shape of the grid was chosen in order to provide more detail in the areas near the proposed pumping wells. As seen in Figure 12, the level of detail is largest at the immediate location of the wells and gradually decreases as it goes away from the study area. Furthermore, the outer shape of the grid follows the outline of the various coasts. As mentioned in the beginning of this section, this allows for the use of a "fixed head" boundary condition along those boundaries (Figure 13). On the eastern boundary, the grid follows the shape of the Bass river.
Figure 12 Closer view of numerical grid
In terms of the vertical detail for this specific flow model, an extra level was added near the screened sections of both wells. This was done in order to be able to assign flux values to specific model nodes to simulate both wells' respective pumping rates. On Site 1, the designed pumping rate is divided by two, and each half is assigned to a specific node on the levels directly above and below the screened section. This does not affect the results of the simulations since the distance of the approximation is in the order of 5 feet, and our area of interest is several orders of magnitude larger. Furthermore, the possible effects of this variation are negligible a short distance away from the well. In the case of Site 2, the entire flux is assigned to one node in the level located halfway through the well's screened section.
F = Fixed Head Conditions R = Rising Head Conditions
Figure 13 Boundary conditions of numerical grid
4.3.3 Material Assignments and Properties
Material assignments and properties were also interpolated from the regional model. Figures 14 and 15 are vertical cross sections at Sites 1 and 2 which show the materials present in the vicinity of the pumping wells. These figures show that both sites are located in areas consisting solely of moraine materials throughout its entire vertical direction, although on a smaller scale, there may exist some variability in the geologic materials at one or both of the sites. Figures 16 through 23 show horizontal cross-sections which depict the materials present at each level in the regional scale.
0
Figure 15 Cross-sectional view of Site 2 with materials
loraine material is ttomset vary as it approaches the ground surface.
FEET
FEET
Figure 16 View of materials in layer
I I I I I I I I I I I
Figure 17 View of materials in Layer 2 90 80 70 80 60 40 30 20 10 0 10 20 -10 0 10 20 30 40 60 60 70 80 90 100 110 120 THOUSANDS OF FEET ýEM Mdoraine o °
!
J
80 70 60 40 40 30 20 10
WY
-10 0 10 20 30 40 60 60 70 80 90 100 110 J20 THOUSANDS OF FEETFigure 18 View of materials in Layer 3
0
I I I I I I I I I I I I I I
Figure 19 View of materials in Layer 4 0 MATERIALS LAYER 3 = Moraine 80 70 60 60 40 30 20 10 JVI5pv.DG Fl l Moraine -10 0 10 20 30 40 60 60 70 80 90 100 110 120 THOUSANDS OF FEET E E
-E
-31
E
F I I I Ii
Figure 20 View of materials in Layer 5
80 70
10
40
.^ . Topeset D
1111 _Bay Lake deposits STopset P
To]pset M Moraine
-10 0 10 20 30 40 50 60 70 00 90 100 110 120
THOUSANDS OF FEET
Figure 22 View of materials in Layer 7
4.3.4 Pumping/Recharge Conditions
In order to determine the zones of influence for Sites 1 & 2, extreme pumping and recharge conditions had to be simulated. As discussed earlier, DEP Zone II requirements indicate that the various pumping simulations have to be run at their safe yield rate constantly for a period of 180 days with no recharge to the model. The specified pumping rates for the well simulations were determined by DEP to be 600gpm and 1200gpm (Dayian, Personal Communication).
5. MODEL CALIBRATION
5.1 Calibration Philosophy
The goal of the calibration process is to reproduce an observed system behavior. The method used in this thesis project was to deduce the distribution of aquifer materials based on pump tests observations obtained from a series of field tests performed by Stone & Webster Engineering Corporation for the Massachusetts DEP. The calibration process involved altering such aquifer characteristics as hydraulic conductivity (Kx & Ky), Anisotropy ratio (Kx/Kz), Specific storage (S) and Specific yield (Sy) for the various materials present at both well sites.
The model calibration consisted of running steady-state simulations using the average recharge rate specified earlier in this project and the specific pumping rates used by Stone & Webster on the individual pump tests and comparing the drawdowns predicted by the model to those observed in the field. Table 1 in the following section presents the various pumping rates used and the various aquifer material values reported for each observation well.
For this study, both observation wells #6 (Site l's OBS-6 & Site 2's OBS-6) were used for the calibration of both Sites 1 and 2. These specific wells were chosen because they are both located a good distance away from the pumping wells, which would probably provide better results in the drawdown curve analysis. Observation wells located closer to the actual sites might not completely reflect the effects of drawdown in the test results.
Furthermore, a discharge line was placed some distance from the wells in order to dispose of the water extracted form the sites during testing, which might have caused some amount of recharge into the aquifer, thus affecting the results of the tests. As will be seen later in this section, the location of that discharge line with respect to one of the chosen observation wells affected the calibration process to some extent.
5.2 Pumping Rates
Pumping tests at Site 1 were performed between 9/6/96 and 9/11/96. They were run for 24 hours a day for a period of 5 days. Tests for Site 2 were performed between 8/14/96 and 8/19/96. As with Site 1, these were also run for 24 hours a day for a total of 5 days. A network of 7 observation wells was placed in the vicinity of each site. Table 1 shows the information used and obtained for each observation well.
OBS-5 *OBS-6 OBS-7 OBS-3 OBS-4 OBS-5 *OBS-6 5 5 5 5 5 5 5 88.3 88.3 88.3 90.24 90.24 90.24 90.24 9.5 11.0 10.5 12.0 12.0 13.7 11.6 0.00025 0.00050 0.00018 0.00095 0.00053 0.00040 0.00037 0.02 0.10 0.02 0.20 0.02 0.10 0.10 17:1 14:1 35:1 26:1 49:1 85:1 54:1 Table 1 Observed field data from pumping test
5.3 Calibration of Material Assignments and Properties
Since both Sites 1 and 2 are located directly on the Sandwich and Buzzard's Bay Moraine respectively, and all the observation wells were placed within these geologic formations, the calibration process revolved around only those materials which comprised the moraines.
The model calibration began by simulating the pumping tests performed by Stone and Webster. All initial test conditions were assigned equal to those used by S&W. As seen in Table 1, these included test duration, pumping rates (Q), Specific storage (S), Specific yield (S,), and Anisotropy ratio (Kh/Kz). Before each simulation, the observed drawdowns were plotted on a log-log scale versus time to obtain the characteristic curve for that test. After each simulation was completed, the simulated drawdowns were calculated by obtaining the initial head value for the system and subtracting the resulting head for each time step. The drawdown was then plotted in the same graph in order to compare both curves. Then parameters were modified in order to obtain similar curve shapes.
In the case of Site 1, the calibration process involved several steps. As seen in Figure 23, there was a substantial difference between the simulated and the observed drawdown curves in the first trial run. In the simulations that followed, the anisotropy ratio was lowered in order to reduce the amount of drawdown in the system. By reducing the ratio, the relative impact of the vertical hydraulic conductivity (Kz) is lower than that of the horizontal hydraulic conductivity (Kx). This means that water will prefer traveling in the
horizontal direction than in the vertical, thus reducing the total drawdown in the system. Another change introduced in the model was a 10 feet/day raise in both Kx and K, for all materials that comprised the moraines. This further reduced the drawdown throughout the entire modeled system. Finally, the Specific storage (S) value in the model was lowered, which caused the initial drawdown in the aquifer to increase. The value for the Specific Yield (Sy) was not changed since the final drawdown values were very similar for both the simulated and observed curves.
In the case of Site 2, calibration was not completed due to various factors found while inspecting the observed drawdown curves. One of these was the fact that for every pumping test performed for that site, the observed drawdown followed the classic Theis curve shape in the test's early stages but after some time proceeded to level out, meaning that either the tests were not run for enough time or that there was a nearby source of recharge to the system. One possible explanation for the latter theory is that the observation wells are located near the discharge line used to dispose of the water extracted from the wells during testing, which might have been lessening the drawdown effects at those observation wells.
As described in Introducing Groundwater(Price, 1996): "The complete response of an
unconfined aquifer to pumping can thus be thought of as comprising three stages.
initially, the response is like that of a confined aquifer, with water being released from
compressible storage; in the second stage, the rate of drawdown decreases as vertical
drainage catches up with the growth of the cone, the drawdown again follows a Theis
curve, but one corresponding to a higher storage coefficient (the specific yield)". This
quote was extremely helpful during the process of calibration since it described the processes that affected each part of the drawdown curve, which in turn provided a set of options and guidelines for the ultimate calibration of the model.
Table 2 shows the initial and final values for each of the parameters involved in the calibration of Site 1. Only one of the moraine materials is shown since all have identical values for all parameters except the hydraulic conductivity. Figure 24 shows the final drawdown curve after calibration for Site 2.
Table 2 Initial and final values of modeled aquifer parameters
Figure 23 Initial results of calibration
Figure 24 Final results of calibration
Initial Drawdown Curves
10 M N w1 _ Simulated drawdown •----. Obsered drawdown 0.1 0.1 1 10 100 1000 10000
Elapsed time (min)
Final Calibrated Drawdown Curve
10 Simulated Drawdown - Observed Drawdown E 0.1 0.01 0.1 1 10 100 1000 10000
6. DISCUSSION OF RESULTS
The following sections show the results of the various pumping simulations under different pumping rates and recharge conditions. Each simulation will be discussed and its results evaluated. The figures in each section show the water table contours after the simulation has been run, the resulting capture zones after performing the simulations and other relevant details. Table 2 shows the various cases that will be simulated and their specific conditions. Pumping values are presented in [gpm] and recharge values in [inches/year ]. 1200 0 1200 0 600 0 0 0 600 0 1200 1200 0 600 600 0 1200 1200 21.42 600 1200 21.42
In order to perform the pumping simulations, the necessary information needs to be incorporated into the DYNFLOW program. The essential data are: each particular simulation's pumping rate and the specific location of each screened section, recharge value for the site, time step and the simulation's total duration time. The command files used in the simulations can be seen in Appendix 3
6.1
Resulting
zone
of influence for Simulation #1
0 5000 10000 15000 20000 25000 300O0 35000 40000 FEET
Figure 25 Capture Zone for Site #1 at 1200gpm under zero recharge
70000 65000 60000 56000 50000 45000 40000 I I I I I I I I I I E -E E
Observations
Figure 25 depicts the results of the capture zone simulation for Site 1. As indicated in Table 3, the simulated pumping well at Site 1 was run at 1200 gpm for a period of 180 days with no recharge to the system. The well located at Site 2 was not pumped during this simulation.
The following observations were made on inspection of the results of this capture zone simulation:
* The 180 day drought transients caused the maximum head value of the aquifer to fall approximately 7 feet, from 65 to 58 feet above sea level.
* The capture zone of the Site 1 well extends out from the well location in a mostly southern direction.
6.2 Resulting
zone
of influence for Simulation #2
0 5000 10000 15000 20000 26000 30000 35000 40000 FEET
Figure 26 Capture Zone for Site #2 at 1200 gpm under zero recharge
70000 85000 60000 56000 50000 45000 40000 35000 I I I I I I I I I I -E
Observations
Figure 26 shows the results of the capture zone simulation for Site 2. In this case, the simulated pumping well at Site 2 was run at 1200gpm for a period of 180 days with no recharge to the system. The well located at Site 1 was not running during this simulation.
The following observations were made on inspection of the results of this capture zone simulation:
* The 180 day drought condition again caused the maximum head value of the aquifer to fall approximately 7 feet, from 65 to 58 feet above sea level.
* The shape of the regional water table contours in this simulation varies very little from that of simulation #1.
* The capture zone of the Site 2 well extends out from the well location in a southeasterly direction.
6.3 Resulting zone of influence for Simulation #3
Observations
Figure 27 depicts the results of the capture zone simulation for Site 1. As indicated in Table 3, the simulated pumping well at Site 1 was run at 600 gpm for a period of 180 days with no recharge to the system. The well located at Site 2 was not pumped during this simulation.
The following observations were made on inspection of the results of this capture zone simulation:
* The 180 day drought transients caused the maximum head value of the aquifer to fall approximately 7 feet, from 65 to 58 feet above sea level.
* As with simulation #1, the capture zone of the Site 1 well extends out from the well location in a southwesterly direction, but with a smaller total area of influence.
6.4 Resulting
zone
of influence for Simulation #4
Observations
Figure 28 depicts the results of the capture zone simulation for Site 2. As indicated in Table 3, the simulated pumping well at Site 2 was run at 600 gpm for a period of 180 days with no recharge to the system. The well located at Site 1 was not pumped during this simulation.
The following observations were made on inspection of the results of this capture zone simulation:
* The 180 day drought caused the maximum head value of the aquifer to fall approximately 7 feet, from 65 to 58 feet above sea level.
* The capture zone of the Site 2 well again extends out from the well location in a southwesterly direction, but with a smaller total area of influence than in simulation #2.
6.5 Resulting zones of influence for Simulation #5
Observations
Figure 29 depicts the results of the capture zone simulation for Sites 1 and 2. As indicated in Table 3, both simulated pumping wells were run at 1200 gpm for a period of 180 days with no recharge to the system.
The following observations were made on inspection of the results of this capture zone simulation:
* The 180 day drought caused the maximum head value of the aquifer to fall approximately 7 feet, from 65 to 58 feet above sea level.
* The capture zone of the Site 1 well extends out from the well location in a southerly direction. The capture zone of the Site 2 well extends southward from the well location.
* Site l's capture zone crosses the Live Fire Impact Area on its entire eastern side. Site 2 intrudes on the LFIA's lower left side.
6.6 Resulting zones of influence for Simulation #6
o 5000 10000 16000 20000 26000 30000 35000 40000 FEET
Figure 30 Capture Zones for Sites 1 and 2 at 600 gpm under zero recharge
75000 70000 865000 60000 55000 50000 46000 40000 35000 n
-Observations
Figure 30 depicts the results of the capture zone simulations for Sites 1 and 2. As indicated in Table 3, both simulated pumping wells were run at 600 gpm for a period of
180 days with no recharge to the system.
The following observations were made on inspection of the results of this capture zone simulation:
* The 180 day drought caused the maximum head value of the aquifer to fall approximately 7 feet, from 65 to 58 feet above sea level.
* Again, the capture zones for this simulation follow the same directions as in simulation #5, but with a smaller total area of influence caused by the reduced pumping rates.
6.7
Resulting zones of influence for Simulation #7
0 5000 10000 16000 20000 26000 0000 35000 40000
FEET
Figure 31 Capture Zones for Sites 1 and 2 at 1200 gpm under normal recharge
76000 70000 66000 60000 55000 50000 46000 40000 I I I I I I I I I I I E
-E Ek
Observations
Figure 31 depicts the results of the capture zone simulations for Sites 1 and 2. As indicated in Table 3, both simulated pumping wells were run at 1200 gpm for a period of 180 days with normal recharge to the system.
The following observations were made on inspection of the results of this capture zone simulation:
* Final head values for this simulation resembled those of all the previous simulations, with the maximum head value being lowered by approximately 7 feet.
* All results obtained in this and the following simulation are identical to those from simulations #5 and #6. Normal recharge conditions, as opposed to zero recharge conditions, did not have as much effect on the modeled system as expected.
6.8 Resulting zones of influence for Simulation #8
I I I I I I I I I
0 5000 10000 15000 20D00 25000 30000 35000 40000
FEET
Figure 32 Capture Zones for Sites 1 and 2 ,t ,"" .,--- :::-m! recharge
Site 1
75000 70000 65000 60000 65000 50000 45000 40000 35000 -E E E-7. CONCLUSIONS AND RECOMMENDATIONS
Several conclusions can be derived from this study:
The use of this computer model proved to be an excellent tool in the development of this type of study. It has the ability to incorporate all the necessary requirements for the delineation of a Zone II study, such as the absence of recharge to the study area for extended periods of time, and it has the capacity to simulate actual aquifer features such as varying geologic parameters, natural boundary conditions, and various hydrologic characteristics such as fixed head and rising water conditions. If developed concisely, it can provide results comparable to actual ones, but with a shorter time frame and less of a budgetary constraint than more conventional methods of aquifer analysis.
In terms of the calibration process, it was found that in order to accurately simulate field conditions, substantial changes had to be made to various hydraulic parameters such as hydraulic conductivity (horizontal and vertical), specific storage, and anisotropy ratio. Several factors might have influenced or affected the process, such as the assumption of no material variability in the vertical direction in the vicinity of both the observation wells and the pumping wells. Localized material heterogeneity might have played an important role in the actual field conditions. Also, since the calibration process only involved moraine materials, actual aquifer response a distance away from the wells was not completely grasped. Furthermore, in the case of Site 2, the hypothesis of the nearby discharge line causing some degree of recharge into the system, cannot be completely supported unless actual site conditions are witnessed. Finally, as seen in the simulation
results, the aquifer had a total drawdown of approximately 7 feet regardless of the pumping rate or recharge value used. This somewhat extreme effect might have been generated by the material changes made during the calibration process, by effectively making it easier for the water in the aquifer to go through both of the moraines, thus leaving the system.
As seen in the various simulations, all the zones of influence modeled crossed the Live Fire Impact Area (LFIA) at some point or another. Among the factors which varied the amount of intrusion into the LFIA were: varying pumping rate, number of pumping units at a time, and location of site with respect to the LFIA and the top of the aquifer. The amount of recharge to the aquifer system proved not to be a determining factor in the shapes and sizes of the resulting zones of influence since for both cases (recharge vs. no-recharge) the regional head contours and thus, the wells' capture zones turned out to be almost identical.
Since the effects and final fate of exploded munitions on the groundwater are not completely understood (Cook, 1997), I can only speculate as to the increased risk of having the proposed wells' capture zones draw water from that area. In any case, it is known that LFIAs can be potential sources of contaminated groundwater (Cook, 1997). The fact that both sites are located so close to this area of the MMR and to other sources of contamination, plus the issue of the large amount of recharge the system receives in the form of rainfall, constantly "flushing" the aquifer, strongly suggests that further research into the subject is warranted. There is not enough hard evidence to either validate or
discredit that theory, and therefore more effort should be put into it in terms of regulations or consideration of treatment technologies in conjunction with the installation of public water supply wells near environmentally sensitive areas such as the Live Fire Impact Area.
In terms of developing a comparison of the results from the various pumping simulations, several different conclusions could be reached depending on the primary interest of the analysis. If the study's main concern is to minimize the amount of intrusion into the LFIA, then Site 2 is clearly the best option for both pumping rates since the resulting zones of influence cross through a much smaller portion of the LFIA than Site 1's capture zones. In the same line of comparison, a pumping rate of 600 gpm will obviously produce a smaller zone of influence than that created by a rate of 1200 gpm, thus crossing through a smaller portion of the area. For this comparison, though, other issues such as the community's water supply requirement have to be taken into consideration.