HAL Id: hal-01461134
https://hal.archives-ouvertes.fr/hal-01461134
Submitted on 7 Feb 2017
HAL is a multi-disciplinary open access
archive for the deposit and dissemination of sci-entific research documents, whether they are pub-lished or not. The documents may come from teaching and research institutions in France or abroad, or from public or private research centers.
L’archive ouverte pluridisciplinaire HAL, est destinée au dépôt et à la diffusion de documents scientifiques de niveau recherche, publiés ou non, émanant des établissements d’enseignement et de recherche français ou étrangers, des laboratoires publics ou privés.
TRANSFORMATIONS AND GASEOUS EMISSIONS
DURING WINDROW COMPOSTING
Didier Oudart, Melynda Hassouna, Paul Robin, Jean Marie Paillat
To cite this version:
Didier Oudart, Melynda Hassouna, Paul Robin, Jean Marie Paillat. REPEATABILITY OF OR-GANIC MATTER TRANSFORMATIONS AND GASEOUS EMISSIONS DURING WINDROW COMPOSTING. Emissions of gas and dust from livestock, IFIP - Institut du Porc, 2013. �hal-01461134�
REPEATABILITY OF ORGANIC MATTER TRANSFORMATIONS AND GASEOUS EMISSIONS DURING WINDROW COMPOSTING
Oudart, D.1,2,4, Hassouna, M.3, Robin, P.3, Paillat, J.M.2
1
Crête d’Or Entreprise - ZA des Sables - 97427 Etang-Salé; 2
CIRAD – UPR Recyclage et Risque, BP 20, 97408 Saint-Denis Messagerie Cedex 9; 3
INRA – UMR SAS, 65 rue de Saint Brieuc, cs84215, 35042 Rennes cedex 01; 4
Université de Toulouse, INSA, UPS, INP, LISBP, 135 avenue de Rangueil, 31077 Toulouse.
ABSTRACT: To assess the repeatability of composting, three heaps composed of wheat straw and pig slurry were set up in a gas monitoring enclosure with the same characteristics for volume, mass and composition. Composting lasted 20 days during which NH3, CO2, N2O, CH4 and N2O emissions and internal temperatures were
measured. Wet weight, dry matter and carbon balances were repeatable with a maximum coefficient of variation (CV) of 1.5%, and core temperatures with a maximum CV of 3% during thermophilic peak. Largely, gaps were observed for the gaseous emissions with a CV of 11%, 9% and 4%, respectively, for NH3-N, CO2-C
and H2O cumulated emissions. Mass balances are thus essential to check measured
flux of gaseous emissions.
Keywords: composting process, kinetics of OM oxidation, NH3-CO2-N2O-H2O
emissions, repeatability
INTRODUCTION: During composting livestock effluents, organic matter (OM) transformations lead to large gaseous emissions which can harm the environment and decrease the value of the compost as fertilizer (Hassouna et al., 2008). Previous studies have shown that kinetics and total amount of gaseous emissions varied following initial conditions of composting as porosity, humidity and nature and quantity of carbon and nitrogen species (Paillat et al., 2005; Abd el Kader et al., 2007). In these previous experiments, the variability in gaseous emissions and nutrient mass balance are linked to the differences in initial conditions, but also to the variability of biological and physical processes and the uncertainty linked with the experimental device and measurements. A repeatability composting experiment was developed to quantify this variability and uncertainty.
1. MATERIAL AND METHODS:
1.1. Materials and experimental design: Three heaps of the same mix composed of wheat straw (21% of total weight) and pig slurry (79% of total weight) were set up in a gas monitoring enclosure with the same characteristics for weight (517.4 ±0.4 kg per heap), volume (1.37 m3), dry matter content (29.8%) and free air space (66.4%). Design of the enclosure is described by Paillat et al. (2005). Composting was monitored for 20 days before being turned and then fluxes were measured over 5 months for NH3, CO2, CH4 and H2O and internal temperature in four characteristic
zones of the heaps.
1.2. Compost sampling and analysis: To prepare the mixture, all straw was spread on the floor. Pig slurry was then sprayed onto the straw. Next, this preparation was mixed by a rotary cultivator. The three heaps were then constructed simultaneously to control the weight of each. The stockpiling lasted 24 hours so that composting began before the end of handling. Gaseous emissions were measured by the 1312 analyser from Innova (Brüel & Kjaer, Innova, Skordsborgvej 307, Naerum DK-2850).
Concentration measurements were automatically recorded by a computer (RS232 interface). Temperatures inside the heaps, dry and wet air temperatures inside and outside the enclosure, and air speed were recorded every 2 min and averaged every 30 min by two data-loggers (SA70 from AOIP, SAS, Ris-Orangis F-91130, and 21X from Campbell Scientific, Courtaboeuf, F-91967 cedex). After 20 composting days, the three windrows were removed, weighed, mixed and then constructed again. Compost was sampled following the protocol of the French Energy and Environmental Agency (Ademe, BP 90406, Angers F-49004 cedex 01). For each sample, total carbon, total Kjeldhal nitrogen, soluble nitrogen, dry matter content, and Van Soest fractionation were measured. Volumes and weights of the heaps were also measured at the beginning of the experiment and after the 20 composting days.
1.3. Assessment of composting repeatability: To assess the repeatability of the composting process, mean, standard deviation (SD) and coefficient of variation were calculated for the different biochemical and physical characteristics of the three heap replications of the initial mixture and the compost sampled after 20 days.
2. RESULTS AND DISCUSSION
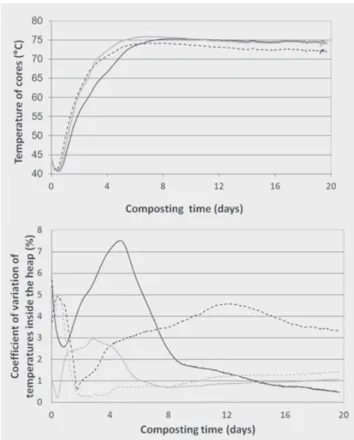
2.1. Kinetics of temperature and gaseous emissions Core temperatures were repeatable with a maximum in the variation coefficient of 3% during the thermophilic peak (figure 1). The maximum CV (7.5%) was observed for the bottom of the heaps during the thermophilic phase. This zone of the heaps is the less aerated area. Therefore, greater heterogeneity exists among the heaps.
Figure 1. Kinetics of the temperature (left) in the center of heap 1, 2 and 3 (respectively shown by a black line, dashes and grey line). Coefficients of variation
(right) of the temperatures measured at the bottom (black line), at the side (black dashes), at the core (grey line) and at the top (grey dashes) of the three replicated
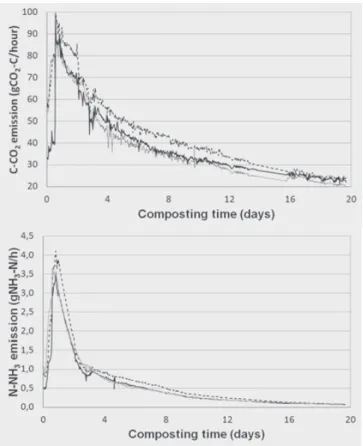
Characteristic times of the gaseous emissions’ kinetics were similar (Figure 2), e.g. time at which the thermophilic peak occurs differed less than 5 hours. However, amplitudes of emissions were quite different: the gaps between maximal and minimal emission values were equal to 16.0%, 17.4%, 22.4% and 32.6% for H2O, CO2, NH3
and CH4 emissions, respectively. The cumulative emissions of CO2, H2O and NH3
after 3 weeks were, respectively, equal to 24.2 ± 2.0% of initial carbon, 36.7 ± 1.4% of initial water and 12.1 ± 1.3% of initial nitrogen.
Figure 2. Kinetics of CO2-C (left) and NH3-N (right) emissions (respectively, in gCO2
-C/h and in gNH3-N/h) during the thermophilic phase of composting for heap 1 (bold
black line) heap 2 (dashes) and heap 3 (grey line).
2.2 Masses balances:
2.2.1. Elements: After 21 composting days, wet weights of the three turned heaps were similar (332 ±1.9 kg), as well as dry matter content (34.1 ±0.2%). Mass balances were also similar: carbon and water losses were, respectively, equal to 28.4 ± 1.2% of initial carbon and 39.7 ±0.6% of initial water. After 6 composting months, nitrogen losses measured by mass balance were equal to 25.9 ±3.9% of initial nitrogen.
Table 1. Chemical and biochemical composition of the initial mixture and after 20 composting days: mean, standard deviation (SD) and coefficient of variation (CV).
Initial mixture Compost sample
Mean ± SD CV (%) Mean ± SD CV (%)
WW (kg wet weight) 517.4 ± 0.4 0.1 332.2±1.9 0.6
DM (% wet weight) 29.8 ± 0.9 3.0 34.1±0.3 0.8
TC (% dry weight) 49.4±0.1 0.1 48.1±0.7 1.5
TKN (% dry weight) 1.4±0.1 6.5 #N/A #N/A
SVS (% dry weight) 30.0±1.1 3.7 37.5±0.9 2.5
HCVS (% dry weight) 27.5±0.4 1.4 16.2±0.1 0.8
CVS (% dry weight) 36.4±0.6 1.8 36.8±0.8 2.2
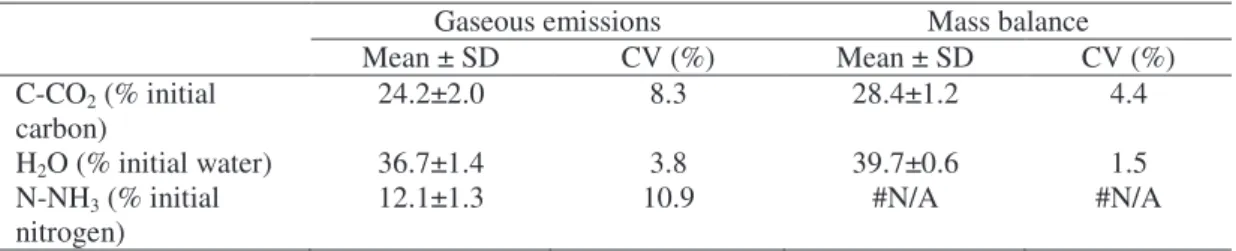
Element losses estimated by gaseous emissions were underestimated in comparison to estimation by mass balances (table 2). The variation between the three heaps was also greater for gaseous emissions. This can be explained by the more complex protocol to measure gaseous emissions than element concentrations in a compost sample. Gaseous emission measurements thus seemed to give an estimation of the kinetics of transformation in terms of duration. Mass balances enabled correction of the quantity of emitted gases.
Table 2. Losses of carbon, water and nitrogen measured by gaseous emissions and mass balances.
Gaseous emissions Mass balance
Mean ± SD CV (%) Mean ± SD CV (%) C-CO2 (% initial carbon) 24.2±2.0 8.3 28.4±1.2 4.4 H2O (% initial water) 36.7±1.4 3.8 39.7±0.6 1.5 N-NH3 (% initial nitrogen) 12.1±1.3 10.9 #N/A #N/A
2.2.2. Stabilization: The evolution of the size of the Van Soest fractions was homogeneous for the three heaps. The coefficients of variation were similar for the initial mixture and after 20 composting days for each fraction. Van Soest fractionation enables explaining the biodegradability of the matter and kinetics of oxygen consumption (Oudart et al., 2011). The repeatability of the fractions’evolution seemed to show that there were similar flows of microbial growth and oxygen consumption in the three heaps, confirmed by the repeatability of CO2 emission flow.
2.3. Volume and porosity: Volumes of the three heaps decreased from 1.37 m3 to 1.13±0.02 m3 (CV = 1.7%), whereas porosities increased from 66.4% to 74.3±0.4% (CV = 0.5%) after 20 composting days. The evolution of the total volume, volumes of water, air and dry matter of the three heaps had similar behavior. While fabrication of the heaps inevitably differed with heterogeneous repartitions of the matter and the porosity, the global evolution was identical. The local evolution of porosity and volume seemed to have no impact on their global evolution. A similar structuring material with a specific matter density can attempt to understand the evolution of volume and porosity and its potential for maintaining positive aeration conditions. CONCLUSION: The results of mass balances, characteristic times of emission kinetics and temperature kinetics showed that biological and physical processes were repeatable for a similar composting situation. Mass balances attested that similar quantities of elements (C, N, and H2O) were lost. Therefore, observed differences for
values of fluxes of H2O and CO2 were probably mainly due to the uncertainty of
measurement. Differences in NH3 and CH4 emissions after 20 days were highest and
probably due to different distribution of free air space. Mass balances are then essential to check measured fluxes of gaseous emissions.
REFERENCES:
Abd El Kader N., Robin P., Paillat J.M., Leterme P., 2007. Turning, compacting and the addition of water as factors affecting gaseous emissions in farm manure composting. Bioresource Technol., 98-14, 2619-2628.
Hassouna M., Espagnol S., Robin P., Paillat J.M., Levasseur P., Li Y., 2008. Monitoring NH3, N2O, CO2 and CH4 emissions during pig solid manure storage and effect of
turning. Compost Sci. Util., 16-4, 267-274.
Paillat J.M., Robin P., Hassouna M., Leterme P., 2005. Predicting ammonia and carbon dioxide emissions from carbon and nitrogen biodegradability during animal waste composting. Atmos. Environ., 39-36, 6833-6842.
Oudart D., Paul E., Pommier S., Robin P., Paillat J.M., 2011. Modeling organic matter stabilization during windrow composting of livestock effluents. XIIème Congrès de la Société Française de Génie des Procédés, 29 nov. – 1er déc. 2011, Lille.
ACKNOWLEDGEMENTS: This work is part of a PhD training funded by the Association Nationale de la Recherche et de la Technologie of France (ANRT) and Crête d’Or Entreprise. The “Agence Nationale de la Recherche”, also provides funds through the Project ANR-08-STRA-15 ISARD “Intensification des systèmes de production agricole par le recyclage des déchets”.