HAL Id: tel-01230686
https://tel.archives-ouvertes.fr/tel-01230686v2
Submitted on 22 Oct 2016
HAL is a multi-disciplinary open access
archive for the deposit and dissemination of sci-entific research documents, whether they are pub-lished or not. The documents may come from teaching and research institutions in France or abroad, or from public or private research centers.
L’archive ouverte pluridisciplinaire HAL, est destinée au dépôt et à la diffusion de documents scientifiques de niveau recherche, publiés ou non, émanant des établissements d’enseignement et de recherche français ou étrangers, des laboratoires publics ou privés.
unidimensionnel
Filippo Ferdeghini
To cite this version:
Filippo Ferdeghini. Liquides ioniques sous confinement nanométrique unidimensionnel. Atomic Physics [physics.atom-ph]. Université Pierre et Marie Curie - Paris VI, 2015. English. �NNT : 2015PA066440�. �tel-01230686v2�
DE L’UNIVERSITÉ PIERRE ET MARIE CURIE
Spécialité : Physique
École doctorale : « Physique en Île-de-France »
réalisée au
Laboratoire Léon Brillouin (CEA-CNRS)
CEA Saclay, France
présentée par
Filippo FERDEGHINI
pour obtenir le grade de :
DOCTEUR DE L’UNIVERSITÉ PIERRE ET MARIE CURIE
Sujet de la thèse :
Liquides ioniques sous confinement
nanométrique unidimensionnel
soutenue le 20 octobre 2015
devant le jury composé de :
Prof. Jean Le Bideau Université de Nantes Rapporteur
Dr. Arnaud Desmedt Université de Bordeaux 1 Rapporteur
Prof. Aleksandar Matic Chalmers University of Technology Examinateur
Dr. Denis Morineau Université de Rennes 1 Examinateur
Dr. Anne-Laure Rollet Université Pierre et Marie Curie Présidente
Dr. Patrick Judeinstein CEA Saclay Invité
This PhD work has taken place at the Laboratoire Léon Brillouin of CEA of Saclay. I would like to thank the laboratory director Christiane Alba-Simionesco and the deputy directors Jean-Paul Visticot and Eric Eliot for welcoming me to the laboratory and guaranteeing me excellent work conditions during these three years.
I am very thankful to Jean Le Bideau and Arnaud Desmedt for accepting to be the referees of my work and to Denis Morineau, Anne-Laure Rollet and Aleksandar Matic for accepting to be my thesis examiners.
I would like to express all my gratitude to my two supervisors Jean-Marc Zan-otti and Patrick Judeinstein, who have followed me during these three years. I thank them for their support and patience they always showed me during my PhD and for the confidence in me. Furthermore I have particularly appreciated their pleasantness and their continuous helpfulness which made my stay at the LLB a very good experience.
I would like to thank also the other members of the "Ionic Liquids Dream Team".
First of all I thank Quentin Berrod, who has always showed me his availability, support and enthusiasm during all phases of my doctorate (from the measurements to the defense). I am grateful for the time he spent discussing all topics stretching from the QENS data analysis to the French grammar (I would try not to forget his lessons).
I also thank Kuldeep Panesar, who helped me to settle in the laboratory (and in Paris) and introduced me to the world of ionic liquids.
The results obtained during these years have been possible thanks to collabo-ration and the advice of several people that I met during my PhD and I would like to thank all of them: the group of LITEN of Grenoble composed by Jean Dijon, Adeline Fournier , Hélène Le Poche and Raphael Ramos for the synthesis of the carbon nanotubes; Jacques Ollivier, local contact of IN5 (ILL); Stéphane Rols, local contact of IN4 (ILL); Peter Fouquet and Orsolya Czakkel local contacts of IN11 (ILL); Victoria Garcia-Sakai, local contact of IRIS (ISIS); Ralf Gilles, local contact of SANS-1 (MLZ); Stéphane Longeville, local contact of MUSE (LLB)
and Alain Lapp local contact of PAXY (LLB); Daniela Russo who allowed me to perform some tests on IN16; Fernando Formisano (ILL), Sandrine Lyonnard (INAC) and Stefano Mossa (INAC) for their time spent to discuss about my re-sults of my QENS study and their precious advices; Marie Plazanet (LIPHY) for the tests of transient grating spectroscopy; Cristina Iojoiu (LEPMI) for the PFG-NMR measurements. Benoît Coasne (PSM) for the useful advice concerning the developed model for the neutron data analysis; Doru Constantin (LPS) for the measurements on MOMAC and the help for data analysis; Dimitrios Sakellariou (LSDRM) and Angelo Guiga (LSDRM) for their help in the NMR tomography measurements; Patrick Bonnaillie (SLIC) for the SEM measurements; Emanuelle Dubois (PHENIX) for her advice about the colloidal solution in the ionic liquids; Sanat Kumar (Columbia University) for his advice on the development of model and the DSC measurements.
I would like to thank all LLB members, who have always shown their openness to discussion and the availability to give a helping hand whenever needed. In par-ticular I would like to thank: José Teixeira for spending his time helping me with data interpretation and for introducing me to the small angle neutron scattering; Didier Lairez and Giulia Fadda for their help during voltage clamp and dynamic light scattering tests; Fabrice Cousin for his support in the SANS data reduction; Stéphane Longeville for his several explications concerning the neutrons spin-echo. Then I would like to thank all the students and postdocs for all the everyday life that we have shared and has been very nice: Philipp, Quentin, Marc-Antoine, Kuldeep, Nicolas, Adrien, Zineb, Antoine, Émilie, Maïva, Sumeyye, Eva, Alexan-dre, Yann, Simone, Albane, Mikkel and Grâce.
In conclusion I thank my family, my parents and Giulia for their continuous support and patience.
Introduction 9
Why this thesis? . . . 9
Ionic Liquids: a safe electrolyte, but not efficient enough . . . 9
A promising route for better conductivity: nanometric confinement . . . 10
Dimensionality: confinement of a molecular liquid in a solid matrix: from powders to nano-pipes . . . 11
1 Ionic liquids in the bulk state 17 1.1 Historical hints . . . 17
1.2 Self-organization at the mesoscale . . . 19
1.2.1 State of the art . . . 19
1.2.1.1 Ions ordering . . . 19
1.2.1.2 Self-organisation at the mesoscale . . . 20
1.2.2 Self-organization: a SANS analysis . . . 24
1.3 Dynamical properties of bulk ILs probed by QENS measurements . 28 1.3.1 State of the art . . . 28
1.3.1.1 ILs dynamic at the molecular scale . . . 28
1.3.1.2 Ion diffusion at the microscopic scale . . . 32
1.3.2 Experimental part . . . 34
1.3.2.1 Choice of experimental techniques . . . 34
1.3.2.2 The measurements . . . 35
1.3.2.2.1 The Time of Flight experiments on IN5 . 35 1.3.2.2.2 The Time of Flight experiments on LET . 36 1.3.2.2.3 The Backscattering measurements on IRIS 36 1.3.2.2.4 The neutron spin-echo measurements on IN11 . . . 36
1.3.3 Effects of the cation-anion couple on ILs dynamics . . . 39
1.3.4 Study of the cationic diffusion OMIM-BF4 at the molecular scale: a phenomenological approach . . . 41
1.3.5 Characterization of the cationic dynamics at the molecular scale using a combination of QENS techniques: the case of
the OMIM-BF4 . . . 49
1.3.5.1 Point of the departure: the dynamics at the pi-coseconds scale probed by ToF spectroscopy . . . . 49
1.3.5.2 A new multi-components model . . . 49
1.3.5.2.1 Modelling of the cation diffusion: the gen-eralised Gaussian model . . . 51
1.3.5.2.2 Modelling the molecular re-orientation. . . 55
1.3.5.2.3 The total dynamical structure factor . . . 56
1.3.5.3 Analysis procedure . . . 57
1.3.5.4 Results and discussion . . . 60
1.3.5.4.1 Re-orientation dynamics . . . 60
1.3.5.4.2 Diffusion inside the aggregate . . . 63
1.3.5.4.3 Long range diffusion . . . 64
1.3.6 Test of model robustness with the selective deuteration: the case of the BMIM-TFSI . . . 66
1.3.6.1 Re-orientation dynamics . . . 67
1.3.6.2 Diffusion inside the aggregate . . . 68
1.3.6.3 Long range diffusion . . . 70
1.3.7 Conclusions and comparison with the previous results . . . . 70
2 Properties of the ionic liquids confined in anodic aluminium oxide membranes 75 2.1 State of the art on the ILs confinement: the ionogels . . . 76
2.2 The porous anodic aluminium oxide membranes . . . 77
2.2.1 The AAO synthesis . . . 77
2.2.2 The AAO morphology . . . 79
2.2.3 Choice and preparation of the sample . . . 80
2.2.4 Check of the IL confinement by contrast variation . . . 81
2.3 ILs under confinement: thermodynamical aspects . . . 85
2.3.1 A brief introduction about the ILs thermodynamical properties 85 2.3.1.1 Bulk IL phase diagram . . . 85
2.3.1.2 Confinement effects on the ILs phase transition . . 86
2.3.2 The case of the confined BMIM-TFSI: a DSC study . . . 86
2.3.2.1 A double glass transition in the confined state . . . 88
2.3.2.2 Crystallisation temperature . . . 90
2.3.2.3 Melting point depression . . . 91
2.4 Confinement effect on the IL self-organisation behaviour by WAXS 93 2.4.1 Introduction: Surface effects . . . 93
2.4.2 Experimental part . . . 95
2.4.3 The liquid structure factor determination . . . 97
2.4.4 Phenomenological analysis . . . 99
2.4.5 Conclusion . . . 102
2.5 Confinement effect on the ILs dynamics at molecular level . . . 103
2.5.1 Confinement effects on the ILs dynamics in the literature . . 103
2.5.2 Experimental part . . . 104
2.5.3 Characterization of the confined IL dynamical behaviour . . 105
2.5.3.1 Long range diffusion . . . 105
2.5.3.1.1 NSE vs BS scenarios . . . 106
2.5.3.1.2 Results . . . 110
2.5.3.2 Diffusion inside the aggregate . . . 110
2.5.3.3 The re-orientation dynamics . . . 113
2.5.4 Conclusions . . . 115
2.6 The IL leaks: a NMR 1D tomography study . . . 116
2.6.1 The NMR 1-D tomography . . . 116
2.6.1.1 The basis of the NMR tomography . . . 116
2.6.1.2 The instrument and its calibration . . . 117
2.6.2 Results . . . 118
3 Properties of the ionic liquids confined in carbon nanotubes mem-branes 121 3.1 Sample preparation . . . 122
3.1.1 What are carbon nanotubes? . . . 122
3.1.2 Experimental protocol for the CNTs membranes production 123 3.1.2.1 Carbon nanotubes synthesis . . . 124
3.1.2.2 The membrane formation . . . 124
3.1.2.3 The membrane opening . . . 125
3.1.3 Membrane filling . . . 125
3.2 Dynamical effect of the confinement . . . 125
3.2.1 Cationic dynamics at molecular scale probed by QENS . . . 126
3.2.2 Ionic conductivity probed by impedance spectroscopy . . . . 130
3.2.3 Ions dynamics probed by NMR spectroscopy . . . 132
Conclusions and perspective 141 A The neutron scattering theory (from [1, 2]) 143 A.1 Fundamental quantities in a scattering experiment . . . 143
A.2 Van Hove formalism . . . 147 A.3 Single particle dynamics probed by incoherent quasi-elastic scattering149 A.4 Quasi-elastic neutron scattering analysis: model for the atomic motion151
A.4.1 Translational motion model . . . 152
A.4.1.1 Free diffusion model (Fick’s law) . . . 152
A.4.1.2 Jump diffusion model . . . 153
A.4.2 Rotation motion models . . . 153
A.4.2.1 Jump model between two equivalent sites . . . 153
A.4.2.2 Jump model between three equivalent sites . . . 155
B Time of flight technique 157 B.1 ToF spectrometer . . . 157
B.2 Direct geometry ToF spectrometer . . . 158
C Neutron spin-echo spectroscopy (from [3]) 163 C.1 The spin dynamics in a magnetic field . . . 164
C.2 The spin-echo principle . . . 164
C.3 The transmission of a analyser . . . 166
C.4 Determination of the beam polarisation from a spin-echo measure . 167 C.5 The case of quasi-elastic neutron scattering measure . . . 169
D Ion pairs and the concept of ionicity 173 E ILs applications 177 E.1 ILs as green solvents . . . 177
E.2 Energy management by electrochemical devices . . . 179
Energy management by electrochemical devices . . . 179
F Résumé en français 181
Why this thesis?
Batteries designed for hybrid electric vehicles should be able to provide both high energy and power densities. In comparison to other electrochemical storage sys-tems Lithium (Li)-ion batteries are known to deliver very high energy densities (150 Wh/kg). This property is associated with faradic reactions that take place within the volume of active grains by simultaneous ions and electrons uptake/removal. However, the amplitude of such reactions being large with respect to the amount of ions available in the porosity of electrodes, power performance (1-3 kW/kg) are usually frustrated by slow ionic “refuelling” from the electrolyte. The opposite holds for supercapacitors that provide relatively high power densities (10 kW/kg) at the expense of energy (5 Wh/kg) because storing reactions (capacitive ions ad-sorption and pseudocapacitive surface redox reactions) are confined to the surface. Accordingly, a gap appears in the Ragone Power/Energy plot because no system fulfils both power and energy requirements (Figure 1).
To fill this gap (shown in red on Figure 1), constant and regular progresses are obtained by improving the capabilities of each elements of the battery: chemical composition and structure of the positive and negative electrodes, nature of the electrolytes. But these incremental step by step improvements of the order of 10% each time are far from being able to challenge the logarithmic scale gap shown in red on the Ragone plot Figure 1.
The ambition of this thesis is to identify a possible route for a gain of one order of magnitude in the instant power of lithium batteries.
Ionic Liquids: a safe electrolyte, but not efficient enough
Ionic Liquids (ILs) are organic cations based molten salts, with a melting points below 100◦C. Thanks to their unique properties these liquids seem to be very promising for a wide applications set, which stretches from the catalysis to the electro-chemistry, involving very current topics such as nuclear fuel recycling and energy storage. Among all their particular features, ILs show a broad
Figure 1: This so-called Ragone plot compares the performance of electro-chemical devices. While capacitors can deliver high power, their storage capacity is very limited. At the opposite, Fuel Cells can store large amounts of energy but offer low power output. The diagonal solid black lines on the plot indicate the relative time to charge/discharge of generic devices. The dynamic performances of capac-itors and fuel cells/lithium batteries are opposite. Increasing the power of lithium batteries is a major challenge of modern applied electrochemistry. From USDLA and http://www.mpoweruk.com
chemical window and nearly null volatility and flammability, which make them very promising as electrolytes in electrochemical devices such as lithium accumu-lators.
As evidenced by a pre-peak measured by X-rays diffraction in the 0.2-0.4 Å−1 region (Fig.2) [4], most of ILs are characterized by a nanometric structuration. As it generates density fluctuations within the liquid that reduces the ionic mobility, this propensity to self-assembly in transient nanoscopic domains represents an unfavourable condition for the ionic conductivity.
A promising route for better conductivity: nanometric
con-finement
In numerous real life situations, molecular systems are not found in bulk but instead trapped in limited volumes of nanometric size: this is nanometric confine-ment. The complex interplay of the confinement topology, dimensionality (3D to 1D) and surface/volume ratio significantly affects the physical properties of the
Figure 2: In the left: Example of the pre-peak measured by X-rays diffraction on 1-alkyl-3-methyl imidazolium chloride. In the insert example of an IL cation/anion couple. The index n mark the number of CH2 composing the cationic side
alkyl-chain. This figure is modified by the references [4] and [5]. In the right: molecular dynamics snapshots (size of the box 6*6*6 nm3) of the nanometric structuration of the OMIM-PF6 inducing the prepeak in the structure factor shown in the left
(after [6]).
confined material. Water confined inside a 1.4 nm diameter CNT is a perfect ex-ample of the unexpected effect induced by nanometric confinement. As shown by Kolesnikov et al. [7] such a strong confinement drives a very specific organization of the water molecules. As a consequence, at the macroscopic scale, when forced inside a CNT membrane, water is found to flow-up three orders of magnitude faster than predicted by the continuum hydrodynamics picture [8].
A recent patch-clamp study has demonstrated that an IL confined in a nano-metric pore ( ≈ 20 nm) shows an ionic conductivity one order of magnitude higher than its bulk analogue [9]. Depending on the ionic liquid, the transport of charge carriers is strongly facilitated or jammed. This higher conductivity is ascribed to a cooperative effect of ions motions in confined geometry. These re-sults suggest that the confinement in a space whose dimension is comparable to the size of the characteristic fluctuation of the systems, could induce considerable changes in the IL transport properties. Confinement therefore seems to be a route to significantly increase the ionic conductivity of IL.
Confinement of ionic liquids within nano-pipes
Confinement of molecular liquids is a notorious way to obtain thermodynamical deviations from the regular bulk properties. It can for example be used to tune
Figure 3: Real samples showing both nanometric porous structure and macroscopic orientation. Left) Anodic Aluminum Oxide (AAO) membrane. The parallel pore network starting on the top and going down the bulk of the membrane is clearly vis-ible. Right) Carbon NanoTube (CNT) forest produced at LITEN/DTNM/LCRE. While AAO samples naturally come as membranes, specific treatments of the CNT forest is needed to turn them in CNT membranes.
very significant temperature depression of the melting point. It is nevertheless important to keep in mind that such thermodynamic upheavals are only the direct visible consequences of significant structural changes that, in turn, induce specific dynamical behaviours.
Even in the recent past, confinement was achieved in media with no macro-scopic orientation: "powders" in the crystallographic sense of this word. This had two consequences when probing the physical properties of confined fluids:
• first, all the retrieved structural and dynamical information was blurred by isotropic average: key points like for example the relative directions of the motion of a molecule by respect to the pore (radial or longitudinal) are basically lost.
• at a second level, the tortuosity (imposed by the pore morphology and/or the random spatial arrangement of the powder grains) was making it extremely challenging to link the local (few Å or nm) transport properties, like the self-diffusion coefficient, to the macroscopic transport flow of the material. But, following recent progress in inorganic chemistry, porous media with pores showing macroscopic orientation are now available (Figure 3). Such nano-pipes made of oriented tens of micrometer-long pores with diameters down to 1-10 nm have come to reality. Lifting the "powder average" limitation can therefore be easily achieved by orienting the porous sample in a measuring device (confocal
Figure 4: A) Sketch of lithium battery using an IL as electrolyte. The self-organisation produces the density fluctuations (shown on the right), which re-duce the ionic mobility. B) Sketch of lithium battery using a confined IL as elec-trolyte. In this case the liquid confined in a porous matrix, whose pores show a 1D anisotropy along a direction perpendicular to the electrodes. In the confined state we expect that the self-organisation could be reduced and the ionic motion enhanced along the pores axis.
microscope, spectrometers: NMR, IR, Neutron. . . ). It is then relatively easy to firmly disentangle dynamical phenomena in the parallel or radial direction to the pore axis. We argue below that taking advantage of the enhanced flow in one dimension has a prime technological relevance.
On this basis, the goal of this work is the study of the 1D nanometric confine-ment effect on the ionic liquids transport properties. Our idea is to frustrate the formation of the IL nanometric domains using confinement within macroscopically oriented controlled porous structure membranes.
As confinement matrix, we have used Anodised Aluminium Oxide (AAO) porous membranes. In this systems it is possible to tune the pores size between 20 and 300 nm, without modifying the matrix topology. This enables to develop a study of the ILs properties as a function of the confinement size. On decreasing the
pore size, we expect that the pre-peak will vanish and therefore i) to be able to esti-mate the characteristic size of the IL domains ii) to develop a full characterization of the confined “desegregated” IL transport properties.
As it imposes a ionic diffusion alongside a preferential direction, the use con-finement space with an axial anisotropy (1D concon-finement) could give a further benefit to the ion conductivity, and could represent a remarkable benefit for the ILs use in batteries (see figure 4).
Nevertheless, 10 nm is the minimal pore diameter achievable with AAO. This confining material therefore does not allow to probe confinement size under severe confinement conditions i.e. of the order of the size of few IL molecules. Moreover the AAO pores surface are covered by hydroxyl groups which can interact with the liquid ions and induce detrimental surface effects. These limitations are easily overtaken by the carbon nanotubes (CNTs), which have diameter of few nm and smooth and inert walls. This feature allows to observe the effects due to the tight confinement with limited interaction with the confining surface.
This manuscript is composed of three chapters. In the first one we propose a study on the ionic liquids bulk properties. The goal of this section is to under-stand the implication of the self-organisation in the liquids dynamical properties. For this purpose we have divided this analysis in two section. The first one consists in a diffraction study performed in order to quantify the degree of the organisation of the liquids and the main parameters which characterize this phenomenon. The second is related to the dynamical features of these systems. In this study we demonstrate the limit of a classical phenomenological analysis, and we develop a multiscale approach([ 1 ps-2000 ps] and [0.1 Å−1 -3 Å−1]) based on several Quasi Elastic Neutron Scattering (QENS) techniques. This physical appealing model can both qualitatively and quantitatively describe the role of the self-organisation on the dynamical quantities. The robustness of this model is confirmed by QENS ex-periments on a specifically deuterated sample. An achievement of this new analysis is to be able to disantangle the complex dynamic interplay of the cation side-chains to assess the pure long range translational diffusion coefficient of the cation center of mass. This is a critical quantity as, through the Nernst-Einstein relation, it drives the key information at stake for batteries electrolytes: ionic conductivity. This original model of the IL dynamics at the local scale (few nm and ns) is then used to probe the dynamics of IL under confinement, first in AAO membranes (large pores and strong surface effects), then in CNT membranes (narrow pores and no or limited surface effects).
The second chapter of this manuscript focuses on the ionic liquids properties when they are confined in alumina membranes. A first part is dedicated to the AAO confinement effects on phase transition temperatures. The goal of this section
is to demonstrate the importance of both the surface effects and the pores size for determination of the thermophysical properties of these systems. The most important part of this study is however dedicated to the confined liquids prop-erties at the molecular level. The main goals of this analysis is to quantify the confinement effects on the liquids self-organisation and the impact of the eventual structural modifications on the dynamical properties. By a diffraction study we develop a quantitative analysis of the changes induced by the confinement on the self-organisation. We show also that our model of the IL dynamics holds under AAO confinement.
In a third chapter, we then use the model that we have developed to discrim-inate the radial and the axial dynamics of IL in macroscopically oriented narrow pores of CNT membranes. We extend this analysis by PFG-NMR and impedance spectroscopy measurements to probe the transport properties at the mesoscopic scale (µm and ms).
Ionic liquids in the bulk state
This chapter is dedicated to the study of the bulk ILs properties. It is a first fundamental step for the understanding of the confinement effects observed in the different systems overviewed in this work.
The first part of this section is about the ILs self-organization behaviour. We will show how the cation hydrocarbon chain length plays a key role in the formation of the structural heterogeneities.
In the second part of this chapter we will focus on the liquids dynamics. The goal of this part is to demonstrate the influence of the self-organization on the ionic dynamics. For this purpose we choose to use the quasi-elastic neutrons scattering (QENS) for studying the liquids dynamics at the molecular the scale. We will begin to analyse the experimental data using firstly a phenomenological model and then we will develop a more accurate multi-scale approach. At the end of this section we will show the coherence between the obtained results by this approach and those observed by the study of the structural ILs properties.
1.1
Historical hints
The origin of ILs dates back to the beginning of 20th century. The first IL was
discovered by Walden in 1914, with his study on ethylammonium nitrate formed by the neutralisation of ethylamine with nitric acid [10]. In this report Walden defines this liquid as: "an organic molten salt with a melting point lower than 100◦C". This first definition survived in the years and it has become the classical definition of IL which is still used nowadays. Another important feature, highlighted by the author in this report, is the presence in the liquid of an "ions association" which is, even now, a topic of debate.
The Walden’s results defined thus the basis for the development of new class of materials. Before the ILs discovery, the study of molten salts was limited by the
necessity of very high temperatures for reaching the compound melting point (mp) (e.g. for the NaCl the mp is around 804◦ C). With the ILs advent this condition is no more necessary, because it is possible to work at relatively low temperatures for obtaining the salt melting. This first discovery gave the access to a new kind of compounds which show some unique properties. The ILs are systems in the liquid phase composed at 100% by charged elements. These particular properties aroused the interest of the international community, who began soon to perform several studies about the features and the possible application fields of these salts. The first ILs based application was found in the 1930s. In 1934 an US patent demonstrated that these liquids can be used for treating the cellulose [11]. It has been shown that ILs can break the cellulose molecules and reducing this bio-polymer in a more reactive form, that can be used later in other chemical reactions. From this first discovery, the use of IL for the cellulose dissolving processes was more and more improved and, nowadays, these liquids are still used in several industrial applications concerning the cellulose treatment [11].
The other field, where ILs seemed to be very promising, was that of the elec-trochemical applications. Their intrinsic ionic nature made these compounds very good candidates for being used as liquid electrolytes in electrochemical devices, such as the batteries. However, for developing this topic, it has been neces-sary to obtain compounds with mp below the room temperature. An intensive work was thus performed during the second half of 20th century, in order to
syn-thesise new salts which were liquid at room temperature (called room tempera-ture ionic liquids (RTILs)). A first approach was tried using mixtempera-ture aluminium chloride salts with different cation such as 1-butylpyridinium [12] and 1-alkyl-3-methylimidazolium [13]. These methods produced ILs which have mp below 0◦C under some specific conditions. However the stability of liquids showed a great sensitivity to environment moisture. This represented a big limit in the ILs appli-cation because it obliged to work in the inert atmosphere box.
The big change in the ILs field was achieved with the advent of the "air and water stable ILs" [14]. With this discovery the ILs became finally a kind of system which was easy to handle. This generates an increase of interest from the inter-national community who began to invest big amount of energy and money on the study of the properties of these salts. An effect of this interest growth is shown in figure 1.1, which shows the exponential boost of patents and publications about ILs in these last years.
The increase of the results about ILs causes also an augmentation of the amount of ILs easily available. For giving an example, in 2007 it was estimated there are at least 1 million of ILs which can be synthesised [11]. This number can give the idea about the increasing interest on ILs that, in the last twenty years, has captured the attention of the scientific and industrial communities.
Figure 1.1: Left: number of the published papers about ILs between the 1990 and 2014. The research was done searching the words "ionic liquids" in the web of knowledge data bases. Right: number of the filed patents about ILs between the 1990 and 2014 (for courtesy of Marco Campani). The values was obtained by the data bases "patent scope" and "espacenet". In both cases we can observe an exponential growth of the scientific production.
1.2
Self-organization at the mesoscale
1.2.1
State of the art
1.2.1.1 Ions ordering
One of the crucial features about ILs is the ions arrangement inside the liquid. It is known that in the liquid state it is impossible to observe an extended order as in the crystalline phase, however we will show that the electrostatic interaction between the ions can influence the ions disposition at local scale (few Å).
The first study in this context was performed on 1,3-dimethylimidazolium chlo-ride (DMIM-Cl) [15]. In this work it was measured the neutron diffraction pattern of the protonated and deuterated liquid in order to extract the pair correlation functions (g(r)) of the couple cation-anion and cation-cation. An example of the obtained pair correlation functions is shown in figure 1.2.
From this plot we can notice that, both pair correlation functions show an oscillating trend with at least two principle maxima. At each peak corresponds thus the presence of ions shell which is formed around the cation. The shift of the two g(r)s maxima shows, furthermore, that two shells of the same ion are separated by another one composed by the other ionic specie. However the diminution of the peaks intensity with the increase of the distance demonstrates that this correlation has a limited range of few Å.
anions such as hexafluorophosphate (PF6) [16] and bis(trifluoromethyl)sulfonylamide
(TFSI) [17], suggesting that this ordering is common for all ILs. Moreover it was also observed an expansions of the ions packing proportional to anions size which seems to increase of the number of anions populating the first shell [17].
1.2.1.2 Self-organisation at the mesoscale
Another particular feature about the ILs structural properties is their self-organisation at the nanometer length scale.
In the ILs cation has a general complex structure composed by a polar (the charged zone) and a-polar (the alkyl-chain(s)) part. This complexity generates thus the presence of multiple intermolecular interactions which differentiates the ILs from the simple inorganic salts. In these latter the only interaction between the ions is due to electrostatic force. In the ILs, instead, the presence of the a-polar moieties introduces in these systems other interactions such as Van de Waals and inductive interactions which contrast the Coulomb forces between the charges. This complex interplay generates thus a sort of segregation at the nanoscopic scale between the polar and a-polar part of the liquid.
One of the first studies which pointed out this aspect was the molecular
dy-Figure 1.2: Pair correlation function of the cation (solid line) and cation-anion distribution (circles+lines) obtained from the neutron diffraction data on DMIM-Cl. In the insert the cation-anion couple is shown. This picture is taken by the reference [15].
Figure 1.3: Left part: Frame (a) ionic couple explaining the color code used during the MD simulation: green part represents the a-polar tail of the cation while the red one refers to the charged parts of the system (the imidazolium heads+the anions). Frame (b-f) snapshots of the simulation boxes of the different simulated liquids, the box size is in the parentheses :the C2MIM-PF6 (b), the C4MIM-PF6 (lbox=49.8 Å)
(c), the C6MIM-PF6 (lbox=52.8 Å) (d), the C8MIM-PF6 (lbox=54.8 Å) (e) and the
C12MIM-PF6 (lbox=59.1 Å) (f). Right part: topology of the a-polar domains for
the C2MIM-PF6(left), C4MIM-PF6 (middle) and the C6MIM-PF6(right). We can
notice that when the chains grow the a-polar domains size increases and they begin to form a sort of continuous phase. This picture is modified by the reference [6].
namics (MD) approach of Padua et al. [6]. In this work the authors studied the structural organisation of the ILs CnMIM-PF6 series using the force field MD
technique. The results of their analysis are summarized in figure 1.3.
Let’s begin to consider the left part of this figure. The color code is explained in the frame (a), where it is shown an example of ionic couple considered in this study. The green spots represent the a-polar tails of the cations whereas the red ones refer to the charged parts of the system (i.e. the imidazolium heads+the anions). The other frames show instead the snapshots of the simulation boxes of the different studied liquids in this work: the C2MIM-PF6 (b), the C4MIM-PF6
(c), the C6MIM-PF6 (d), the C8MIM-PF6 (e) and the C12MIM-PF6 (f). If we
a 3D polar network surrounded by a-polar domains formed by the cations tails. If we consider the simulation boxes dimension (reported in the figure 1.3 caption) we can ascertain that these domains have a nanometric size. Furthermore we can also notice that the liquid structure changes as a function of the chain length. For the ILs with short cationic tails the charged network shows a good continuity in the space, which is locally interrupted by the presence of the a-polar domains. On the other hand, when the chains grow, we can observe that the charge symmetry is always more and more disrupted as the a-polar domains raise. They begin to be a continuous phase forming a sort of "Bicontinuous microphase" for very long chains. For a better clarity, the growth of tails domains in function of the chain length is highlighted in the right part of figure 1.3 where it is shown that for long chains the domains are interconnected and they forms a spongelike structure.
From the MD simulations Padua et al. calculated the ILs structure factor, predicting the presence of a peak in the Q region, between 0.2 and 0.5 Å−1, due to distance between two polar (or a-polar) zones [6].
The first experimental evidence of the ILs self-organisation was produced by
Triolo and co-workers [4]. In their work the authors measured by small
an-gle X-ray scattering (SAXS) the structure factor of two ILs series: the alkyl-imidazolium tetrafluoroborate CnMIM-BF4 and the alkyl-imidazolium chloride
CnMIM-Cl. From these measurements it was shown the existence of the first
sharp diffraction peak (FSDP) at low Q region as it was predicted by Padua’s simulations (see example in figure 1.4). Due to it particular position, which is for wave vector values much smaller than those of the classic liquids FSDP, this peak was called pre-peak. This name was then used in literature as the typical name for defining this self-organisation signature.
In this study Triolo’s and al. defined thus an IL self-organisation correlation length associated to the pre-peak position by the simple relation L= 2π/QP. It was
demonstrated that this latter shows a linear relation with the alkyl-chain length [4] (see insert Fig.1.4). This result confirmed thus the Padua’s theory of the a-polar tails segregation. Furthermore, it was also observed the liquid organisation is strongly temperature dependent, suggesting that the IL ordering is perturbed by the ions dynamics [4].
After the Triolo’s group analysis, several studies, based on diffraction tech-niques, were performed on other different imadazolium based ILs having bigger anions such as the PF6 [18], or the TFSI [19, 20] and even on ILs having
differ-ent cations [21], confirming the presence of the ILs self-organisation. It was also observed that in the case of cation with very long chain (more than twelve CH2
groups) the IL shows a more ordered organisation consisting in a smectic phase at room temperature [5, 22].
proper-Figure 1.4: Diffraction patterns of Cnmim-Cl with n=3,4,...,10 at room
tempera-ture. We can observe the pre-peak appearance at n=4 indicating a correlation at the nanometer scale. In the insert the plot of correlation length L, calculated as L= 2π/QP (QP is the postion of the pre-peak), in function of the cation
alkyl-chain length for the Cnmim-Cl (circles) and Cnmim-BF4 (squares). This picture
is taken by the reference [4].
ties are influenced also by the cation symmetry [23].
In parallel of these experimental works, the Padua’s MD approach was re-claimed and applied on other systems [24–26] in order to complement the infor-mation given by the diffraction measurements. The recent work of Annapureddy at al. has finally demonstrated that the pre-peak position is related to the typi-cal distance between two adjacent cations charged heads separated by an apolar domain [25].
In conclusion a consensus seems to emerge about the existence of a common ILs self-organisation due to the segregation of the a-polar tails. However there is still an open debate about the morphology of this ordering. These days we have no proof of experimental or simulation technique which could affirm definitely which shape is adopted by the ions aggregates. For the moment there are some different theories, which suppose different possible morphologies. Some authors affirm that the segregation is just a deformation of the solvatation shell due to the asymmetric shape of the cation [27], while others propose that the self-organisation acquires some specific morphology such as alkyl-chains channels [6], micelle [18] or lamellar structure [28] (see figure 1.5).
Figure 1.5: Various examples of possible IL self-organisation morphologies. From left to right: alkyl-chain channel (the green parts are the tails domains while the empty ones are polar zones), the micelle like and the lamellar structure. This picture is taken by the references [6] and [28].
1.2.2
Self-organization: a SANS analysis
The goal of this section is the study of this particular property especially in relation with the couple cation-anion present in the liquid. The purpose of this analysis is to demonstrate that the key-parameter driving the structuration is the length of the cation a-polar alkyl-chain.
In fact in the ILs the ions electrostatic interactions are in competition with the attractive Van der Waals forces between the cationic a-polar parts. When the alkyl-chain is long enough (i.e. for four or more methanediyl groups [4]) the interplay between these interactions produces an organisation at the nanoscale of the ILs ions. Molecular dynamics simulations show that the charged parts of the ions (i.e. the anions and polar head of cations) organise them-selves in nano-aggregates which are surrounded by a-polar network constituted by the cationic alkyl-chains (see Fig.1.6A) [6]. It was shown that this segregation is sharper with longer chain owing to the augmentation of the Van der Waals forces. This organisation produces a peak in the ILs structure factor in the low Q region (between 0.2 and 0.5 Å−1). This so-called "pre-peak" has been observed experimentally on different ILs [4, 20, 28] (Fig.1.6B). It was shown that the position of the peak (QP) is defined by the
relation [18]:
QP =
2π LD
(1.1) where LD is the distance between the center of mass (c.o.m.) of two
aggre-gates (see the set of the Fig.1.6B). Thus measuring the structure factor of these liquids, we can observe directly the physical signature of the ILs organisation at the nanoscale.
technique to assess the structural organization of these systems. This technique measures the elastic scattering intensity of a monochromatic neutrons beam oc-curring at small scattering angles. This allows to determine the static correlation of the sample, taking place at distance much longer than the typical interatomic distance.
Figure 1.6: A) Simulation box taken by the reference [6], which shows the self-organization in the IL OMIM-P F6 (adapted by the references [6, 29]). The red
parts represent the charged part of ions (anions and imidazole head), while the green ones are constituted by the a-polar cationic alkyl-chains. B) Structure factor measured on different CnM IM −P F6 (adapted by the reference [18]). We can note
that for long alkyl chain we can distinguish the pre-peak due to self-organization. The inset explains how the pre-peak position QP is linked to the distance between
two aggregates c.o.m. LD (adapted by the reference [28]).
In our study, in order to decorrelate the effects of the cation and of the anion on the ILs self-organization we have chosen four samples of molten salts with different couples of ions:
• 1-Butyl-3-methylimidazolium bis(trifluoromethanesulfonyl)imide (BMIM-TFSI), • 1-Methyl-3-octylimidazolium bis(trifluoromethanesulfonyl)imide (OMIM-TFSI), • 1-Methyl-3-octylimidazolium tetrafluoroborate (OMIM-BF4),
Figure 1.7: Cations and anions couples studied by SANS. In the four cases we considered imidazolium based RTILs, with the two possible cations having two different hydrocarbon chain length.
• 1-Butyl-3-methylimidazolium tetrafluoroborate (BMIM-BF4).
All of these samples are imidazolium based RTILs. The cation (see Fig.1.7) is an organic molecule composed by a charged head of imidazole plus an a-polar alkyl-chain. In this work we have opted for two kinds of cation: one with a long alkyl-chain composed by eight CH2 groups (octyl-chain) and a second one with
a shorter chain composed by only four methanediyl groups (butyl-chain). On the other hand we have picked as counterion bis(trifluoromethanesulfonyl)imide (TFSI) and tetrafluoroborate (BF4), which have different sizes and properties.
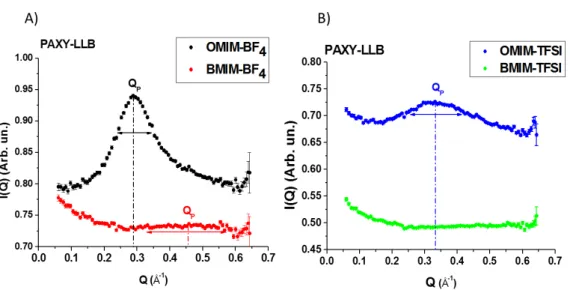
The SANS measurements were done on the spectrometer PAXY [30] of Léon Brillouin Laboratory (CEA-CNRS) of the C.E.A. of Saclay. Since we were inter-ested to determine the ILs correlation at the nanometer scale, we could narrow the observed Q range for values bigger than 0.1 Å−1.
In order to observe the Q range from 0.1 and 0.7 Å−1, each ILs spectrum was measured at room temperature with an incident wavelength λ =3.5 Å and a detector distance D=1.2 m.
The four ILs measured spectra, after an isotropic grouping, are shown in Figure 1.8A and 1.8B.
The first feature that we can observe comparing the spectra is that in the case of the OMIM based ILs the pre-peak is well defined. For the OMIM-BF4 and the
OMIM-TFSI we found a diffraction peak respectively nearby to 0.3 and 0.35 Å−1. These values correspond to a distance between two aggregates c.o.m. (equation 1.1) of around 2.1 nm for the OMIM-BF4 and of 1.8 nm for the OMIM-TFSI. On
Figure 1.8: Measured structure factor of the four samples: A) spectra of ILs with BF4 as anion, B) spectra of ILs with TFSI as anion. We can observe in the case of
OMIM based liquids the presence of well defined peak due to the self-organization, while for the BMIM ILs we can notice a broad structure for the BMIM-BF4. The
dotted lines point the values of the position of peak maximum QP, while the arrows
show the peak width. All of them are only eye guides.
is observable at Q=0.4 Å−1 for the BMIM-BF4 (LD ≈ 1.4 nm), while no peak
is detected for the BMIM-TFSI. Many works in literature, based on simulation or experimental measures, show the presence of a pre-peak for the BMIM based liquids [4, 6, 18, 20, 26], however cause of the low organisation of the liquid the pre-peak has a shoulder shape. This feature requires a very good experimental resolution for detecting it, condition that is not assured by a SANS spectrometer in this range of Q (δQQ ≈ 15%). In addition at high wave vector the contribution of incoherent scattering begins to be not negligible and it can affect the quality of signal. We can then suppose that in the case of the BMIM-TFSI the limitations of the experimental technique don’t allow to observe the peak. In conclusion this first comparison suggests that the cation side chains length is the key parameter for the formation of self-organization in the ILs. This result is coherent with the results present in the literature [4, 6, 20], where it was shown that the correlation peak tends to disappear with short alkyl-chains.
The other consideration that we can do is that the anion nature has no effect on the self-organization formation. We can notice, however, that it influences the features of the structural heterogeneities. In fact if we compare the pre-peak of OMIM-TFSI and OMIM-BF4, we can notice that it position and it width are
the average distance and the dispersion of the structural heterogeneities. This could be due to the difference of ion size or ion charge delocalisation between the TFSI and the BF4. It was shown by Yamamuro et al. [28], that for more compact
anion the peak doesn’t change shape, while for bigger ions, as the TFSI, it features are slightly modified. We can conclude then the anion size could modify lightly the correlation properties of the ILs.
1.3
Dynamical properties of bulk ILs probed by
QENS measurements
1.3.1
State of the art
When we try to characterize the elementary steps of the molecular motion in these systems, we find that the ionic dynamical behaviour is composed by a combination roto-translational relaxations [31]. The long alkyl-chain contributes in the dynam-ics of the cation introducing in the system dynamical spectrum all the moieties re-orientation dynamics. This feature makes very difficult to separate the part due the translational properties to the rest.
On other hand we can overcome this problem using techniques with spatial and temporal resolution larger than molecular ones, i.e. Rs 1 nm and Rt 1 ps. In
this way the re-orientation dynamics is no more visible, because it is constituted by very localised and fast motions, and we have directly access to the ions translational motion. However, with these techniques, we can no more observe the elementary steps of the ionic diffusion, but we obtain only a global information averaged on thousands elementary steps.
The goal of this section is thus to illustrate the state of art of these two different experimental approaches. We have divided our explanation in two parts.
In the first one we will focus on the existent studies of ILs dynamics at the molecular scale. Since in this thesis we will focus particularly our attention on this topic, this part we will more exhaustive in order to give the means for under-standing the studies developed in this work.
On other hand the second one is dedicated to the experimental approach which uses less resolute techniques for studying the ionic translational motion.
1.3.1.1 ILs dynamic at the molecular scale
One of the aptest experimental methods for probing the elementary steps of the ions motions is probably the quasi elastic neutron scattering (QENS). The tech-niques based on this process allow in fact to probe the sample dynamics at a very local scale (i.e. at the Ångström length scale and at the pico/nanosecond
time scale), giving simultaneously spatial and temporal information about the dy-namical relaxations occurring in the system. Due to the large incoherent neutron scattering cross-section of the 1H nucleus and the abundance of this element in
ILs, QENS techniques give a global view of the IL dynamics as sensed via the averaged individual motions of its hydrogen atoms. This means the information extracted from these measurements involves the cation dynamics.
One of the first approach which used QENS for probing the ILs dynamics was that of Triolo and co-workers [32]. In this work the authors studied the 1-n-butyl-3-methylimidazolium hexafluorophosphate (BMIM-PF6) dynamics in function of
the temperature. From this analysis they pointed out the existence of two different relaxations in the liquid dynamical spectrum occurring in time range between 0.4 and 25 ps. In was shown that the time dependence of the faster one, called β-relaxation, followed a classical Debye relaxation:
Iβ(t) ∝ e − t
τβ (1.2)
where τβ is of order of picosecond.
On the other hand it was observed that the slower one, defined as α-relaxation, showed a trend which was strongly non-exponential. The authors described it with the phenomenological Kohlrausch-Williams-Watts (KWW) function, which intro-duces the stretching parameter β (0 ≤ β ≤ 1) for describing the non-exponential behaviour: Iα(t) ∝ e−( t τα) β (1.3) where τα is the order of hundreds of picoseconds.
From this study Triolo’s group observed that typical time constants of the two relaxations show a different temperature and space dependence, as it is shown in figure 1.9.
For the β-relaxation it was observed that τβ changes weakly as a function of
the temperature and wave vector. This result was interpreted as the signature of a very localised motion with a very low energy activation, that authors defines as "motion inside a cage whose spatial extent is approximately 0.7 Å" [32].
On the other hand the α-process seemed to be strongly temperature depen-dent showing a non-Arrenhius behaviour, which is a typical feature of many glass-formers [32]. The non-exponential trend is thus explained by the authors as a reminiscence of a cooperativity typical of the glass phase. Furthermore the pres-ence of this latter together with the dispersive dependpres-ence of τα by Q, drove the
authors to suppose that this relaxation is the print of the cation diffusion inside the liquid.
The innovative results given by the Triolo’s group QENS study were thus the point of departure of several studies about the ILs dynamics.
Figure 1.9: Left: Plot of τβ and of the average τα measured at Q=2.0 Å−1 in
function of the temperature. In the inset the value of the stretching parameter β measured at the same configuration. Right: Plot of τβ and of the average τα
measured at T= 300 K in function of the wave vector Q. In the inset the value of the stretching parameter β measured at the same configuration. We can notice that τα seems to be weakly dependent on these parameters while τβ is strongly Q
and T dependent. These plots were taken by the reference [32].
It was necessary making light on some features which were not clarified by this first approach. For example one open question was the molecular origin of the localised motion. A later study of Triolo’s group justified the presence of this relaxation as the superimposition of multiple localised relaxations due to the cation re-orientation dynamics [33]. Similar excitations were observed by other more recent works [28, 34], underling the importance of the cation a-polar part in the cationic dynamics .
The origin of a localised motion was called into the question again with the discovery of the ILs self-organisation. Hu et al. showed by MD simulation that the BMIM-PF6 ions show an heterogeneous translational dynamics [35]. The results
of their simulations are summarized in figure 1.10, where is shown the cation mean squared displacement (MSD) at 400 K.
We can notice that the ion MSD shows three different regions: a ballistic behaviour (slope=2) for very short times (t< 1 ps), a plateau region (slope≈ 0) and a diffusional behaviour (slope=1) for a longer times (t> 100 ps). These results show then that the cations see the effect of cage, produced by the presence of other ions, during their translational motions which is at the same time range where it was observed the IL β-relaxation [32]. Furthermore the MD simulation demonstrated that the ions could be divided in two ensembles, where one seems to move slower than a classic diffusional (or Fickian) process and the other faster
Figure 1.10: Cation MSD in the liquid BMIM-PF6 at T=400 K determined by
MD simulation. We can distinguish three main trends as a function of the time. A ballistic one (slope=2) for sub-picoseconds times, followed by an intermediate region where the ion is a subjected to a cage effect (slope≈0) and a Fickian diffusion (slope=1) for the long times. This plot is taken from the reference [35].
and the two groups seem have a spatial correlation between them. These results pointed out so, that the translational motion in the ILs can not represents by a simple diffusive behaviour, but it is composed by different processes. Moreover the founded spatial correlation suggested that the dynamical behaviour seems to be influenced by the structural organisation of the systems.
These conclusions gave another push for developing more sophisticated ap-proaches for characterizing the ILs dynamics at the molecular level. Nowadays there are reports of numerous QENS studies, performed in order to characterize the re-orientational and translational contribution of the cation dynamics and the effect of self-organisation on the dynamical features of the ILs [28, 29, 34, 36–40].
Between them we want to cite the recent works of Embs and co-workers, which studied the dynamics of pyridinium based ILs by QENS [34, 38–40]. In these ref-erences the authors demonstrated that the cation diffusional motion is constituted by two main process, whose sketch is shown figure 1.11.
The first one is a fast diffusional motion, to which we can associate a self-diffusion coefficient called Dloc. This is a single particle excitation (i.e. each
hydrogen is decorrelated from the others), where each nucleus moves inside a confined space (of size 2σ), which could have different size in function of which hydrogen atoms we are considering.
On the other hand there are another diffusional process, much slower than the first one, at which we can associate a self-diffusion coefficient called Dtr. This
is, instead, a collective excitation which represents a global diffusion of the entire cation [38].
any-Figure 1.11: Sketch of cationic translational motion hypothesized by Embs et al. Each hydrogen nucleus (red sphere) has a rapid diffusion confined a space of size (2σ), at which a self-diffusion coefficient Dlocis associated. This consists of a single
particle relaxation so each hydrogen diffusion is decorrelated from the diffusion of the other atoms. On the other hand there is another slower diffusional process, with a self-diffusion coefficient Dtr, which consists of a translational motion of the
entire cation. This figure is taken from the reference [40].
thing but simple. Cause of the structural ion complexity the dynamical spectrum of these systems is a combination of the re-orientational and translation motion. Furthermore this latter seems to be influenced to the liquid self-organisation and it shows a spatial heterogeneity.
1.3.1.2 Ion diffusion at the microscopic scale
As we have already mentioned at the beginning of this section, it is possible to observe the translational motion with techniques which have lower resolution. The most used is the Pulsed Field Gradient Nuclear Magnetic Resonance (PFG-NMR). This technique has typical resolution of about 100 nm as length scale and 1 ms as time scale. This implies that we can’t observe the elementary motion of ions (occurring at length of few Å and times of few ps), because the re-orientation contribution of molecules moieties is no more in the observed dynamical range, then we have directly access to the diffusional dynamics of ions. Another advantage of the NMR techniques is the possibility to choose the atomic specie to probe. This allows then to observe the diffusion of the cation and anion which is not possible with QENS on the hydrogenated samples.
In this context the most complete study on the ILs dynamical properties is that of Tokuda et al. [41–43]. In these references the authors measured the self-diffusion coefficient of different families of ILs.
In particular they coupled the macroscopic measure of liquid viscosity with the value of the self-diffusion coefficient. From this comparison they discovered
Figure 1.12: (a) Cation self-diffusion coefficient of different ILs as a function the variable T/η measured by PFG-NMR. The symbols are the experimental data while the solid lines are fit using the Stokes-Einstein equation (eq.1.4).(b) Cation self-diffusion coefficient of different ILs as a function of the temperature measured by PFG-NMR. The symbols are the experimental data while the solid lines are fit using the Vogel-Fulcher-Tammann equation (eq.1.5). These plots are taken from the reference [41].
the self-diffusion coefficient follows the Stokes-Einstein equation [41, 42] (see figure 1.12 A):
D = kBT
πXηr (1.4)
where kB is Boltzmann constant, T is the liquid temperature, η it viscosity, r
the ion hydrodynamic radius and X a factor included between 4 and 6 which takes in account the hydrodynamic boundary condition between the ion and the rest of the medium.
The other important results coming from this analysis is the relation between the self-diffusion coefficient and the liquid temperature. In fact the trend of this quantity, in the ILs, doesn’t follow the classic exponential Arrhenius behaviour, but it can be described by the Vogel-Fulcher-Tammann (VFT) equation (see figure 1.12 B):
D = D0e − B
T −T0 (1.5)
The parameter T0 in the equation 1.5 represents the temperature at which the
self-diffusion coefficient is null. It was observed that experimentally T0 is 30-60
K below the glass temperature (Tg) measured by calorimetry [31]. We can then
conclude that the dynamical properties of the ILs are influenced by the glass prop-erties of the system. These results seem to be consistent with the non-exponential behaviour observed at the molecular length scale.
1.3.2
Experimental part
1.3.2.1 Choice of experimental techniques
For determining the correlation between the self-organisation and the ILs dynam-ics, we need to probe a very local scale. For this purpose we opted for the quasi-elastic neutrons scattering (QENS) techniques because they allow to observe, at the same time, the dynamics in function of time and space at the molecular scale (i.e. spatial range 1-10 Å and time range 1-1000 ps).
For a more deepened explanation of theory neutrons scattering we refer the reader to the appendix A. In this section we will only show the basic concepts of neutron scattering spectroscopy and explain the reasons that why we choose these techniques.
The methods based on the inelastic neutron scattering are spectroscopic tech-niques which measure the change of energy and momentum of a neutrons beam after its interaction with the sample. These particles are particularly good probes because they have no electric charge, thus they interact directly with the sample nuclei and they have a penetration length deeper than X-rays. Moreover their wavelength is particularly appropriate for studying the condensed matter, because it has the same order of magnitude of the inter-atomic distance. Furthermore the neutrons kinetic energy are near the those of typical molecular excitations; this makes them very good candidates for studying the condensed matter dynamics.
Especially the QENS is a very apt method for this genre of analysis because it allows to observe the dynamical events which occur at very low energies such as the self-diffusion or the molecular re-orientation.
In this work we selected three different QENS techniques: • the time of flight (ToF),
• the neutron back-scattering (BS), • the neutrons spin-echo (NSE).
The length and the time scale and the relative experimental resolution of the three techniques are shown in Table 1.1.
The ToF and the BS probe a faster dynamics occurring at a time scale between 0.1 and tens of ps. These methods allow to observe the faster dynamical mode such as the molecular orientations.
On the other hand the NSE can probe slower dynamics because it observes characteristic times included between 10 ps and 1 ns.
With these techniques, especially in the ToF and BS case, we can observe prac-tically only the incoherent contribution coming from the hydrogen because it has
Technique Time range (ps) Length range (Å) Energy Resolution (µeV)
ToF 0.1- 10 4 - 125 81
BS 1 - 30 6 - 13 17.5
NSE 10 - 1000 6 - 21 0.001
Table 1.1: Probed ranges and experimental resolution of the QENS techniques used in the study of ILs dynamics
an incoherent scattering cross section which is much bigger than other scattering cross section of other elements in the samples [44]. This implies that we could determine only the self-part of van Hove correlation function, so we could probe only the individual part of hydrogen nuclei dynamics [45]. Moreover since the hydrogen is present only in the cation, with the QENS techniques we could obtain information only about the cationic dynamics.
1.3.2.2 The measurements
The goal of this section is the description of experimental part performed for the study of the ILs dynamics. For an accurate explication of the QENS techniques we refer the reader to the appendix B and C. In this part we will focus on the description of the instrument configurations and the basic treatment of the raw data adopted for each measurements.
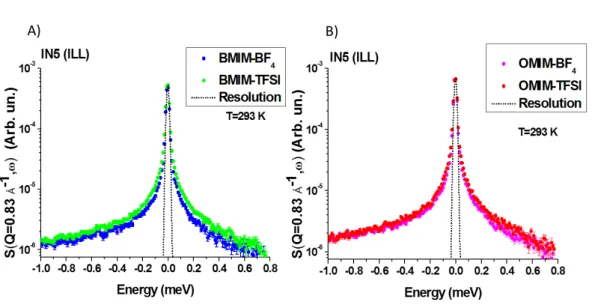
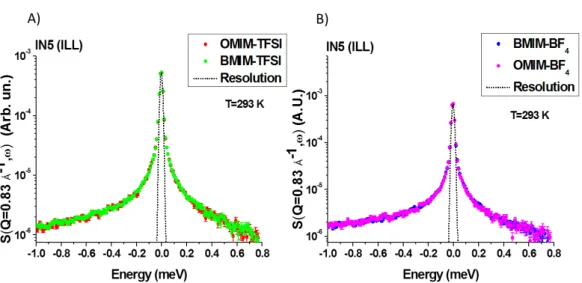
1.3.2.2.1 The Time of Flight experiments on IN5
Part of the ToF measurement were performed on the spectrometer IN5B (ILL-Grenoble) [46]. Each sample has been measured at T=293 K with a wavelength of 8 Å, using a cylindrical cell of thickness of 0.2 mm. This configuration allowed to probe the dynamics with an energy resolution around 10 µeV on a wave vector range going from 0.005 to 1.45 Å−1. This means that, with this spectrometer configuration, we could observe characteristic times included between 0.7 and 65 ps.
At each raw spectrum was firstly subtracted the contribution of the empty cell. Then each signal was normalized to the spectrum of a cylindrical vanadium refer-ence sample (measured in the same spectrometer configuration) for correcting the efficiency variation of the different detectors. Finally it was applied a Q grouping for improving the signal statistics and energy rebinning with a step of 0.01 meV.
1.3.2.2.2 The Time of Flight experiments on LET
For improving the characterization of the cationic faster dynamics we performed some ToF measurements on the spectrometer LET (ISIS-Didcot) [47].
For this series of measures we used three different instrument configuration, that are shown in the table 1.2.
Ei (meV) λ (Å) Measured resolution (µeV) Energy range (meV) Q range (Å−1)
3.00 0.8 81 -1.6 - 1.00 0.05-1.65
1.27 1.3 22 -1 - 0.5 0.05-1.05
0.70 1.7 13 -0.5 - 0.2 0.05-0.75
Table 1.2: LET configurations used during the ToF measurements.
For the characterization of the faster modes we opted for a configuration with a low energy resolution (δE ≈ 80 µeV), which had a wide observation energy range, while we choose other two configurations at high resolution (δE ≈ 20 µeV and δE ≈ 13 µeV), for the observation of the slower excitations.
At each spectrum was treated with the standard procedure explained in the section 1.3.2.2.1
1.3.2.2.3 The Backscattering measurements on IRIS
To probe the cationic dynamic occurring at tens of picoseconds time scale, we performed some measurements on the ToF spectrometer IRIS (ISIS-Didcot) [48].
We setted the instrument in a back-scattering (BS) configuration. This allowed to achieve a better energy resolution (δE ≈ 17.5 µeV ) than a classic ToF machine.
We choose a wavelength equal to 1.1 Å which allowed to probe an energy range included between -0.5 and 0.5 meV and Q range coming from 0.48 to 1.07 Å−1. All acquisitions were done at room temperature. Each spectra was normalized to the signal of vanadium sample for the correction of the efficiency of the detector. After that the spectra were subjected to Q-grouping for increasing the signal statistic.
1.3.2.2.4 The neutron spin-echo measurements on IN11
The spin-echo measurements were performed on the spectrometer IN11C (ILL-Grenoble) [49].
For these measures we used a wavelength of 5.5 Å and an angle between the two procession coils equal to 20◦ and 50◦. This apparatus has a energy resolution much higher than a typical ToF machine (δE ≈ 1 neV ), which allowed us to probe
a time scale coming from 10 to 1000 ps and the Q range included between 0.1 to 1.2 Å−1.
We acquired each IL spectra at room temperature (T= 300 K). For correcting the signal for the spectrometer resolution (see section C.5), we divided the room temperature spectra for those measured on the sample at low temperature (T=2 K).
It is important to notice that with NSE we don’t measure the dynamical struc-ture factor S(Q, ω) as ToF or BS. In fact because of the specific characteristics of the technique (see appendix C), with NSE the measured quantity is the intermedi-ate scattering function I(Q, t) which is the Time Fourier Transform of S(Q, ω) [1]:
I(Q, t) =
Z +∞
−∞
S(Q, ω)e−iωtdω (1.6)
So in this case, the observed correlation function is defined in the space of the time and the wave vector.
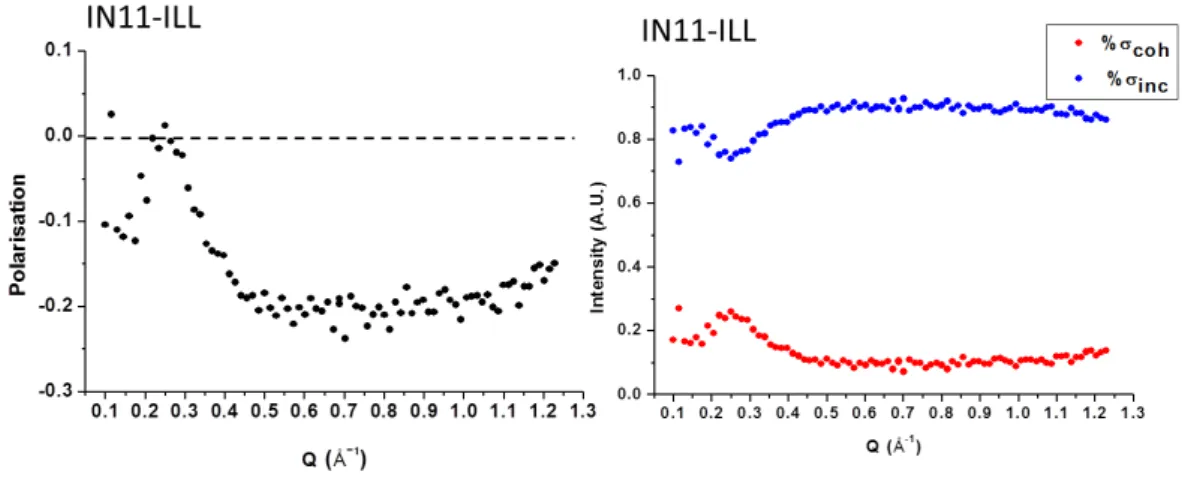
Before acquiring the sample scattering function, we performed a polarisation analysis for choosing which Q values to probe.
In fact, how it is explained in section C, by NSE the sample scattering function is obtained measuring the polarisation of neutron beam after it interaction with the sample. So the presence of polarisation after the scattering event is a necessary condition for detecting a signal. Seen that the sample is not magnetic, the polarised neutrons may interact in two different ways with nuclei: they can scatter coherently or incoherently. The first scattering doesn’t cause a neutron spin-flip while the second one does. So this latter can be a detrimental effect because it could decrease the polarisation of the beam. Being the incoherent scattering an isotropic event, a 13 of total amount of incoherently scattered neutrons will go through a spin reversal which doesn’t change the spin direction. So if we define as SF the number of scattered neutrons which had a spin-flip, while with NSF the number of those which didn’t had it, these quantities will be given by the equations:
N SF = Ncoh(Q) +
1
3Ninc(Q) (1.7)
SF = 2
3Ninc(Q) (1.8)
where Ncoh(Q) and Ninc(Q) are respectively the number of scattered neutrons
in the coherent and incoherent way at a given Q value. With the quantities shown in the relations 1.7 and 1.8 we can define the measured polarisation P as:
P = N SF − SF
N SF + SF = Icoh(Q) − 1
Figure 1.13: Polarisation analysis performed on the spectrometer IN11C (ILL) on the sample OMIM-BF4. A) Measured polarisation in function of the wave vector.
B) Percentage of coherent (red) and incoherent (blue) scattering in function of Q. These quantities were calculated using the equations 1.10 and 1.11.
where Icoh(Q) (Iinc(Q)) is the number of scattered neutrons in the coherent
(incoherent) way at given Q value divided by the number of all scattered neutrons Ntot(Q) = Ncoh(Q) + Ninc(Q).
Furthermore the polarisation analysis allows also to quantify the percentage of coherent and incoherent scattering occurring in the experiment (evaluation not possible with ToF measurements). Using the relation 1.9 and the definition of Ntot
we can demonstrate that the percentages of the coherent and incoherent scattering are given by the equations:
%σcoh = (3P + 1) 4 (1.10) %σinc = (3 − 3P ) 4 (1.11)
As example, the results of this analysis on the OMIM-BF4 are shown in Figure
1.13.
We normalized the measured values of P for those one measured on a sample of TiZr where the scattering is 100% coherent. This procedure allows to consider the real efficacy of he spectrometer components. As we can see from the plot, the polarisation at low Q is quite low (P ≈- 0.1). From 0.15 Å−1 it grows reaching the zero at Q=0.25 Å−1 and then it decreases again to negative values until Q=0.45 Å−1 where it remains stable to -0.2. Due to low values of P for low Q, we choose to measure the spectra for Q bigger than 0.45Å−1, where the polarisation is higher.
If now we consider the percentages of coherent and incoherent scattering in the sample (Fig.1.13B), we can notice that the scattering is mainly incoherent (%σinc %σcoh). This is due to the large amount of hydrogen nuclei (23 atoms
for each cation) present in the sample. Only for low Q, in the region between 0.15 and 0.45 Å−1, there is an augmentation of the coherent contribution. This is caused by the pre-peak of the static structure factor, that was observed in this Q range (see section 1.2).
1.3.3
Effects of the cation-anion couple on ILs dynamics
The first step of this work was the determination of the influence of the ionic couple on the ILs dynamics. We will show that the anion nature seems to have an important role on the ion dynamics at the local level.
For this purpose we studied the same four ILs that we have analysed by SANS. An example of the measured spectra (normalized to the sample mass) is shown in figure 1.14, where the samples are grouped by the cation. From the plot we can notice that for the same cation the spectra have the same intensity for null energy transfer S(Q, ω = 0). This latter is proportional to the sample scattering cross section (see appendix A), which, in the case of protonated samples can be approximated to its incoherent part. Since in the samples considered in this study the hydrogen is only in the cation, the incoherent cross section is approximated to the cationic one. This means that the systems with the same cation have the same cross section. When we consider the quasi-elastic signal (S(Q, ω) with ω 6= 0) for the liquids in the same groups, it seems to have different width. This difference suggests the cation is not a key parameter to define the dynamical features of the samples.
Another feature that we can observe from the comparison of the spectra in the figure 1.14, is that the width of the quasi-elastic signal seems to be narrower in the case of ILs which have the BF4 as anion. Since the characteristic time of the
dynamics is proportional to the width of the quasi-elastic signal, we can conclude that for this latter group of liquids the dynamics is slower. This effect could be explained by delocalisation of the TFSI electric charge which causes a weakening of the coupling anion-cation inducing greater freedom to the cationic dynamics. This effect seems to agree with the results obtained by different NMR measurements performed on the same liquids. In fact if we use the values reported in the works of Tokuda [41,42] and Harris [50] for calculating the cation self-diffusion coefficient at T=293 K we find the following cationic self-diffusion coefficient: DOM IM −T F SI =
9 10−8 cm2/s, D
BM IM −T F SI = 2.2 10−7 cm2/s, DOM IM −BF4 = 2.6 10
−8 cm2/s
and DBM IM −BF4 = 1.1 10
−7 cm2/s, which show the same trend observed by our
neutron study.
![Figure 1.6: A) Simulation box taken by the reference [6], which shows the self- self-organization in the IL OMIM-P F 6 (adapted by the references [6, 29])](https://thumb-eu.123doks.com/thumbv2/123doknet/12702976.355730/26.892.123.720.283.630/figure-simulation-taken-reference-shows-organization-adapted-references.webp)