The Dependence of NMR Measured Diffusion, Magnetization Transfer, and T2
Relaxation on Fractional Water Content in Bovine Articular Cartilage.
by Arthur K. Liu Bachelor of Science Electrical Engineering
Massachusetts Institute of Technology (1993) Submitted to the Department of Electrical Engineering in Partial Fulfillment of the Requirements for the Degree of
MASTER OF SCIENCE
at the
Massachusetts Institute of Technology June, 1995
© 1995 Arthur K. Liu All rights reserved
The author hereby grants to M.I.T. permission to reproduce and to distribute
publicly paper and electronic copies of this thesis document in whole or in part.ii
i
/
Signature of Author
-
.,
Department of Electrical Engineering May 19, 1995 Certified by
Prefessor Deborah Burstein ThqiR.q Rlinervisor Certified by
ProV
Marh L.
Gray-\ ~ k / I >h. .itrvisor Accepted by"Prow~~ ]~ lorgenthiler
~-Chairman, Department Commlittee on Gr Ndte Students
MASSACHUSETTS INSTITUTE
OF TECHNOLOGY
JUL 1
71995
LIBRARIES Barker-Eng
The Dependence of NMR Measured Diffusion, Magnetization Transfer, and T2 Relaxation on Fractional Water Content in Bovine Articular Cartilage.
by
Arthur K Liu
Submitted to the Department of Electrical Engineering and Computer Science, in partial fulfillment of the requirements for the degree of Master of Science in Electrical
Engineering
Articular cartilage is a dense, relatively acellular and avascular tissue which
functions as a load bearing material and provides a smooth surface for articulation in joints.
The major constituents of cartilage are water, cells, and an extracellular matrix. The
functional properties of the tissue depend greatly on the integrity of the extracellular matrix.
Changes in the matrix, such as those seen in the degenerative cartilage diseaseosteoarthritis, may compromise those properties. In addition to the matrix deterioration,
there is an observed increase in fractional water content.One of the imaging modalities used for the diagnosis of arthritis is magnetic
resonance imaging (MRI). Some MRI parameters that are becoming more widely used in the clinical setting are diffusion and magnetization transfer. Diffusivity of water can be inferred directly from measurements of their brownian motion using nuclear magnetic resonance (NMR). Magnetization transfer (MT), expressed as Ms/Mo, examines the transfer of magnetization between proton pools of varying mobility. In the case of cartilage, two major pools are presumed to include protons associated with the matrix and protons in the bulk water. A more commonly used parameter is T2 relaxation, the process of the decay of the
transverse magnetization.
The pathological changes that occur in osteoarthritis are complex and varied, and
may affect the MRI measurements. To better understand how pathologic alterations are
reflected in MRI measurements this thesis focuses on one particular change, the increase infractional water content observed in diseased cartilage. Thus, the purpose of this thesis
was to examine the specific effect of changes in fractional water content, without altering thematrix constituents, on NMR measured diffusion, magnetization transfer, and T2 relaxation
in bovine articular cartilage. Fractional water content was specifically altered bycompressing the cartilage samples, forcing water out of the tissue.
Using theoretical considerations and previous experimental measurements,
preliminary estimates of changes in the NMR parameters were made, and these predictions were compared to the results. For comparison purposes the increase in the parameter for a change in fractional water content from 70% to 77% was determined. These values roughly
represent the water content of normal and arthritic tissue. For all three parameters, an
increase in fractional water content resulted in an increase in the parameter.Diffusivity predictions based on models gave a range of increases from 8% to 28%, showing reasonable agreement with the observed increases of 21% and 23%. The expected increase based on previous data, in Ms/Mo (11%) matched well with the experimentally measured increase of 13%. The large discrepancy between the predicted increase based on previous data, in T2 (42%) and the experimentally measured increase (83%) may have been due to T2 dependence on magnetic field strength and differences in sample type and
composition.
Using these results and measurements from others on cartilage that varies in both
matrix constituents and fractional water content, preliminary determinations of the
specificity of the NMR parameters were made. Diffusion results suggest that themeasurement reflects fractional water content and does not depend on the precise
macromolecular composition. It was not possible to compare MT results to data from others due to the normalization used. T2 appears to be affected by fractional water content and
matrix constituents.
In conclusion, the relationship between fractional water content and NMR measured
diffusion, MT, and T2 in bovine articular cartilage has been characterized. These data provide the framework for examining the effect of variations in other cartilage matrixconstituents on the NMR measurements.
Thesis Supervisors:
Deborah Burstein, Ph.D.
Associate Professor of Radiology Beth Israel Hospital
Harvard Medical School Martha L. Gray, Ph.D.
Associate Professor of Electrical and Medical Engineering Department of Electrical Engineering and Computer Science
M.I.T. and Harvard-M.I.T. Division of Health Science and Technology
Acknowledgments
I would first like to thank my advisors, Debbie and Martha. Their contributions to
this work went far beyond reading the many drafts of this thesis. The guidance they
provided has shaped the way I think and approach problems, and has prepared me well for research in the future. Debbie's enthusiasm for MR has rubbed off on me, and I plan to continue working in MR. Martha's encouragement allowed me to realize many of my academic goals. I hope the many good things I have learned with Debbie and Martha will be reflected in my future work.Of course, I must thank my parents. They are the two people in the world who will always believe in me. None of my achievements would be possible without their support.
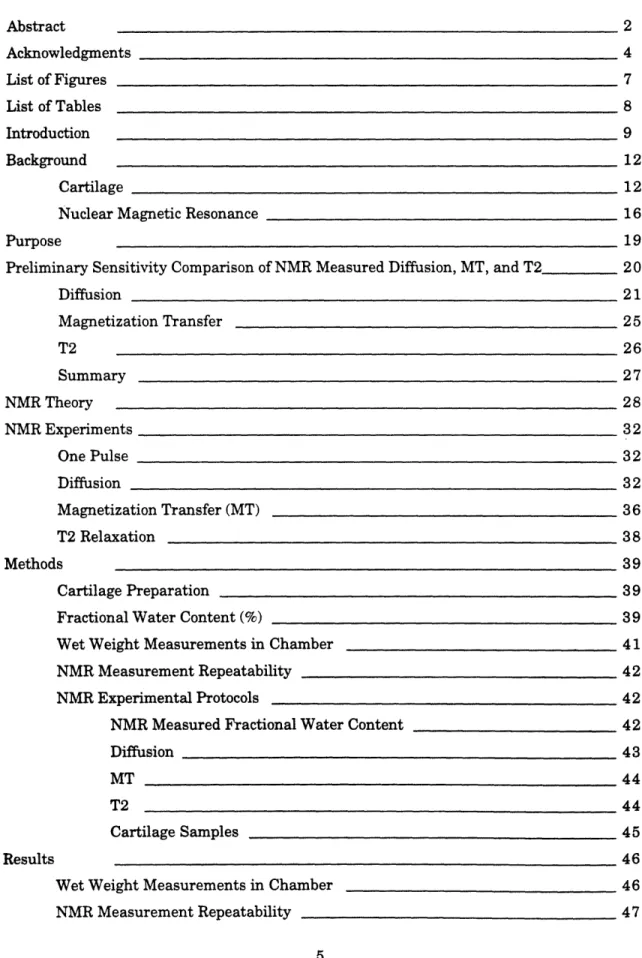
Table of Contents
Abstract 2 Acknowledgments 4 List of Figures 7 List of Tables 8 Introduction 9 Background 12 Cartilage 12Nuclear Magnetic Resonance 16
Purpose 19
Preliminary Sensitivity Comparison of NMR Measured Diffusion, MT, and T2 20
Diffusion 21 Magnetization Transfer 25 T2 26 Summary 27 NMR Theory 28 NMR Experiments 32 One Pulse 32 Diffusion 32 Magnetization Transfer (MT) 36 T2 Relaxation 38 Methods 39 Cartilage Preparation 39
Fractional Water Content (%) 39
Wet Weight Measurements in Chamber 41
NMR Measurement Repeatability 42
NMR Experimental Protocols _ _ 42
NMR Measured Fractional Water Content 42
Diffusion 43
MT 44
T2 44
Cartilage Samples 45
Results 46
Wet Weight Measurements in Chamber 46
NMR Measurement Repeatability 47
NMR Experiments 48
NMR Water Content 49
NMR Measured Fractional Water Content 50
Diffusion Coefficient 51
Magnetization Transfer 55
T2 56
Discussion 58
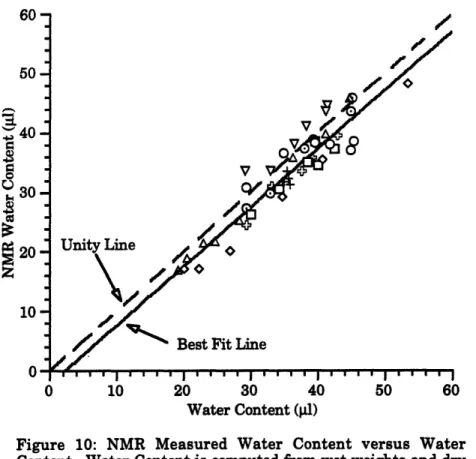
NMR Measured Water Content and Fractional Water Content 58
NMR Measured Diffusion, MT, and T2 60
Diffusion 61 MT 63 T2 65 Specificity 67 Diffusion 68 T2 70 Conclusions 73 Future Work 75 Appendix 76
1. Analysis of Error in the Measurement of T2 76
2. Radial Expansion During Compression 79
3. Raw Data for Figures 10-18 82
List of Figures
1. Schematic of Cartilage Structure 13
2. Venn and Maroudas (1977) 15
3. Example Free Induction Decay 30
4. Fourier Transform of Figure 3 31
5. Vector Diagram for the Stimulated Echo Pulse Sequence 32
6. Chang (1975) 35
7. Frequency Spectra for Two Proton Pools in Cartilage 37
8. Schematic of NMR Compression Device 40
9. Verification of Wet Weight Measurement Technique 47
10. NMR Measured Water Content versus Water Content 49 11. NMR Fractional Water Content versus Fractional Water Content 50 12. Diffusion Coefficient versus Fractional Water Content at
A = 0.025 s and A = 0.500 s for the Standard 51
13. Diffusion Coefficient versus Fractional Water Content at A =0.025 s 52 14. Diffusion Coefficient versus Fractional Water Content at
A
=0.500 s 53 15. Diffusion Coefficient versus Fractional Water Contentat A =0.025 s and A = 0.500 s 54
16. Magnetization Transfer versus Fractional Water Content 55
17. T2 versus Fractional Water Content 56
18. 1/T2 versus Fractional Water Content 57
19. Corrected NMR Fractional Water Content versus Fractional Water Content 60 20. NMR Measured DC at A = 0.025 s versus Solid Volume Fraction 62 21. Normalized MT versus Fractional Water Content 64
22. 1/T2 versus Fractional Water Content 66
23. Diffusion Coefficient versus Fractional Water Content at A = 0.025 s 68
24.
T2 versus Fractional Water Content
70
25. V/T2 versus Solid / Water 72
26. Estimated Diameter versus Compression Thickness 80
List of Tables
1. Summary of Full Thickness Fractional Water Content Measurements of
Normal and Osteoarthritic Cartilage 14
2. NMR Experimental Value at Fractional Water Contents of 70% and 77%
and % Increase 27
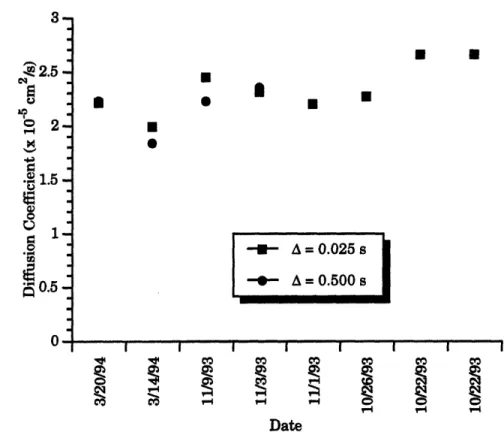
3. Single Sample Variation in NMR Measurements 48
4. Summary of Experimental NMR Measurements at 70% and 77%
Fractional Water Contents, the % Increase and the Predicted % Increase
61
5. Computed Gradient (g) for 3 choices of Diffusion Coefficient (D) 7 6 6. Error in T2 Measurement due to Background Gradients 77Introduction
Articular cartilage is a dense, relatively acellular and avascular tissue which functions as a load bearing material in joints. Cartilage consists mainly of water, cells called chondrocytes, and an extracellular matrix. Water comprises 60% - 80% of the wet weight of cartilage. Chondrocytes, which are responsible for the maintenance of the
extracellular matrix, make up less than 10% of the total tissue volume. The extracellular
matrix has two major constituents, collagen and glycosaminoglycans (GAGs).The ability of the cartilage to distribute load in the joint and to provide a smooth surface for articulation depends upon the integrity of the extracellular matrix. Therefore, changes in the matrix may compromise the normal functioning of cartilage. Osteoarthritis (OA), a disease characterized by the progressive degeneration of cartilage, significantly changes the content and the characteristics of the extracellular matrix. (For a review see Mankin and Brandt, 1984.) In OA, there is an increase in fractional water content. There is also an increase in collagen synthesis, although collagen content appears unchanged. In comparison, GAG content decreases while GAG synthesis increases.
Clinical and laboratory evaluations, conventional radiography, arthroscopy, and magnetic resonance imaging (MRI) techniques are just some of the tools used in the diagnosis of OA (Resnic and Niwayama, 1988). Although invasive, arthroscopy is often considered the "gold standard" of the various imaging modalities (Fife 1992). MRI, a promising non-invasive technique, allows a more direct visualization of cartilage and can provide earlier detection of arthritis than conventional radiography (Kaye 1990). MRI is used clinically to detect arthritis, to determine the severity and activity of the disease, and to evaluate the progression of the disease (Kaye 1990).
Some MRI parameters that are becoming more widely used in the clinical setting are
diffiusion and magnetization transfer (MT). An NMR technique is able to infer the selfdiffusion coefficient of water from measurements of the brownian motion of the water molecules (Stejskal and Tanner 1965). Magnetization transfer examines the transfer of magnetization between proton pools of varying mobility (Forsen and Hoffman 1963, 1964). In the case of cartilage, two major pools of protons are assumed to be those associated with the large macromolecules of the solid matrix and those in the bulk water. A more commonly used parameter in the diagnosis of OA is T2 relaxation. T2 relaxation, also referred to as
spin-spin relaxation, is the decay of the net transverse signal in the x-y plane.
The changes that occur in cartilage with degenerative diseases such as osteoarthritis are both varied and complex. Many of those changes, either alone or in conjunction with one another, may affect the previously mentioned NMR parameters. It is the goal of this thesis to examine the specific effect of changes in fractional water content, without altering the solid content, on NMR measured diffusion, magnetization transfer, and T2 relaxation. The results will allow the further analysis of the effect of other matrix constituents on the NMR measurements. The method used to alter fractional water content is compression. As a
cartilage sample is compressed, water is forced out of the sample, and as a result the
fractional water content decreases.Previous NMR measurements of diffusion, MT, and T2 relaxation in cartilage have
been reported by various authors. Diffusion of water in bovine cartilage was previously measured by Hartman (1991). The measurement was made on free swelling samples and samples compressed to approximately 40% of the initial height. The diffusivity in the compressed samples measured slightly lower than in the free swelling case. Lesperance(1993) measured MT (expressed as a ratio Ms/Mo) in trypsin digested bovine cartilage that
was placed under various levels of compression. Lesperance found that as the cartilage wascompressed and the fractional water content decreased, Ms/Mo decreased slightly (the MT effect increased). T2 weighted images of bovine articular cartilage were produced by Lehner (1989). Two different zones of intensity were noted. The surface layer had a higher
fractional water content and longer T2 relaxation times. The deeper layer had a lower fractional water content and shorter T2 relaxation times.
In terms of the dependence of the NMR measurements on fractional water content, the previous NMR measurements are limited in various ways. In the case of the diffusion
and T2, measurements at only two different fractional water contents were made. In addition, the T2 measurements compared two different zones of cartilage that differed in fractional water content, but also may have differed in other characteristics that may have affected the T2 times. The MT measurements were made over a range of fractional water contents. However, the samples were degraded with trypsin which make it difficult to determine the effect of changes in fractional water content alone. This thesis attempts to address these limitations by measuring the NMR parameters on normal bovine articular cartilage over a range of fractional water contents. The results from this work will provide a more exact determination of the effect of changing fractional water content on the NMR measurements of diffusion, MT, and T2. In addition, since changes in other matrix
constituents are often coupled with a change in fraction water content, these results will allow the further determination of the effect changes in matrix constituents, other than
water, on the NMR measurements.
Background
Cartilage
Articular cartilage is a dense, relatively acellular and avascular tissue which
functions as a load bearing material. Approximately 60%-80% of the wet weight of cartilage is water. The extracellular matrix is mainly composed of collagens, 12%-18% of the wet weight, and glycosaminoglycans (GAGs), 4%-6% of the wet weight (Mankin and Brandt 1984). Chondrocytes, which make up less than 10% of the total volume, are responsible for the formation, maintenance, and resorption of the extracellular matrix. Collagens form a fibrous network that provides tensile strength. GAGs provide compressive strength due partly to electrostatic repulsion of the highly negatively charged side chains (Buckwalter 1987). GAGs play a primary role in normal cartilage function. The charged GAGs repel one another and are highly hydrophilic, generating considerable swelling pressure. These attributes of the GAGs help resist water loss from the cartilage under compression. The pressure of the GAGs to expand is constrained by the elastic collagen network (Maroudas 1976). A schematic of the cartilage structure is shown in Figure 1.
Spacmg: 3-4 nm Spacing: 40-400 nm Figure 1: Schematic of cartilage structure. Spacing between GAGs is 3-4 nm (Byers 1983). Spacing between collagen fibers is 40-400 nm (Byers 1983).
In degenerative cartilage diseases such as osteoarthritis, loss of matrix constituents is observed. (For a review see Mankin and Brandt 1984.) GAG concentration is found to decrease in osteoarthritic cartilage, with the decrease proportional to severity (Mankin and Brandt 1984). In contrast, the collagen content per weight wet or dry weight in normal and osteoarthritic cartilage does not vary (Mankin and Brandt 1984).
Another characteristic differentiating normal and diseased cartilage is fractional water content. Fractional water content is defined here as the absolute water content
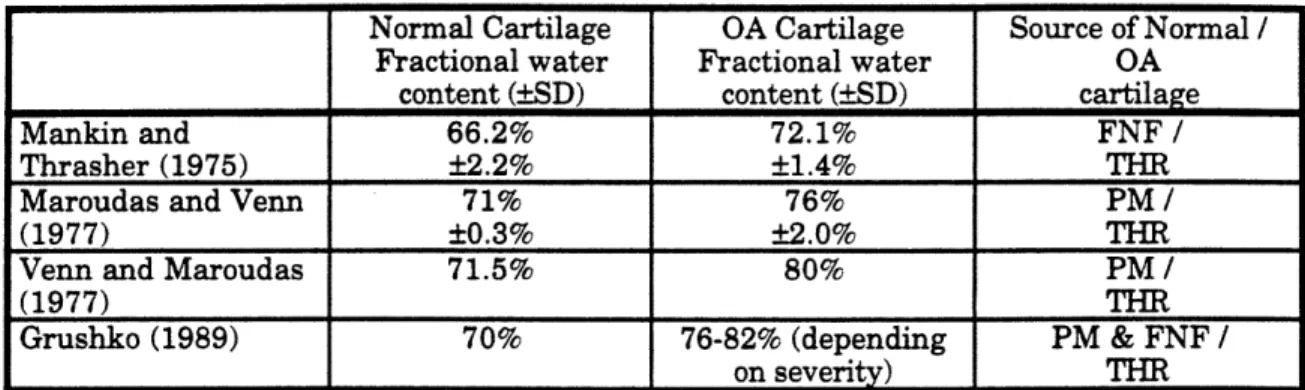
divided by the wet weight and is expressed as a percentage. The fractional water content of osteoarthritic cartilage has been found to be significantly higher than the fractional water content of normal cartilage (Mankin and Thrasher 1975, Maroudas and Venn 1977, Venn and Maroudas 1977, Grushko 1989). The fractional water content measurements of full thickness cartilage samples are summarized in Table 1.
Table 1. Summary of full thickness fractional water content measurements (SD) of
normal and osteoarthritic cartilage. No standard deviations were given for Venn and
Maroudas (1977) or Grushko (1989). All cartilage samples were from human femoral
head. The Grushko measurements for osteoarthritic cartilage were taken from diseased
cartilage of varying severity, characterized by the degree of fibrillation. Explanation of
cartilage source: FNF = femoral neck fracture, THR = total hip replacement, PM = post mortem.There is some discrepancy in the absolute fractional water content of normal and diseased
tissue between Mankin and Thrasher and the others. The lower measured fractional water
content of Mankin and Thrasher may be due to their procedure. Cartilage slices were resected and placed in a bath of Eagle's medium for five minutes, after which the fractionalwater content was measured. In the other three studies, the equilibration time was not
specified. One possible cause for the lower fractional water content seen by Mankin and Thrasher may be the incomplete equilibration of the samples. However, it is clear from allthe studies that there is an increase in the fractional water content of diseased cartilage.
The amount of the increase in fractional water content has also been correlated to the severity of the cartilage degradation (Venn and Maroudas 1977, Grushko 1989). Venn and Maroudas used decreasing GAG concentration as a measure of increasing disease severity. GAG concentration was measured by measuring the fixed charge density (FCD), which they defined as the amount of negatively charged fixed groups per weight of tissue. In cartilage at physiological pH, the measured FCD is due mainly to the negatively charged GAGs (Maroudas 1969, Maroudas and Thomas 1970). The mean fractional water content of normal cartilage was 71.5%. Fractional water content was found to increase with
14
Normal Cartilage OA Cartilage Source of Normal /
Fractional water
Fractional water
OA
content (SD) content (SD) cartilage
Mankin and 66.2% 72.1% FNF /
Thrasher (1975) ±2.2% +1.4% THR
Maroudas and Venn 71% 76% PM /
(1977) +0.3% +±2.0% THR
Venn and Maroudas 71.5% 80% PM /
(1977) THR
Grushko (1989) 70% 76-82% (depending PM & FNF /
decreasing FCD. The fractional water content of the samples with the lowest FCD measured greater than 80%. Grushko (1989) also compared normal human femoral head cartilage to osteoarthritic samples of varying severity. The osteoarthritic samples were placed into the following three groups based upon the degree of fibrillation: (1) intact surface, (2) surface fibrillation, and (3) deep fibrillation. The fractional water content of normal samples was 70%. The fractional water content of the osteoarthritic samples ranged from 76% for the samples with intact surfaces (least severe) to 82% for samples with deep fibrillation (most severe). From these results it can be seen that fractional water content varies in the presence of disease and with the severity of disease.
In addition to the variation in tissue fractional water content between full thickness samples of normal and diseased cartilage, fractional water content also varies with depth in both normal and osteoarthritic cartilage (Maroudas 1976, Venn and Maroudas 1977, Roberts 1986 A). The results of Venn and Maroudas (1977) are shown in Figure 2.
A.., w.
I
I
7 II
o0 i 2 3 '4 ' . ' Slice numberFigure 2: Venn and Maroudas (1977)
Fractional Water Content (% Wet Weight)
versus Slice Number for normal and
osteoarthritic human femoral head
cartilage.
Top curve is from the
osteoarthritic samples. Slice Number
increases with depth from surface of the
cartilage. Slice thickness was 200 pm.In normal cartilage, fractional water content decreases with increasing depth from
the surface. Osteoarthritic cartilage fractional water content increases from the surfacetowards the middle zone and then decreases with increasing depth. At all depths,
osteoarthritic cartilage has higher fractional water content than normal cartilage. Roberts
(1986 A) also made measurements of fractional water content versus depth for normal andosteoarthritic human femoral head cartilage. Roberts found a similar trend of fractional
water content as a function of depth for normal and osteoarthritic cartilage. Based on all ofthese results, fractional water content has been shown to depend on the presence and
severity of disease, and the depth within the cartilage independent of disease.
Nuclear Magnetic Resonance
One of the diagnostic tools used in the diagnosis of degenerative cartilage diseases is nuclear magnetic resonance (NMR) (Kaye 1990, Resnic and Niwayama 1988). The diagnostic usefulness of magnetic resonance imaging (MRI) has been demonstrated in many studies (Recht 1993, McCauley 1992, McAlindon 1991, Modl 1991, Kaye 1990, Verbruggen
1990, Konig 1987, Sabiston 1987). MRI provides greater soft tissue contrast than conventional radiography (Kaye 1990). Clinically images of cartilage are graded for the
presence of osteoarthritis and the severity of disease using a visual inspection of intensity
(Recht 1993, Modl 1991). The changes that occur due to arthritis in cartilage are varied, and many of those changes may affect NMR measurements which result in changes in magnetic resonance images. One of the pathological changes is the increase in fractional water content that is believed to be an indicator of both the presence of osteoarthriticdisease and the severity of disease. This thesis specifically examines the effect of specifically changing fractional water content without altering solid content on NMR measurements of
diffusion, magnetization transfer, and T2 relaxation. These three NMR parameters were
selected for their clinical relevance. Diffusion and MT are becoming more widely used in the clinical setting, compared to T2 which is already commonly measured.
An NMR technique is able to infer diffusion coefficients from the measurements of the brownian motion of molecules (Stejksal and Tanner 1965). The process of diffusion in a
hydrated matrix is affected by the ratio of water to matrix volume. In cartilage, the matrix
provides impediments to the motion of the solutes which reduces the average distance moved by the solutes in a given time interval. The reduction, which can be characterized by a decrease in the effective diffusivity, can be largely accounted for by the reduction in area available to the solutes and the increased tortuosity of the diffusion path for the solutes (Maroudas 1976). An increase in the ratio of water to matrix would result in a decrease in the effect of the obstacles thereby increasing the effective diffusivity of the solutes. This relationship has been seen experimentally. Maroudas and Venn (1977) measured the diffusivity of tritiated water in normal and fibrillated cartilage. A 12% increase in diffusivity was seen in the fibrillated cartilage (77% fractional water content) when compared to normal cartilage (71% fractional water content). NMR diffusion measurements of free swelling and compressed bovine cartilage have also been made (Burstein 1993). A single compression level of approximately 35% of the original thickness was used. The NMR measured diffusion coefficient in the compressed sample was lower than the free swelling samples.Another NMR experiment that is now being used for imaging of cartilage is the magnetization transfer (MT) experiment. Using MT, improved contrast can be generated between cartilage and synovial fluid (Wolff 1991). One of the factors that affects the MT measurement (expressed as a ratio Ms/Mo) is the concentration of macromolecules in the sample, with increasing concentration resulting in a decrease in Ms/Mo. Thus, a decrease in fractional water content should result in a decrease in Ms/Mo (Sepponen 1992). The
dependence of the MT measurement on fractional water content of cartilage has been
suggested experimentally (Gray 1994, Lesperance 1993). Both Gray and Lesperance made MT measurements of collagen suspensions varying in concentration from approximately 1 -30 g/100 ml. As the concentration increased (fractional water content decreased), Ms/Mo decreased. Lesperance also made MT measurements of trypsin digested cartilage under a range of compression levels. The trypsin was used to remove the GAG content from the cartilage. As the cartilage was compressed, decreasing fractional water content, Ms/Mo measured as a function of estimated collagen content of the sample decreased slightly.
NMR measured diffusion and MT are relatively new experiments in the clinical domain. A more commonly used parameter in clinical imaging is the T2 relaxation time.
Fractional water content in tissues greatly affects T2 relaxation times. Protons that are
associated with macromolecules
have shorter relaxation times than protons in the bulk
water. The measured T2 relaxation time is a weighted average of the different groups of protons. Therefore, an increase in fractional water content would result in an increase in the T2 relaxation time measurements (Fullerton 1992).This relationship between relaxation times and fractional water content has been demonstrated in many tissues, including cartilage. Decreases in T2 times have been correlated to decreases in fractional water content in tissues such as muscle and tendon (Scholz), intervertebral disc (Weidenbaum), uterus (McCarthy 1989) and cerebral white matter (Sappey-Marinier 1990). Lehner (1989) produced magnetic resonance images of bovine articular cartilage that displayed two different layers. The layer with the longer T2 time corresponded to the superficial layer with a fractional water content of 82%. The
deeper layer with the shorter T2 time had a fractional water content of 76%. Both fractional
water contents were computed by measuring wet weights and dry weights of cartilage slices from different depths. These data demonstrate a rough relationship between decreasing fractional water content and a measurable decrease in T2 times.Purpose
Fractional water content has been shown to vary between diseased cartilage and normal cartilage, and as a function of depth in both diseased and normal cartilage. Based on the previous NMR experimental data, changes in fractional water content have been associated with changes in NMR measurements of diffusion, magnetization transfer, and T2 relaxation. However, those measurements are limited in several ways: (1) the diffusion and T2 measurements were limited to a few values of fractional water content, (2) the T2 measurement reflects tissue which may have varied in solid content in addition to fractional water content, and (3) the magnetization transfer measurements as a function of
compression were made on degraded cartilage not normal cartilage, which adds the effect of degradation to the effect of varying fractional water content on the measurement. The purpose of this thesis is to determine the functional relationship between fractional water content and NMR measurements of diffusion, magnetization transfer, and T2 for constant
solid composition. (For a more complete description of the NMR experiments, refer to the
NMR Theory and NMR Experiments sections.) These results will allow the further examination of the effect of other matrix constituents on the NMR measurements.
The specific control of fractional water content is achieved through compression of the sample. An assumption made with compression is that the solid content does not change with compression. Any changes in weight in a compressed sample are due to loss of water, which result in a decrease in fractional water content. Absolute water content will
monitored in two ways: (1) using the one pulse NMR experiment and (2) using wet weight
and dry weight measurements.
Preliminary Sensitivity Comparison of NMR Measured
Diffusion, MT, and T2
The purpose of this section is to provide some preliminary estimates on the
magnitude of change that might be measured by the various NMR experiments for a given change in fractional water content. For computation purposes, a change in fractional water content from 70% to 77% (10% increase in fractional water content) was chosen. Those values are representative of the change in fractional water content seen pathologically in osteoarthritis. An initial solid cartilage content density of 1.4 g/cc is also assumed (Lipshitz 1976). All predicted values are summarized in Table 2 at this end of the section.
Diffusion
In order to estimate the sensitivity of diffusivity changes to changes in fractional water content several theoretical models were considered. In particular, three analytical models for diffusion are commonly compared to experimental measurements of diffusivity in cartilage - the phenomenological and stochastic Ogston models (1973) and the Mackie and Meares model (1955). All three models assume that obstacles cause distortions to the diffusion path and thereby increase diffusivity. Previous non-NMR measurements of diffusion coefficients of small solutes in chondroitin sulfate solutions (Maroudas 1988) found that for some solutes (proline, Na+) the stochastic Ogston model fits the data well. Also, from a measurement of the tritiated water diffusion coefficient in uncompressed femoral head cartilage, Maroudas (1977) concluded that the Mackie and Meares model also
described the measured diffusion coefficient well. Thus, these models are assumed to
provide some indication of the sensitivity of diffusion to fractional water content. They have not, however, been rigorously tested for cartilage.Ogston (1973) developed a theoretical explanation for an empirical equation of Laurent (1963) that described diffusion of various globular particles in hyaluronic acid (HA) solutions as a function of the solute radius and concentration of hyaluronic acid. Laurent's empirical relation was:
-= Aek1
Do
Do = the diffusion coefficient of the solute in free solution (no polymer)
A = constant greater than 1 and usually less than 2
k = dimensionless constant for HA determined experimentally to be 1.4 1 = length of HA chain/volume
r = radius of solute
Ogston began with two different theoretical premises and developed two different models -the phenomenological model and -the stochastic model. The phenomenological model treats diffusion as the continuous solute movement that results from a potential gradient. The stochastic model assumes diffusive motion occurs as a series of small unit steps.
In the phenomenological model, obstacles will increase the diffusion path. This results in a change in diffusivity as:
D 1
Do (l+a)
2Do = the diffusion coefficient of the solute in free solution (no polymer) a = coefficient depending on the geometry of the obstacles
* = solid volume fraction
The form of this model did not match the form devised by Laurent, leading to the development of a second model based on a different theoretical premise. The
phenomenological model has been included here for comparison because of its similarity to the Mackie and Meares model.
The stochastic model makes an assumption that the unit step motion either occurs
or does not occur. There is no intermediate step length. Therefore only a fraction of steps are successful. To develop this model, Ogston began with the probability distribution for the distance a solute would move (x) before the first collision with obstacles:g(x) = lre-½ilr x
The probability of successful completion of the unit step (x) is the probability that the
distance moved before the first collision is greater than X. To compute the probability of success (P), g(x) can be integrated with respect to x from A to o, which results in:p = e-IA
Assuming a step length of 217:
D = e_ Do
Note that the form of this model matches well with the empirical form of Laurent. In the stochastic model k = 1.77 (W ), which is reasonably close to Laurent's 1.4.
The stochastic form does not take into account the actual thickness of the obstacles.
To include the thickness, the r would be replaced by (r + a) where a is the radius of the
obstacle. Ogston also assumed that the volume fraction of the obstacles is:= solid volume fraction a = radius of obstacles 1 = length of obstacle/volume
The stochastic Ogston model can now be rewritten as:
D
=
e-aDo=e
Another model of diffusion was developed by Mackie and Meares (1955). They postulated that obstructions would cause an increase in path length of 0, which would modify mobility and diffusivity as . Again let
)
represent the solid volume fraction. The obstructions occupy sites, leaving (1- ) sites available for diffusion. The diffusing solute either moves forward or encounters an obstruction and moves laterally. At that newposition the probability of a site being available for diffusion is
Therefore the fraction of solutes that require another extra jump is
0(1(,+O))
The fraction that would require n extra jumps is
0(2, (1 + ))n
The increase in path length can now be expressed as:
00
0 = i + 0 Y4)(1+n))n
U=O
Since
1
(1 +))
< 1, the expression for converges to:1-4)
1
For a given time, a solute in a system of obstructions will move -as far as a solute in free
8
solution. Since the diffusion coefficient (D) is proportional to x2 (Crank 1975), the Mackie and Meares model as a function of solid volume fraction is:
D (1_)2
Do (1+ *)2
Do = the diffusion coefficient of the solute in free solution (no polymer)
)
= solid volume fractionThese three particular models were derived for polymer systems characterized by the solid volume fraction of the polymer. To relate the solid volume fraction of cartilage to the fractional water content, a solid content density of 1.4 g/cc was assumed (Lipshitz 1976). Thus a change in fractional water content from 70% to 77% represents a change in solid volume fraction from 23% to 18%. Also, the diffusion coefficient of water at 25°C (2.3 x 10⁻⁵
cm2/s, CRC 1980-81) is the value used for Do. For the phenomenological Ogston model a was computed to be 2.4 using data from NMR diffusion measurements on bovine cartilage (Burstein 1993). (For a diffusing time of 25 ms, D/Do was measured to be 0.60, and was computed to be 0.12 from a hydration of 84% and a solid density of 1.4 g/cc, implying a = 2.4.) The radius of the GAG matrix molecule (a in the stochastic Ogston model) was assumed to be 0.5 nm (Maroudas 1988), and the radius of the diffusing solute, water, was computed from the Stokes-Einstein relation (Bird 1960) to be 0.1 nm.
Using the three models, diffusion estimates can be made for the given change in fractional water content. For a decrease in solid volume fraction from 23% to 18%, the
phenomenological Ogston model predicts a change in the diffusion coefficient from 0.94 x 10⁻⁵ cm2/s to 1.14 x 10⁻⁵ cm2/s, and the stochastic Ogston model predicts a change from 1.29 x
10-5 cm2/s to 1.39 x 10-
6
cm2/s. For the same change in solid volume fraction as above, the Mackie and Meares model predicts an increase in the diffusion coefficient from 0.88 x 10⁻⁵ cm2/s to 1.13 x 10⁻⁵ cm2/s. These predicted sensitivities for NMR measured diffusion especially should be taken only as a preliminary estimates. It is not clear which diffusion model, if any, will predict actual experimental NMR measurements of diffusion.In addition to the theoretical models, there exists some experimental NMR measurements of diffusion in bovine cartilage that allows estimation of the change in diffusivity for a given change in fractional water content. Burstein (1993) measured the diffusivity of water in free swelling calf articular cartilage and cartilage compressed by approximately 35% of the free swelling height. Using a diffusing time of 25 ms, the
diffusivity of the free swelling cartilage measured 1.43 x 10⁻⁵ cm2/s, and the diffusivity of the compressed cartilage measured 1.10 x 10⁻⁵cm2/s. Using a linear extrapolation, the
predicted diffusivity at fractional water contents of 70% and 77% are 0.66 x 10⁻⁵ cm2/s and 1.05 x 10⁻⁵ cm2/s respectively.
Magnetization Transfer
There is no obvious theoretical approach to predicting the change in magnetization transfer due to a change in fractional water content. Relevant experimental data do, however, exist. Lesperance (1993) measured MT as a function of % collagen content (grams of collagen / 100 ml of tissue water) in bovine cartilage that was digested with trypsin. Trypsin was used to remove the GAG content, leaving only the collagen content of the
extracellular matrix. The % collagen content was determined by measuring the dry weight of the sample, and assuming that all of the dry weight represented collagen. The % collagen content was altered by compressing the sample. Based on Lesperance's data, it appears that for fractional water contents of 70% and 77% (corresponding approximately to % collagen contents of 43% and 30% respectively), the measured MT was approximately 0.18 and 0.20 respectively.
T2
Similar to MT, the predicted changes for T2 are based, not on analytical models, but on experimental measurements. Lehner (1989) measured the T2 relaxation time at 0.5 T and fractional water content in bovine articular cartilage. Within a single sample, two zones of different T2 times and fractional water contents were found. The superficial zone had a higher fractional water content of 82% and a T2 time of 77 ms. The deep zone had a lower fractional water content of 76% and a T2 time of 51 ms. From these data, the T2 times at 70% and 77% fractional water content were estimated by fitting a line to 1/T2, resulting in T1 times of 38 ms and 54 ms respectively. This particular method of extrapolation was
chosen based on data from Weidenbaum (1992) that found a linear relationship between
l/T2 and fractional water content.
Summary
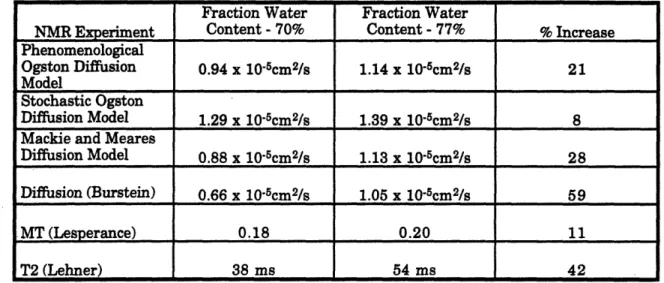
A summary of the predicted sensitivity to pathological changes in fractional water content for the NMR measured diffusion, MT, and T2 is shown below in Table 2.
Table 2: NMR Experimental Value at Fraction Water Contents of 70% and 77% and the % Increase in the measurement from 70% to 77%. The fractional water contents were chosen to approximately represent normal (70%) cartilage and osteoarthritic (77%) cartilage.
Assuming a density of the solid portion of cartilage of 1.4 g/cc, 70% and 77% fractional water contents correspond to 23% and 18% solid volume fractions respectively. The first three diffusion predictions are from analytical models, not actual experimental measurements. The last diffusion prediction is based on a linear extrapolation of measurements of Burstein (1993) at two different fractional water contents. The MT values were taken from
Lesperance (1993). The T2 values were taken from Lehner (1989). The Lehner values are extrapolations from measurements at only two values of fractional water content.
For the difference in fractional water content seen between normal and osteoarthritic cartilage, the MT experiment shows the smallest change, suggesting that it will probably be the least affected by changes in fractional water content. The experimental diffusion
measurements (Burstein 1993), and the T2 measurements (Lehner 1989) appear to have the largest changes for the given change in fractional water content, although these three predictions were based on extrapolations from a limited number of measurements.
27
Fraction Water Fraction Water
NMR Experiment Content - 70% Content - 77% % Increase Phenomenological
Ogston Diffusion 0.94 x 10⁻⁵cm2/s 1.14 x 10⁻⁵cm2/s 21 Model
Stochastic Ogston
Diffusion Model 1.29 x 10⁻⁵cm2/s 1.39 x 10⁻⁵cm2/s 8 Mackie and Meares
Diffusion Model 0.88 x 10⁻⁵cm2/s 1.13 x 10⁻⁵cm2/s 28 Diffusion (Burstein) 0.66 x 10⁻⁵cm2/s 1.05 x 10⁻⁵cm2/s 59
MT (Lesperance) 0.18 0.20 11
NMR Theory
These descriptions of basic NMR theory and the one pulse experiment are taken from Experimental Pulse NMR: A Nuts and Bolts Approach, Fukushima and Roeder (1981).
Nuclear magnetic resonance takes advantage of the fact that nuclei with an odd number of protons or neutrons possess spin and charge, and therefore have a magnetic moment. When a sample is placed within a magnetic field Bo, the spins orient either parallel, with the direction of Bo, or antiparallel, against the direction of Bo. Bo is assigned to be on the +z axis. The lower energy state is the parallel orientation so slightly more spins are oriented parallel. This difference in the number of spins aligned parallel and
antiparallel gives rise to a net magnetization vector.
The magnetic moments are not stationary. Instead, they precess around the
magnetic field. The frequency of precession is uniquely determined by the gyromagnetic ratio y and the field Bo. This frequency, called the Larmor frequency or resonant frequency, can be expressed as:
Co = Bo
Although, the spins are all precessing at the same frequency, the phases are randomized in the x-y plane, so there is not net magnetization in the x-y plane, and the net magnetization vector is in the +z direction.
In a one pulse experiment, a magnetic field rotating at the Larmor frequency, which is in the radio frequency range, is applied in the plane (x-y plane) perpendicular to Bo (+z axis). The field is applied for a short period of time, and this is called an "rf pulse". The rf
pulse causes the moments to align with the rf pulse, similar to the parallel and antiparallel
alignment due to Bo, and a phase coherence in the x-y plane is introduced. The netmagnetization vector is now a sum of the +z component and a component in the x-y plane, and still rotates at the Larmor frequency. By varying either the amplitude of the pulse or the duration of the pulse, the net magnetization vector can be rotated off the +z axis by any amount. An rf pulse that places the net magnetization vector in the x-y plane is referred to as a 90°pulse. The rf pulse required to place the net magnetization vector along the -z axis is a 180° pulse.
After excitation by the rf pulse, the net magnetization vector decays in the x-y plane and also simultaneously returns back toward the steady state +z axis orientation. The decay in the x-y plane, called T2 or spin-spin relaxation, is due to the dephasing of the spins in the x-y plane. The net magnetization vector simultaneously returns towards equilibrium on the +z axis as the spins exchange thermal energy with the molecular framework, or lattice, and is called T1 or spin-lattice relaxation.
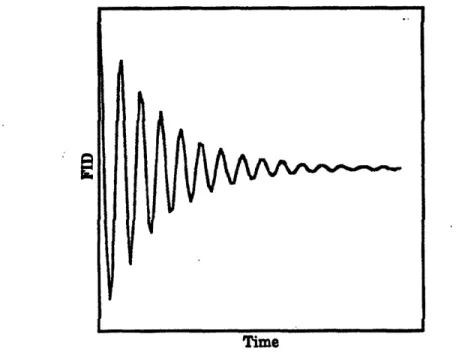
The decaying net magnetization vector will generate a current in a receiver coil with its symmetry axis in the x-y plane. The signal induced (Figure 3) is called the free induction decay (FID).
Time
Figure 3: Example Free Induction Decay Signal
versus TimeThe initial value of the signal is proportional to the number of nuclei in the sample. To determine the initial value in time, the Fourier transform of the FID (Figure 4) is
integrated from -oo to +oo.
I
gII
Frequency
Figure 4: Fourier Transform of the FID shown in
Figure 3.
The area under the curve is
proportional to the number of nuclei in the
sample.For quantitative measurements, the area under the curve is then calibrated to the area
measured from a standard.NMR Experiments
One Pulse
Proton content is measured using a one pulse proton experiment:
90
°- acquire
The 90
°pulse flips the net magnetization vector into the x-y plane. The net magnetization
vector is proportional to the number of proton spins. To obtain quantitative information, the one pulse experiment is performed on a standard of known quantity, such as a known volume of water.Diffusion
Proton diffusivity is measured using a stimulated echo diffusion experiment (Stejskal and Tanner 1965):
900 . gradient - 900
°.crusher. 90
°- gradient- acquire
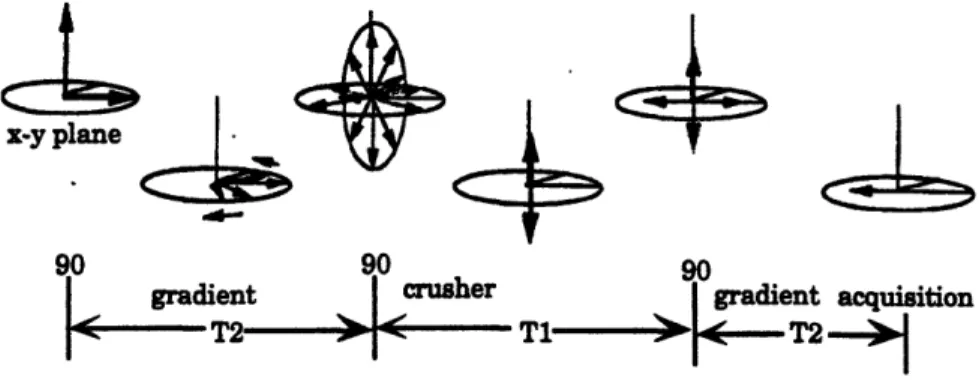
A vector diagram describing the stimulated echo diffusion experiment is shown below in Figure 5 (the vector diagram is from Callaghan 1991):
x-y plane
+S
90 gradient -T2-90 4 crusher I -90 I gradient acquisition->-
T2
Figure 5: Vector diagram for the stimulated echo pulse sequence (from
Callaghan 1991). Below the diagram is the pulse sequence and the
decay rates for the various intervals.
32
! ,MI<E!!!>
v T1 I.a-The first 90°pulse flips the net magnetization vector into the x-y plane. Following
the first 90
°pulse, the first magnetic field gradient, which varies linearly with position,
alters the magnetic field seen by each spin based on its spatial location. This change in magnetic field changes the frequency of each spin (o = y B), again based on its location. After some time during which the magnetic field gradient is on, the spins will be out of phase with each other depending on their position. Thus the first magnetic field gradient "phase" encodes the proton spins according to location. Between the first and second 90° pulses, the net magnetization vector decays at a rate of T2.Assuming the first 90°pulse is in the x direction, the second 900 pulse, also in the x direction, flips only the y-component of the net magnetization vector; the x-component is unaffected. The crusher gradient dephases the magnetization components that remain in the x-y plane. During the interval between the second and third 90° pulses, the
magnetization in the z axis grows at a rate of T1. The remaining z axis magnetization is flipped into the x-y plane by the third 90°pulse. In this final interval between the third 90° pulse and the signal acquisition, the decay rate is again T2.
The second magnetic field gradient, which occurs between the third 90°pulse and the acquisition, also "phase" encodes by location, but the phase is opposite of the first gradient. If the protons have not moved, the acquired signal will be the same as if there were no gradients. However, if the protons have moved in the time between the two
gradients, the second magnetic field gradient does not exactly cancel out the phase
introduced by the first magnetic field gradient. Since each proton which has moved acquires a phase depending on how far it has moved, a phase incoherence in the sample will be introduced, and the acquired signal will decrease in comparison to the case where the
protons do not move. Given that the phase encoding gradients are of duration 8 and the
time between gradients is A, and assuming free Brownian motion, the ratio (R) of the signal acquired with gradients to that without can be written as
in (R) = 2g282(A-8/3)D
where g is the gradient strength, y is the gyromagnetic ratio, and D is the diffusion coefficient (Stejskal and Tanner 1965).
The advantage of the stimulated echo pulse sequence over a spin echo (90°-180°) pulse sequence is the T1 rate of decay between the second and third 90°pulses in the stimulated echo pulse sequence. For most biological systems, T1 is on the order of one second, and T2 is in the tens of milliseconds. The stimulated echo diffusion experiment allows the measurement of diffusion over time intervals (A) that are much greater than T2.
An experimental parameter that can be varied in the NMR diffusion experiment is the time over which diffusion is measured (A). In a system with no obstacles, such as free solution, the measured diffusion coefficient is independent of A. However, if the diffusion system has obstacles to diffusion, then the effective diffusion coefficient measured by NMR varies with A (Chang 1975). The relationship between D and A developed by Chang is shown below in Figure 6.
U
0
Q
0
Diffusion Interval (A) Figure 6: Chang (1975).
NMR measured
Diffusion
Coefficient versus Diffusion
Measurement Interval (A) in the
presence of permeable obstructionsto
the
diffusing
solute.
Relationship between D and A was developed analytically by Chang.At very short measurement intervals, the majority of the diffusing solutes do not encounter the obstructions so that the NMR measurement of diffusivity is at a maximum. As the diffusion interval increases, more and more of the solute encounters the obstacles, decreasing the net displacement of the solutes. Movement of spins in the NMR diffusion experiment results in a decrease in the signal acquired, with greater distances moved
corresponding to a larger decrease in signal and a larger NMR measured diffusion coefficient. The decrease in displacement caused by encounters with obstacles is reflected in the NMR diffusion experiment as a decrease in diffusivity. Eventually, a region at longer A is reached where the measured diffusion coefficient is independent of the measurement interval. At the longer A, the solutes have effectively encountered so many of the obstructions that the
system appears homogeneous to the diffusing solute. In that interval, an increase in
measurement interval (A) allows the diffusing solutes to move a mean distance proportional to the square root of A, which is equivalent to the measured diffusion coefficient beingconstant.
Magnetization Transfer (MT)
The magnetization transfer experiment examines the transfer of magnetization from one saturated species of protons to another unsaturated species (Forsen and Hoffman 1963, 1964). Saturation of a species is defined as a zero net magnetization vector due to equal parallel and antiparallel spins and no phase coherence. In cartilage, it is convenient to consider two species of protons. One species consists of protons associated with the large macromolecules of the solid matrix, which have restricted motion. The second species is the remaining protons in the bulk water, which are relatively unrestricted. It is possible to
saturate the restricted protons without affecting the bulk water protons due to the different
linewidths of the two pools. The bulk water protons have a slow T2 relaxation rate, on the order of hundreds of milliseconds, that gives a narrow (10-20 Hz) NMR linewidth, compared to the faster relaxation of the restricted protons, with a 20-40 kHz linewidth (Figure 7). The restricted protons are saturated with an rf pulse that is several kHz off the resonantresonant I
frequency
saturation
frequency Figure 7: Frequency spectra for two proton poolsin cartilage. The unrestricted bulk proton pool
has a linewidth of 10-20 Hz. The restricted proton pool associated with the macromolecules has a much broader linewidth of 20-40 kHz. The frequency of saturation excitation used for the MT experiment is shown. The saturation frequency is usually offset from the resonant frequency by several kHz.Magnetization transfer is expressed as the ratio of Ms/Mo. Ms is the bulk proton signal after saturation of the macromolecular protons. Mo is the bulk proton signal without saturation of the macromolecular protons. The MT measurement is made in two steps. First, Mo is measured on resonance using a one pulse proton experiment:
90 - acquire
The 90°pulse flips the net magnetization vector into the x-y plane. Mo is a measurement of
the amount of water in the sample.
Ms is measured using a saturation experiment:
Psat 90°
-acquire
Psat is defined as a square pulse, 6 kHz off resonance, with a duration of 12 seconds. The power of Psat is set at the level of a 1 ms 180° pulse. The parameters of Psat were characterized by Lesperance (1993). The offset frequency was chosen in a "plateau" region of the MT versus offset frequency graph where the MT effect decreased only slightly with increasing offset frequency. The saturation power was chosen to equal 12 RT to minimize
tissue heating and facilitate comparison with data from other investigators. Psat saturates
the macromolecular protons. During Psat, transfer of the magnetization occurs between thebulk protons and the macromolecular protons, resulting in a decrease in the bulk proton
signal, which is measured by the 90° pulse.T2 Relaxation
T2 relaxation, also referred to as spin-spin relaxation, is the decay of the net magnetization vector in the x-y plane. The relaxation occurs due to dephasing of the individual moments. Proton T2 relaxation is measured using a Hahn (1950) spin-echo experiment:
900
°- 2 - 180 - W2 - acquire
T is defined as the echo time. The 90° pulse flips the net magnetization vector into the x-y plane. The spins then lose phase coherence for a duration of T/2 due to magnetic field inhomogeneities and T2 relaxation mechanisms. The 180° pulse refocuses the spins after
another delay of T/2 and removes any field inhomogeneity effects. Any decay in the acquired
signal is now due to T2 relaxation for a duration of .
Methods
Cartilage Preparation
Calf articular cartilage was harvested from the femoropatellar groove according to previously established techniques to yield plane-parallel plugs 2 mm thick and 5 mm in diameter (Sah 1989). Cartilage samples were stored at -20°C until needed. The plugs were allowed to equilibrate in Hank's Balanced Salt Solution (HBSS, Gibco) at room temperature for one hour prior to the start of the experiment. The main constituents of HBSS are 138 mM NaCl, 5 mM KC1, and 4 mM NaHCO3.
Fractional Water Content (%)
Fractional water content (FWC) was defined as:
water content * 100%
wet weight(as described below, water content was determined either by NMR or by subtracting dry weight from wet weight)
Wet weight was measured for each compression level. After the completion of the
experiment, the sample was lyophilized, and the dry weight was measured. Two methods were used to measure water content: (1) the dry weight was subtracted from the wet weight, and (2) the NMR one pulse experiment. In Results, all NMR measurements are displayed as a function of fractional water content calculated using the first method of
measuring water content.
The method chosen to control fractional water content was compression.
Compression was used to specifically change fractional water content without altering the 39
solid content. The loss of water from the sample resulted in a decrease in fractional water
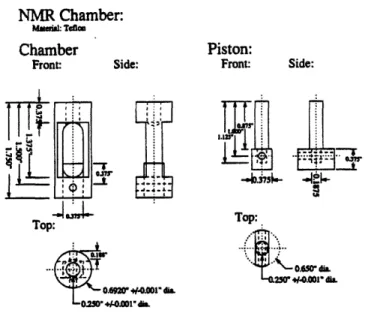
content.A custom made NMR compression chamber was designed and constructed by Steve Lin (Figure 8). The chamber was made out of Teflon so that the chamber would be NMR
transparent. Early chambers were made from polysulfone, but it was determined that the
polysulfone absorbed a non-negligible amount of water, giving rise to a NMR signal. The compressed tissue thickness was controlled by a pair of Teflon shims placed between the piston and the bottom surface of the upper portion of the chamber, and ranged from 200 gm to 1800 gim.NMR Chamber: Mefia: Teflam
Chamber Piston:
Front: Side: Front: Side:
H
i~i
~~~~~~~~Top:
Hi'-2
~~~~~414.00."
diaL0.6920" *0.001" di.
Figure 8: Schematic of the custom made Teflon NMR compression device. Teflon was chosen for its NMR transparency. Compression thickness is controlled by
Teflon shims placed between the piston and the upper
portion of the chamber. Compression thicknesses
range from 1800 jim to 200 im. Constructed byStephen Lin.
It should be noted that the parameter used for analysis of the NMR parameters was
fractional water content, and not the shim defined compression thickness. From visual
inspection of the plug during compression, radial expansion was obviously occurring. (For a more complete discussion of the issue of radial expansion refer to Appendix 2.) Also, at smaller compression thicknesses, the compression surfaces were no longer parallel to one another. Therefore, the compressed thicknesses determined by the shims may not have been exact and could not be accurately used as a measurement of sample volume or water content.
Wet Weight Measurements in Chamber
During the NMR experiments the wet weight of the cartilage sample was needed to determine the fractional water content. The sample was placed within the compression chamber, and the sample and chamber together were placed in a bath of HBSS for equilibration. Prior to performing the NMR experiments, any excess water was removed from the chamber and the exposed portions of the sample, and the sample and chamber together were weighed. The wet weight was calculated from this measurement by subtracting the weight of the chamber, which was measured alone earlier in the day.
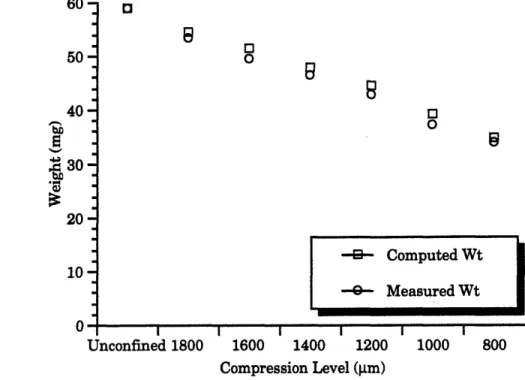
A control study was conducted to establish the efficacy of the wet weight
measurement method. Initially, the chamber alone was weighed. At each compression level, the sample was compressed to the desired height and then allowed to equilibrate in HBSS for 30 minutes. The entire chamber, including shims and cartilage sample, was then dried and weighed. The plug was then removed and weighed alone. Finally, the shims were weighed and a wet weight for the sample was computed.
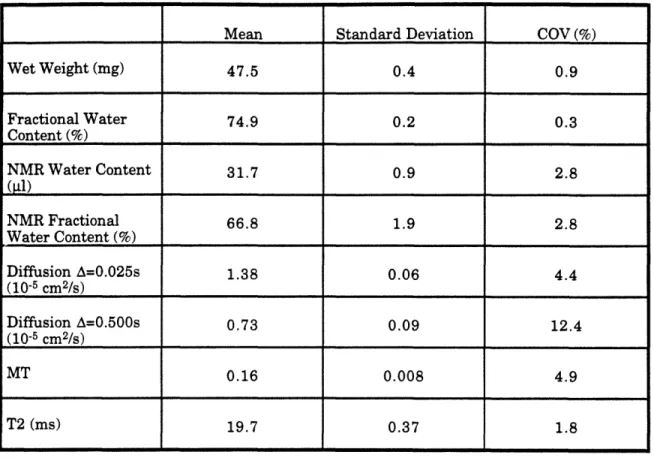
NMR Measurement Repeatability
The repeatability in the NMR experiments was determined experimentally. A single cartilage plug was compressed to 1400 glm and allowed to equilibrate in HBSS (- 1 hour). Diffusion, at both A's, MT, and T2 were measured. (Descriptions of the NMR experiments follow.) The plug, still at 1400 pm compression, was again placed in HBSS for 30 minutes to allow equilibration, and then the NMR measurements were repeated. A total of five
repetitions were made with 30 minutes equilibrations.
NMR Experimental Protocols
All NMR experiments were performed on an 8.45 T Bruker AM Spectrometer (Bruker Instruments, Inc., Billerica MA) at a frequency of 360 MHz for proton.
NMR Measured Fractional Water Content
Each day, the one pulse experiment was calibrated to a standard of 50 p1 of water. To improve signal to noise, the one pulse experiment was repeated 8 times and summed, with a delay of 12 seconds between repetitions (TR = 12 s). The TR was chosen to be greater than 5 T1 (T1 = approximately 2 s) to allow for sufficient regrowth of the net magnetization vector. The NMR measurement of water content was compared to absolute water content computed from wet weight and dry weight measurements. Also, the NMR measurement of water content was divided by wet weight to determine an NMR computed fractional water content.
Diffusion
Each day before measuring cartilage samples the diffusion experiment was performed on a standard of a small glass sphere filled with water. A source of error in measuring diffusion occurs due to the geometry of the standard. An irregular geometry, such as the meniscus formed in a 5 mm tube, causes larger inhomogeneities in the magnetic field than a sample of regular geometry. A sphere minimizes the inhomogeneities in the magnetic fields. Inhomogeneities cause additional dephasing of the protons, which is interpreted in the diffusion experiment as higher diffusivities.
The diffusion experiment consisted of two experiments. Two different times between gradients (A), 0.025 seconds and 0.500 seconds, were used. The duration of the gradients (8) was 0.007 seconds for both A times. To determine D, the experiment was repeated for 9 values of gradient strength (g) and fit to the equation determined by Stejskal and Tanner (1965):
In (R) = - 2g282(A-/3)D
At A = 0.025 seconds, the g was incremented from 0 G/cm to 13 G/cm in steps of 1.625 G/cm. At A = 0.500 seconds, g was incremented from 0 G/cm to 3.25 G/cm in steps of 0.4063 G/cm for the diffusion standard and from 0 G/cm to 1.64 G/cm in steps of 0.2050 G/cm for cartilage samples. To increase signal to noise at each g value, the diffusion
experiment was repeated and summed 4 times with a delay between repetitions of 1 second (TR = s). The delay between each value of g was 10 s.
The diffusion measurements were normalized to a temperature of 298°K by the Stokes-Einstein relationship (Bird 1960).
D29 8 K T DT T Ji2 98
D298 = diffusion coefficient normalized to 298°K
T = temperature at the time of measurement in Kelvin
t298 = viscosity of water at 298°K (0.8904 centipoise (CRC 1980)) 9T = viscosity of water at T (from CRC 1980)
DT = diffusion coefficient measured at T
MT
To improve signal to noise Mo was measured using a one pulse experiment repeated and summed 8 times with a delay between repetitions of 12 seconds (TR = 12 s). Ms was measured using a Psat 6 kHz off resonance with a duration of 12 seconds. The power of Psat was set at the power level of a 1 ms 1800 pulse. To improve signal to noise the Ms measurement was repeated and summed 8 times with a delay between repetitions of 12 seconds (TR -= 12 s). MT was expressed as the nondimensional Ms/Mo.
The absolute Ms/Mo measurement was very sensitive to the value chosen for Psat (Lesperance 1993). To remove changes due to Psat the data for each day was normalized to the value measured for the unconfined sample on that day.
T2
The T2 experiment was performed at 8 values of . The T values in milliseconds were 4, 8, 14, 20, 30, 40, 50, and 60. To improve signal to noise at
each T, the experiment was repeated and summed 4 times with a delay between
repetitions of 12 seconds (TR = 12 s). The data were fit to the equation:I('r) = Io
to determine the T2 relaxation time constant (Hahn 1950).
Cartilage Samples
An equilibrated cartilage plug (5 mm diameter, 2 mm thick) was placed in the NMR compression chamber (Figure 8) under no compression. This was referred to as the
"unconfined" sample. Surface water was removed from the chamber and plug as thoroughly as possible and weighed before running the NMR experiments. The four NMR experiments are explained previously. After completion of the experiments, the chamber and plug were placed in HBSS and the cartilage was compressed. The sample was allowed to equilibrate
for 30 minutes. The chamber and plug were again dried and weighed, and the experiments
were repeated. The compression - equilibration - NMR experiments cycle was repeated atsuccessive levels of compression with compression increased in -200 pm steps. After all compression levels were measured, the plug was frozen to be lyophilized later to determine dry weight.
Results
Wet Weight Measurements in Chamber
During the NMR experiments the cartilage sample had to remain within the
compression chamber. Wet weights of the cartilage samples were indirectly computed bymeasuring the combined weight of the chamber and sample and then subtracting out the
weight of the chamber (previously weighed). This method was referred to as the "computed weight." To verify this approach the computed weight was compared to directmeasurements (referred to as "measured weight") of the plug alone, shown below in Figure 9. The difference between computed weight and measured weight was always less than 2