HAL Id: inserm-02450678
https://www.hal.inserm.fr/inserm-02450678
Submitted on 23 Jan 2020
HAL is a multi-disciplinary open access
archive for the deposit and dissemination of
sci-entific research documents, whether they are
pub-lished or not. The documents may come from
teaching and research institutions in France or
abroad, or from public or private research centers.
L’archive ouverte pluridisciplinaire HAL, est
destinée au dépôt et à la diffusion de documents
scientifiques de niveau recherche, publiés ou non,
émanant des établissements d’enseignement et de
recherche français ou étrangers, des laboratoires
publics ou privés.
Proteomic comparison defines novel markers to
characterize heterogeneous populations of extracellular
vesicle subtypes
Joanna Kowal, Guillaume Arras, Marina Colombo, Mabel Jouve, Jakob Paul
Morath, Bjarke Primdal-Bengtson, Florent Dingli, Damarys Loew, Mercedes
Tkach, Clotilde Théry
To cite this version:
Joanna Kowal, Guillaume Arras, Marina Colombo, Mabel Jouve, Jakob Paul Morath, et al.. Proteomic
comparison defines novel markers to characterize heterogeneous populations of extracellular vesicle
subtypes. Proceedings of the National Academy of Sciences of the United States of America , National
Academy of Sciences, 2016, 113 (8), pp.E968-E977. �10.1073/pnas.1521230113�. �inserm-02450678�
Proteomic comparison defines novel markers to
characterize heterogeneous populations of
extracellular vesicle subtypes
Joanna Kowala, Guillaume Arrasb, Marina Colomboa, Mabel Jouvea, Jakob Paul Moratha, Bjarke Primdal-Bengtsona,
Florent Dinglib, Damarys Loewb, Mercedes Tkacha, and Clotilde Thérya,1
aInstitut Curie, PSL Research University, INSERM U932, Department“Immunité et Cancer”, 75248 Paris, France; andbInstitut Curie, PSL Research University, Centre de Recherche, Laboratoire de Spectrométrie de masse Protéomique, 75248 Paris, France
Edited by Randy Schekman, University of California, Berkeley, CA, and approved January 5, 2016 (received for review October 28, 2015) Extracellular vesicles (EVs) have become the focus of rising interest
because of their numerous functions in physiology and pathology. Cells release heterogeneous vesicles of different sizes and intra-cellular origins, including small EVs formed inside endosomal compartments (i.e., exosomes) and EVs of various sizes budding from the plasma membrane. Specific markers for the analysis and isolation of different EV populations are missing, imposing important limitations to understanding EV functions. Here, EVs from human dendritic cells were first separated by their sedimen-tation speed, and then either by their behavior upon upward floatation into iodixanol gradients or by immuno-isolation. Exten-sive quantitative proteomic analysis allowing comparison of the isolated populations showed that several classically used exosome markers, like major histocompatibility complex, flotillin, and heat-shock 70-kDa proteins, are similarly present in all EVs. We identified proteins specifically enriched in small EVs, and define a set of five protein categories displaying different relative abundance in distinct EV populations. We demonstrate the presence of exosomal and nonexosomal subpopulations within small EVs, and propose their differential separation by immuno-isolation using either CD63, CD81, or CD9. Our work thus provides guidelines to define sub-types of EVs for future functional studies.
exosomes
|
microvesicles|
ectosomes|
dendritic cells|
extracellular vesiclesI
n the last decade communication between cells via secretion of membrane vesicles (collectively called extracellular vesicles or EVs) has become the focus of increasing interest (reviewed in refs. 1–3). EVs are composed of a lipid bilayer containing transmembrane proteins and enclosing soluble proteins and RNA. The communication via EVs might be mediated by their multiple components. The surface receptors of EVs allow their targeting and capture by recipient cells, which can then in-corporate proteic, lipidic, and even genetic messages carried by the vesicles, resulting in modifications of their physiological state (1, 4, 5). Consequently, the possibility of using these vesicles as biomarkers in various diseases, as vehicles of immunotherapies, or as targets to be eliminated to improve patients’ health is currently being explored (2, 6).It has become clear, however, in the past few years, that cells can release EVs of different types. Some EVs are directly formed and released from the cells’ plasma membrane (PM), and are often called microparticles, (shed) microvesicles, or ectosomes: these EVs display sizes ranging from a few dozens of nanometers to a few micrometers. Internal vesicles generated within multi-vesicular endosomal compartments (MVB) are secreted when these compartments fuse with the PM, thus releasing their in-ternal vesicles in the extracellular milieu: these EVs are termed exosomes (3, 7). Exosomes are classically defined by their size, similar to the size of intraluminal vesicles of MVBs (i.e., below 150 nm in diameter), and their content of endosome-associated proteins. However, the term exosome is often used in the liter-ature for EVs of small size, passing through 220-nm pore filters
or recovered by high-speed ultracentrifugation (8), in the ab-sence of demonstration of their intracellular origin. Such iso-lation procedures coisolate mixed EV popuiso-lations, which we will call“small EVs” (sEVs), for lack of better term, in the rest of this article. Because EVs of different intracellular origins probably have different functional properties (9, 10), the mixed nature of EV preparations has made the growing literature increasingly confusing, with contradictory proposed functions and clinical uses of vesicles being regularly published. The lack of specific purifi-cation and characterization tools prevents a clear understanding of the specific versus shared functional properties of the different EVs. There is, therefore, a critical need for the identification of specific markers defining the different subtypes of EVs.
To achieve this goal, we have performed here an extensive comparative analysis of the protein composition of all EVs re-covered in the different steps of the differential ultracentrifu-gation (DUC) protocol classically used to isolate sEVs (11). As a source of EVs, we used human primary monocyte-derived den-dritic cells (DCs), whose exosomes and EVs have been described to promote immune responses (1, 12).
We found that several proteins often used in the literature as “exosome-markers,” such as flotillin-1, heat-shock 70-kDa pro-teins (HSC70/HSP73, HSP70/HSP72), or major histocompati-bility complex (MHC) class I and class II proteins are present, to
Significance
The last decade has seen a rapid expansion of interest in ex-tracellular vesicles (EVs), proposed to mediate cell–cell com-munication in patho/physiological conditions. Although het-erogeneity of EVs has become obvious, as highlighted recently by the International Society for Extracellular Vesicles, the field is lacking specific tools to distinguish EVs of different in-tracellular origins, and thus probably different functions. Here, thanks to a comprehensive comparison of different types of EVs isolated from a single cell type, we define proteins ge-nerically present in EVs, small EV-specific and -excluded ones, and a few specific of endosome-derived exosomes or non-exosomal small EVs. This work will allow proper evaluation of the molecular mechanisms of biogenesis and secretion and the respective functions of subtypes of EVs.
Author contributions: J.K., D.L., M.T., and C.T. designed research; J.K., M.C., M.J., J.P.M., B.P.-B., and F.D. performed research; J.K., G.A., M.C., M.J., J.P.M., F.D., M.T., and C.T. analyzed data; and J.K., M.T., and C.T. wrote the paper.
The authors declare no conflict of interest. This article is a PNAS Direct Submission.
Data deposition: Raw proteomic data have been deposited in the ProteomeXchange
Consortium (www.proteomexchange.org) via the PRIDE partner repository (accession
no.PXD003257).
1To whom correspondence should be addressed. Email: clotilde.thery@curie.fr.
This article contains supporting information online atwww.pnas.org/lookup/suppl/doi:10.
1073/pnas.1521230113/-/DCSupplemental.
various extents, not only in the sEVs pelleted at high speed, but also in the larger/heavier EVs pelleted at medium or low speed. We further separated the pelleted EVs by floatation into a density gradient or by immuno-isolation with antibodies specific for the three tetraspanins classically used as exosome markers (CD9, CD63, CD81), and performed a label-free quantitative proteomic analysis of their respective composition. We thus identified more specific protein markers of either the sEVs, among which a subpopulation bearing all tetraspanins correspond to endosome-derived exosomes, or the larger/heavier vesicles.
Results
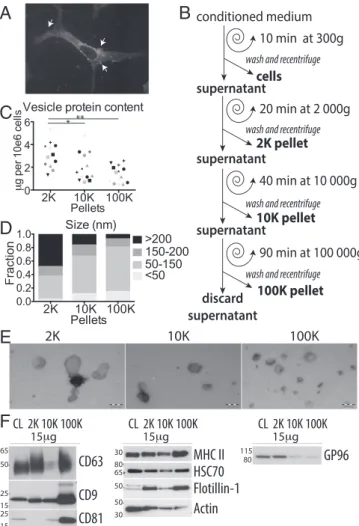
Primary DCs Secrete EVs of Different Sizes.We here analyzed EVs secreted by human primary monocyte-derived DCs. Heteroge-neity in size of EVs recovered by DUC from these cells (13), and the presence of membrane-enclosed structures at the DC surface (Fig. 1A) suggest that they may actively secrete EVs of different intracellular origins. Conditioned medium was collected from DCs after 24-h incubation in medium depleted from FCS-derived EVs, and subjected to DUC, as previously described (11). Pelleted materials recovered by low (2,000× g = 2K) or medium (10,000× g = 10K) centrifugation speed were washed and compared with the ultracentrifugation pellet (100,000× g = 100K), classically considered as containing exosomes (Fig. 1B). The total amount of proteins pelleted at low speed (2K) was significantly higher than the amount pelleted at 10K or 100K (Fig. 1C). In these culture conditions, less than 10% cell death was generally observed, and the amount of material recovered in the 2K pellet did not positively correlate with cell death (Fig. S1A), showing that these large EVs are not apoptotic/necrotic cell fragments. When analyzed by transmission electron micros-copy (TEM), whole-mounts of materials recovered in the 2K pellet showed vesicles in majority larger than 150 nm in diameter (Fig. 1 D and E). In contrast, a majority of vesicles pelleting at 10K and at 100K were of the size generally described for exo-somes (i.e., 50–150 nm), about 10% of the remaining EVs being smaller than 50 nm (Fig. 1 D and E). Nanoparticle tracking analysis confirmed the higher representation of large vesicles in the 10K pellet, resulting in a mean size above 200 nm for the 10K, and below 200 nm for the 100K pellet (Fig. S1B). The total number of particles secreted per cell was slightly smaller in the 10K than 100K pellet (Fig. S1B). Thus, live human primary DCs release a large range of EVs, which are partially separated by their pelleting properties.
Classic Exosome Markers Are also Detected in Other EVs.A few protein markers are often used in the literature to characterize exosomes in mixed sEV populations. We thus compared here their distribution among the other EVs, by analyzing on Western blots the same amount of proteins from each centrifugation pellet or from the secreting cell lysates (Fig. 1F; quantifications of three to nine independent experiments shown inFig. S1C). As expected, tetraspanins (CD9, CD63, CD81) were highly abun-dant in the 100K pellet containing exosomes, but CD63 and CD9 were also present, although to various degrees, in the 2K and the 10K pellets. On the other hand, flotillin-1 (FLOT1), the consti-tutive heat-shock protein HSC70 (HSPA8), MHC class II (HLA-DRA) and actin, as well as MHC class I (HLA-A/B/C/G) and HSP70 (HSP1A1) (Fig. S1D) were not enriched in the 100K pellets compared with the levels in other pellets, and thus could not be considered as sEV- (nor exosome-) specific markers. The exosome-excluded endoplasmic reticulum (ER) protein GP96, also called GRP94 or endosplasmin (HSP90B1), was hardly de-tectable in both the 10K and 100K pellets, but abundant in the 2K pellet and the whole cells (Fig. 1F), suggesting that large EVs contain various parts of the secreting cell.
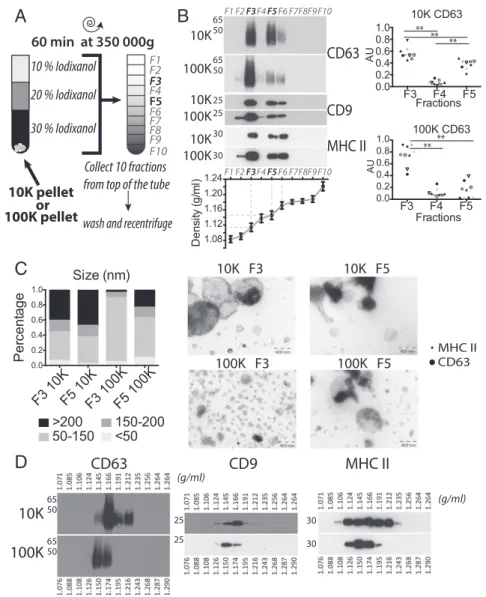
Floatation into Iodixanol or Sucrose Gradients Differently Separates Subtypes of EVs.Because most of the above proteins were not specific for a given type of DUC-isolated EV, our next goal was to set up another separation assay. Density gradients, either of sucrose or iodixanol, are a classic means to separate membrane-enclosed vesicles according to their floatation speed and equi-librium density (2). We first used a self-forming iodixanol (=OptiPrep) gradient to subfractionate the 10K and 100K pel-lets. These pellets were resuspended in Tris buffer containing 30% (wt/vol) iodixanol, and allowed to float into an overlayed gradient during a short (1 h) ultracentrifugation (Fig. 2A). Overlaying the
**
B
C
D
* 2K 10K 100K 2K 10K 100K 0.0 0.2 0.4 0.6 0.8 1.0 Pellets F rac tion Size (nm) <50 50-150 150-200 >200A
E
10 min at 300g 20 min at 2 000g 40 min at 10 000g 90 min at 100 000g conditioned medium 2K pellet 10K pellet 100K pellet cellswash and recentrifuge
wash and recentrifuge
wash and recentrifuge
wash and recentrifuge
supernatant
supernatant
supernatant
discard supernatant Vesicle protein content
2K 10K 100K 0 2 4 6 Pellets gp er 10 e6 ce lls
F
15 g 15 gGP96
80 115 15 gCD63
CD9
CD81
50 65 25 15 25 15Flotillin-1
50MHC II
30 65 80HSC70
30Actin
50 CL 2K 10K 100K CL 2K 10K 100K CL 2K 10K 100KFig. 1. DCs secrete heterogeneous EVs recovered in successive differential ul-tracentrifugation pellets. (A) DC stained with FM 4-64 FX dye and visualized with confocal microscopy. (Magnification, 100×.) Arrows point at vesicles bud-ding at the cell surface. (B) Scheme of EV isolation by DUC from conditioned medium of human monocyte-derived DCs. (C) Protein content of each pellet (2K= 2,000 × g; 10K = 10,000 × g; 100K = 100,000 × g) is represented for in-dividual donors (one symbol per donor), *P< 0.05; **P < 0.01 (Wilcoxon signed-rank test). (D and E) Whole-mount EM analysis of each pellet showing repre-sentative images (E) and size distribution (D) of the vesicles. Diameter of membrane-enclosed structures was determined with iTEM software, for two independent donors (2K n= 35 EVs, 10K n = 72, 100K n = 135). (Scale bars, 200 nm.) (F) The successive pellets (2K, 10K, 100K) of EVs isolated from DCs were analyzed by Western blot side-by-side with the lysate of producing cells (CL), using antibodies to proteins often considered as“exosome-markers.” Equiva-lent protein amounts of each sample were loaded on the gels. Representative images and quantifications in three to nine individual donors (Fig. S1C) are shown. As expected for sEV-markers, tetraspanins (CD63, CD9, CD81) are enriched in 100K, but CD9 and CD63 are also abundant in the 10K and 2K pellets respectively. Other putative sEVs markers (MHC II, HSC70, flotillin-1, ac-tin) are ubiquitously present in the three pellets. The ER-retained protein GP96 is mainly found in cells and the material pelleting at the lowest speed, 2K.
CELL
BIOLOGY
gradient on top of the EV pellet ensured that membrane-enclosed vesicles floated upwards, whereas protein aggregates could not float into the gradient and remained in the dense fractions (14, 15). Ten fractions were recovered and analyzed for the presence of protein markers previously detected in both pellets. As shown in Fig. 2B, materials recovered after either 10K or 100K centri-fugation floated mostly in two discrete fractions of, respectively, on average 1.115 g/mL (third fraction= F3) and 1.145 g/mL (fifth fraction = F5) of iodixanol. These four different fractions all contained vesicles bearing MHC class II, but also tetraspanins (CD9 and CD63), although CD63 was not very abundant in the dense fraction from the 100K pellet (so-called F5-100K). Each fraction was analyzed as whole-mounts by TEM (Fig. 2C): the F3-100K pellet contained a vast majority of vesicles of 50– 150 nm in diameter, whereas all of the other fractions contained
larger vesicles as well, sometimes with dense cores. Thus, floa-tation into iodixanol gradients allows separation of subtypes of EVs displaying different buoyant densities and sizes, with sEVs strongly enriched in the light fraction of the high-speed ultra-centrifugation pellet (F3-100K).
In contrast, floatation of the 10K and 100K pellets into overlayed sucrose led to a continuum of fractions containing MHC class II and tetraspanins, ranging from densities of 1.12– 1.19 g/mL for the 100K pellet, and 1.12–1.21 g/mL for the 10K pellet (Fig. 2D), corresponding to the density range classically assigned to sEVs [1.13–1.19 g/mL (2)]. The majority of EVs floated at 1.15 g/mL for the 100K pellet and at 1.17 g/mL for the 10K pellet: that is, at different densities but in adjacent fractions, which did not allow accurate separation for further analysis. The difference in separation of vesicles in sucrose versus iodixanol
C
10K F3 10K F5 100K F3 100K F5A
B
D
10K
100K
CD9
CD63
MHC II
65 50 65 50 30 25 30 25 (g/ml) (g/ml) MHC II CD63 10K 100K 10K 100K 30 30 25 25 65 50 65 50 10K 100KCD9
MHC II
F1 F2F3F4F5F6 F7F8F9F10CD63
F1 F2F3F4F5F6 F7F8F9F10 10K pellet 100K pellet 30 % Iodixanol 20 % Iodixanol 10 % Iodixanol 60 min at 350 000g Collect 10 fractions from top of the tube wash and recentrifuge F1 F2 F3 F4 F5 F6 F7 F8 F9 F10 or F3 F4 F5 0.0 0.2 0.4 0.6 0.8 1.0 10K CD63 Fractions AU F3 F4 F5 0.0 0.2 0.4 0.6 0.8 1.0 100K CD63 Fractions A U ** ** ** ** ** F3 10KF5 10KF3 100KF5 100K 0.0 0.2 0.4 0.6 0.8 1.0 Pe rc en ta ge Size (nm) <50 50-150 150-200 >200 1.08 1.12 1.16 1.20 1.24 De ns ity ( g/ ml )Fig. 2. Floatation on iodixanol gradient separates four subfractions of EVs. (A) Pellets obtained after 10K and 100K centrifugations were allowed to float into an overlayed iodixanol gradient. (B) Ten fractions were collected and analyzed by Western blot (representative of nine experiments), showing the separation of two discrete fractions (F3 and F5+F6) of EVs from both the 10K and 100K pellets (Left). Densities of recovered fractions, as measured by re-fractometry, are displayed in the graph (mean± SD of 36 independent gradients). (Right) Quantification of CD63 relative abundance in fractions F3–F5 of both pellets obtained from nine individual donors was performed as inFig. S1C. Arbitrary Units (AU)= (SIfraction)/Sum(SIF3+ SIF4+ SIF5) where SI= signal intensity. Each symbol represents a single donor. **P< 0.01 (Wilcoxon signed-rank test). (C) Representative images of whole-mount EM of fractions three and five of 10K and 100K (Right), and size distribution of vesicles measured by ImageJ software (Left: F3 10K n= 98, F5 10K n = 99, F3100K n = 226, F5 100K n = 166, representative of two independent gradients). (Scale bar, 400 nm.) (D) Separation of 10K and 100K pellets on sucrose gradients analyzed by Western blot shows continuous distribution between 1.12 and 1.19 g/mL for both pellets, and a tendency for 10K to achieve equilibrium in denser fractions (1.17 and above) than 100K (1.15+ 1.17).
could be a result of differences in the osmotic pressure of these two gradients (16), potentially affecting the EVs.
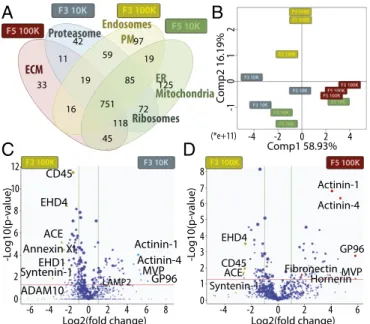
Quantitative Proteomic Analysis of Four Fractions of EVs Obtained upon Iodixanol Floatation.Extensive proteomic analysis was then performed simultaneously on the four individual fractions re-covered from iodixanol gradient floatation of the 10K and the 100K pellet (i.e., F3-10K, F5-10K, F3-100K, F5-100K) from three biological replicates, and the respective amount of identi-fied proteins in these different samples was quantiidenti-fied by a label-free approach. Qualitative analysis, evaluating the presence of proteins identified by at least three distinct peptides, showed that the majority of proteins were common to several fractions, but also that each fraction contained a restricted set of unique pro-teins (Fig. 3A,Table S1, andDataset S1). Gene Ontology (GO) term enrichment analysis of these unique proteins showed spe-cific accumulation of ribosome proteins in both F3 and F5 fractions of the 10K pellet, of both mitochondrial and ER pro-teins in F5-10K, and of proteasome propro-teins in F3-10K. In the 100K pellet, extracellular matrix proteins (ECM) were specifi-cally present in the F5 fraction (e.g., collagen, COL6A3; PEDF, SERPINF1) (Table S1), whereas PM and endosomal proteins were accumulated in the light fraction (F3).
Because most proteins were common to all fractions, we then performed a quantitative comparison of their respective amount in the different fractions compared with F3-100K (Dataset S2).
Principal component analysis (PCA) of these quantitative com-parisons (Fig. 3B) showed a clear separation of F3-100K from the other three fractions, especially from F5-100K. GO term classification of proteins more abundant in F5-100K compared with F3-100K highlighted extracellular space, and mitochondrial and ribosome components, whereas, conversely, F3-100K was enriched in proteins found in the PM and endosome (Fig. S2, Left). This enrichment in endosomal and PM components in F3-100K was also observed compared with F3-10K, which, in con-trast, contained more mitochondrial components (Fig. S2, Right). Volcano plot representation of the relative abundance in F3-100K and F3-10K (Fig. 3C) identified a few proteins significantly (P< 0.05) or more than fourfold enriched in F3-100K: for ex-ample, Annexin XI (ANXA11), EH domain-containing proteins 1 and 4 (EHD1, EHD4), angiotensin-converting enzyme (ACE), syntenin-1 (SDCBP), and “a disintegrin and metalloproteinase domain-containing protein 10” (ADAM10). On the other hand, actinins 1 and 4 (ACTN1 and ACTN4), major vault protein (MVP), and endoplasmin GP96 (HSP90B1) were over fourfold enriched in F3-10K (Fig. 3C). Similar comparison of F3-100K with F5-100K (Fig. 3D) also showed enrichment of actinins, GP96 and MVP, in F5-100K, and highlighted a few proteins specifically enriched in the F5-100K but not the F3-10K fractions (Dataset S2): ECM proteins like fibronectin (FN1) and hornerin (HRNR), serum-derived proteins such as prothrombin (F2), pigment epithelium derived factor (PEDF or SERPINF1), and complement (C3, C4A) (Table S1).
Thus, extensive and quantitative proteomic analysis of EVs separated by DUC followed by iodixanol gradient demonstrates the presence of vesicles with different protein content as well as physical properties.
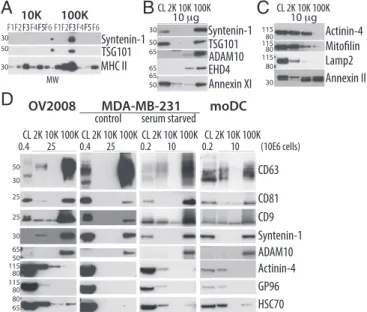
Identification of Specific Markers of Either Large or Small EVs.We next asked whether our comparative proteomic analysis could allow identifying specific markers of the sEVs, or of the large PM-derived EVs. Among the proteins uniquely present (Table S1), or either highly or significantly enriched (Fig. 3 C and D) in F3-100K, we selected tumor susceptibility 101 (TSG101), syntenin-1, EHD4, Annexin XI, and ADAM10. Conversely, unique or enriched proteins in the other fractions included actinin-4 and mitofilin. We confirmed specific enrichment in F3-100K of the first two proteins (Fig. 4A). When differential centrifugation pellets were analyzed as in Fig. 1 for presence of these markers, we observed a very striking enrichment of syntenin-1, EHD4, and ADAM10 in the 100K pellet, as compared both to the other pellets and to the secreting cells (Fig. 4B; quantifications of three to five independent experiments shown in Fig. S3A), and of TSG101 and Annexin XI compared with the other pellets (but not to the secreting cells), suggesting that these proteins are more specific markers of the sEVs than the commonly used CD63 and CD9 tetraspanins (compare Figs. 1F and 4B). In contrast, Annexin II, which was less than twofold enriched in F3-100K (Dataset S2), was strongly detected by Western blot in both the 10K and 100K pellets (Fig. 4C andFig. S3A). On the other hand, actinin-4 and mitofilin qualified as markers of the large-and medium-sized EVs, because both were highly abundant in the 2K and 10K pellets and not in the 100K pellet (Fig. 4C and
Fig. S3A), whereas lysosomal-associated membrane protein 2 (LAMP2; enriched twofold in F3-10K) (Fig. 4C andDataset S2) and GP96 (Fig. 1F) were similarly detected at low levels or similarly absent in 10K and 100K pellets, hence not discriminant markers of the intermediate-sized EVs.
Distribution of the New Markers on EVs Secreted by Other Cell Types. To determine whether the newly identified set of proteins could also be used to characterize EVs secreted by other cells, we analyzed EV secretion by several human cell lines: five tumoral [OV2008 and MDA-MB-231 (Fig. 4D), IGROV-1, SHIN-3, and
A
B
C
D
Log2(fold change) CD45 EHD4 EHD1 Syntenin-1 ADAM10 Annexin XI ACE LAMP2 Actinin-1 Actinin-4 MVP GP96 8 6 4 2 0 -2 -4 -6 8 6 4 2 0 10 -L og10(p -value) 12 Log2(fold change) Actinin-1 Actinin-4 Fibronectin EHD4 ACE CD45 8 6 4 2 0 1 -L og10(p -value) 3 5 7 4 2 0 -2 -4 6 MVP GP96 Syntenin-1 Hornerin Proteasome ER Mitochondria ECM Ribosomes 751 45 59 97 Endosomes PM 125 42 11 33 16 19 85 19 72 118 Comp1 58.93% C omp2 16.19% (*e+11) -4 -2 0 2 4 -1 1 2 0Fig. 3. Qualitative and quantitative proteomic analyses of iodixanol frac-tions F3 and F5 from 10K and 100K pellets by LC-MS/MS suggest different intracellular origins of the four types of EVs, and identify potential specific proteins. (A) Venn diagram showing the distribution of proteins qualitatively identified in each fraction by at least three peptides in one of the three biological replicates. GO terms of protein families specifically enriched in a single fraction (or in two fractions for ribosomes), as determined by DAVID software, are shown. (B–D) Quantitative analysis of the amount of proteins in each fraction compared with F3-100K was performed (proteins displaying missing values among fractions were excluded from this analysis). (B) PCA analysis of the quantitative comparison shows a clear separation of fraction F3-100K from the three others. (C and D) Quantitative analysis of proteins present in F3-10K (C) or F5-100K (D) compared with F3-100K is shown as Volcano plot. x axis= log2(fold-change) (10K/100K), y axis= −log10(P value). The horizontal red line indicates P value= 0.05, vertical green lines indicate absolute fold-change= 2. Data represent results of three independent sets of donors pooled together. Position of proteins selected as potential specific markers of each fraction and analyzed further is shown.
CELL
BIOLOGY
HeLa cells (Fig. S3B)] and two immortalized nontumor cell lines [HEK293T and RPE-1 (Fig. S3B)]. Because these cell lines re-leased fewer EVs than human primary DCs, especially in the 2K pellet, materials recovered from a given number of secreting cells (rather than equal protein amounts) were loaded for Western blot analysis. In all these cell lines, sEVs (100K pellet) contained the proteins most enriched in the corresponding DC-derived pellet (syntenin-1, ADAM10, and CD81), as well as CD63 and CD9, and were devoid of the proteins enriched in other EVs (actinin-4, GP96). Most cell lines released very little material pelleting at 2K or 10K, except the ovarian carcinoma OV2008, in which both low- and medium-speed pellets contained, like in DCs, actinin-4, HSC70, and some CD9 and CD63 (Fig. 4D). These molecules could also be detected in the 2K pellets re-covered from MDA-MB-231 exposed to starvation, which in-duces secretion of large EVs, as described by others (17) and confirmed in our hands (shown by SYPRO orange-staining of the gel) (Fig. S3C). Like in human monocyte-derived DCs, we observed in mouse bone marrow-derived DCs the secretion of a wide-range of EVs and similar behavior of the markers (e.g., syntenin-1, TSG101) in the different types of EVs (Fig. S3D). Of
note, however, fewer large EVs pelleting at 2K and more medium-sized EVs at 10K were recovered, and consequently more specific association of CD63 with the 100K pellet, and more actinin-4 in the 10K pellet than in human DCs were ob-served (Fig. S3D). Thus, in EVs recovered from murine DCs and different human cell lines, several markers behave as they do in EVs from human DCs.
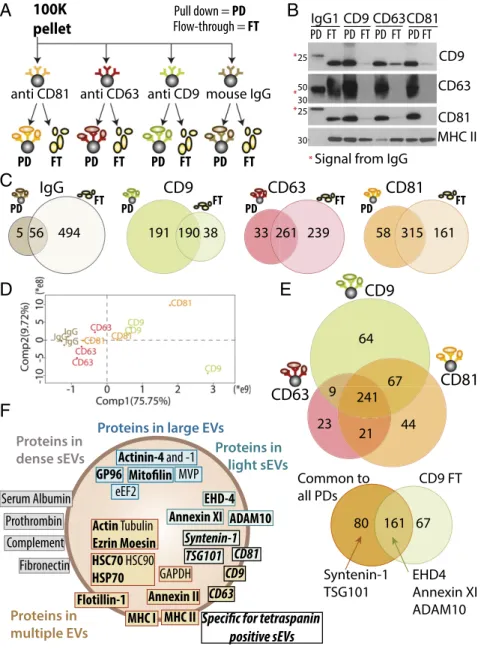
Separation of sEV Subtypes by Immuno-Isolation with Antitetraspanin Antibodies. Finally, to analyze the heterogeneity of the sEVs re-covered in the 100K pellet of ultracentrifugation, we performed a final separation step by immuno-isolation using beads coated with antibodies targeting either CD9, CD63, or CD81 (Fig. 5A). To re-cover information not only on sEVs bearing these tetraspanins, but also on those devoid of them, we compared the pulled-down (PD) EVs with the EVs remaining in the flow-through (FT). Specificity of the immuno-isolation was verified using beads bearing an irrelevant antibody (IgG). Side-by-side comparison by Western blot (Fig. 5B) of the PD and FT performed with anti-CD9 beads showed that all CD9-, all CD63-, and all CD81-bearing EVs had been captured, but that abundant MHC II-bearing EVs had escaped capture and were detected in the FT. Therefore, the sEV pellet contains both CD9+ and CD9−MHC II-bearing EVs. Upon capture by anti-CD63– coated beads, not only MHC II, but also clear CD9+and some CD81+signal remained in the FT, whereas CD81-coated beads isolated all of CD63, and almost all CD9 signal. These results suggest that CD63-bearing sEVs represent a subpopulation, which also bears the other tetraspanins, but that CD63−EVs bearing CD9 or CD81 are also present. Full proteomic analysis of all these fractions was then performed and evidenced over 1,450 proteins, of which 700 were detected with at least three peptides in three bi-ological replicates of at least one immuno-isolation (Fig. 5 C and E andDataset S3). Sixty-one of these proteins were also isolated by the irrelevant IgG-coated beads. In addition to sticky or very abundant proteins that are recovered nonspecifically in numerous immunoprecipitation (IP) experiments (crapome.org) (18)—such as
cytoskeleton and heat-shock proteins, elongation factors, and his-tones—some of the F5-100K-enriched proteins were recovered in the IgG-PD: MVP, hornerin, complement C3, and serum albumin. Abundant presence of some transmembrane proteins [especially αM/αXβ2 integrins (ITGAM, ITGAX, ITGB2) and CD45 (PTPRC )], suggests that these proteins are associated to a subpopulation of EVs able to bind IgG or protein A. These proteins were excluded from the rest of the analysis.
Efficacy of the immuno-isolation with each specific antibody was confirmed by the identification of each immuno-isolated tetraspanin in its PD, but not in the FT (Dataset S3). Fewer proteins were recovered in the FT of CD9 (228), than anti-CD81 (476), and anti-CD63 (500). Conversely, fewer proteins were recovered in the PD of anti-CD63 (294), than anti-CD81 (373) and anti-CD9 (381), thus confirming that CD63 is present on a more restricted sEV subpopulation. Quantitative compari-son of the PD proteins followed by PCA (Fig. 5D) also showed that CD63-PDs were distinct from both CD9- and CD81-PD. Fifty-one percent of proteins were PD by the three antibodies (241 of 469) (Fig. 5E). Of these common proteins, a majority (161) (Fig. 5E, Lower) was also identified in the FT of anti-CD9, and is thus common to all sEVs. Among our newly identified sEV-specific proteins, Annexin XI, EHD4, and ADAM10 belong to this category. In contrast, two of our sEV markers were spe-cific to the tetraspanin-enriched sEVs: TSG101 and syntenin-1.
GO term analysis was performed to determine the intracellular origin of the different EVs. In all tetraspanin PD and all FT, the most significantly enriched terms were those associated to EVs (i.e., extracellular-exosome, -vesicle, -organelle). Proteins common to CD9-, CD63-, and CD81-PD and excluded from the FT (Fig. 5D, Lower) displayed significant enrichment of several endosome-related terms (endosome, endocytic, phagocytic, and so on), with
A
B
C
30 10K MHC II TSG101 Syntenin-1 50 30 100K F1F2F3F4F5F6 F1F2F3F4F5F6 CL 2K 10K 100K 10 g ADAM10 65 50 TSG101 Syntenin-1 30 EHD4 Annexin XI 65 65 50 Actinin-4 Lamp2 10 g 80 115 80 115 80 115 30 Annexin IID
OV2008 CL 2K 10K 100K 0.4 25 80 115 30 65 25 25 80 115 50 80 65 50 30 MDA-MB-231 serum starved CL 2K 10K 100K moDC Syntenin-1 Actinin-4 ADAM10 CD81 GP96 HSC70 CD9 CD63 0.4 25 0.2 10 0.2 10 (10E6 cells) control CL 2K 10K 100K CL 2K 10K 100K CL 2K 10K 100K MWFig. 4. Confirmation of selected proteins as specific markers of distinct vesicles subpopulation. (A) Western blotting of iodixanol fractions of 10K and 100K confirms the unique presence of TSG101 and syntenin-1 in fraction F3-100K. MW, molecular weight markers. (B and C) Western blot analysis, performed as in Fig. 1F, of the distribution, among the successive pellets of differential centrifugation (2K, 10K, 100K), of selected proteins identified by the quantitative proteomic analysis. Representative images are shown and, quantifications in two to five experiments are displayed in Fig. S3A. As expected from their enrichment in F3-100K, syntenin-1, TSG101, ADAM10, EHD4, and Annexin XI are strongly enriched in 100K and almost absent in the other pellets (B). Conversely, as expected from their enrichment in F3-10K, actinin-4, and mitofilin are enriched in 10K compared with 100K, but they are also present in 2K (C). Proteins which were less than twofold enriched in either fraction, such as LAMP2 or Annexin II did not show, upon Western blotting, differential expression in 10K vs. 100K pellets (C ). (D) Western blot analysis of the secretion of various proteins in the different centrifugation pellets recovered from conditioned medium of tumor cell lines OV2008, MDA-MB-231 (in control or serum-starved conditions), com-pared with DCs. The 2K, 10K, and 100K pellets obtained from the same number of cells were loaded on the gel, side-by-side with CL from the in-dicated number of cells. Presence of syntenin-1 and ADAM10 and enrich-ment of CD9/CD63/CD81 was confirmed among all cell lines in 100K pellets. Presence of CD9, CD63, actinin-4 and HSC70 was confirmed in the 2K pellets of cell lines secreting large EVs [i.e., OV2008 and MDA-MB-231 under star-vation (no serum) conditions].
P values lower than 10−5, whereas proteins found exclusively in the FT did not display endosome enrichment. These results suggest that the nontetraspanin-bearing EVs do not correspond to the original definition of exosomes (i.e., endosome-derived sEVs). Among the tetraspanin-enriched sEVs, the subpopulation bearing CD9 in the absence of CD63 and CD81 contained 64 specific proteins and displayed enrichment in PM and endocytic vesicle terms, but not in
other endosome terms (Fig. 5E). Integrinα2B (ITGA2B or CD41) was specifically pulled down with CD9. This integrin was previously shown to be enriched in medium-sized EVs released by platelets (19). Therefore, the subpopulation of CD9-single positive sEVs probably forms at the PM and early endocytic locations.
Fig. 5F summarizes the respective association to EV subtypes of the major proteins analyzed here: these proteins were previously
CD63CD81 CD9 IgG1 PD FT PD FT PD FT PD FT CD63 CD81 CD9 MHC II * * *
*Signal from IgG
A
B
CD9
PD FTCD63
CD81
IgG
C
D
E
CD9
CD63
CD81
5 56 494 191 190 38 33 261 239 58 315 161 64 241 67 9 21 23 44100K
pellet
mouse IgG anti CD9 anti CD63 anti CD81 Pull down = PD Flow-through = FT PD FT PD FT PD FT PD FTF
Prothrombin Serum Albumin Proteins indense sEVs Proteins in light sEVs
Proteins in multiple EVs
Proteins in large EVs
Syntenin-1 Actinin-4 and -1 CD63 CD9 MHC II MHC I eEF2 GP96 HSC70 HSC90 HSP70 Actin Tubulin Ezrin Moesin ADAM10 TSG101 Flotillin-1 Annexin XI Annexin II GAPDH MVP Fibronectin Complement CD81 EHD-4
positive sEVs
80 161 67 CD9 FT Common to all PDs Syntenin-1 TSG101 EHD4 Annexin XI ADAM10 PD FT PD FT PD FT 25 25 50 30 30Fig. 5. Qualitative and quantitative proteomic analyses of sEVs immuno-isolated by CD9, CD63, or CD81-specific antibodies evidence additional sEV subpopu-lations. (A) The crude DC-derived 100K pellet was subjected to parallel immuno-isolation with beads coupled to irrelevant murine IgG, or antibodies against CD9, CD63, or CD81. PD vesicles and nonpulled down materials remaining in the FT were subjected to subsequent comparative analysis. (B) Equal volumes of materials from each PD and FT (the latter after concentration by ultracentrifugation) were loaded on a gel for Western blot analysis with antibodies specific for CD9, CD63, CD81, or MHC class II. All beads precipitated efficiently vesicles bearing the targeted protein. Note the remaining presence of CD9+and CD81+materials in the FT of CD63-beads, and of MHC II+materials in the FT of all immuno-isolations, showing the existence of tetraspanin-negative sEVs. *Nonspecific signal from the immunoglobulins’ heavy (50 kDa, CD63 blot) or light (25 kDa, CD9 and CD81 blots) chains used for immuno-precipitation. (C) PD and FT obtained as shown in A and B were analyzed by label-free LC-MS/MS. Venn diagrams represent the number of proteins detected in each sample with minimum three peptides in each of three independent replicates, comparing PD and FT obtained from each antibody after exclusion of the 61 proteins present in the PD of irrelevant IgG. (D) Quantitative PCA shows that the CD63-PD are distinct from the CD81- and CD9-PD. (E) Venn diagram showing proteins identified in PD obtained from the three antitetraspanin antibodies (Upper), and distribution of the 241 proteins common to the CD9-, CD63-, and CD81-PD, compared with the FT of CD9 (Lower). Position of sEV-specific proteins is indicated. (F) Assignment of the proteins analyzed here, and previously described as canonical exosome markers, to the dif-ferent types of EVs, as demonstrated by Western blotting (bold) or by the quantitative proteomic comparison. EVs are schematized as a lipid bilayer (thick brown circle) enclosing cytosol (light background). Brown: proteins shared by several types of EVs. Green: proteins specifically enriched in F3-100K (i.e., the light sEVs), including those specific of the tetraspanin-enriched endosome-derived exosomes (italic font), and those ubiquitously present in all sEVs. Gray: proteins coisolated with the small EVs (100K pellets) but in EVs of higher density (F5-100K). Blue: proteins specifically enriched in large and medium-sized EVs.
CELL
BIOLOGY
described in sEVs (i.e., 100K pellets) secreted by mouse DCs (20) and other cells (21, 22), and listed by us as components of “ca-nonical exosomes” (23), but our results now show that only a restricted subset of these proteins represent sEV-specific mark-ers, among which a subfraction is associated to tetraspanin-enriched EVs corresponding to endosome-derived exosomes. Discussion
The work presented herein provides: (i) two possible flow-charts for comprehensive analysis of mixed EVs, which we think should be performed initially on any given source of EVs: successive centrifugations followed by either floatation or parallel immuno-precipitation with three different tetraspanin-specific antibodies; (ii) a comprehensive comparative proteomic analysis of different subtypes of EVs of different sizes, densities, and tetraspanin composition secreted by a single cell type; and (iii) a confirma-tion, for some proteins identified by the above analysis, of their selective presence in one or the other subtype of EVs, coming from a variety of different cells.
Based on this analysis, we would like to propose the following categorization of EVs, which could be applied to any source of EVs, from cultured cells or from biological fluids: (i) large EVs pelleting at low speed, (ii) medium-sized EVs pelleting at in-termediate speed, and (iii) sEVs pelleting at high speed. Among the sEVs, four subcategories can be defined: (iiia) sEVs coen-riched in CD63, CD9, and CD81 tetraspanins and endosome markers (i.e., bona fide exosomes); (iiib) sEVs devoid of CD63 and CD81 but enriched in CD9 (associated with PM and an early endocytic signature); (iiic) sEVs devoid of CD63/CD9/CD81; and (iiid) sEVs enriched in ECM or serum-derived factors, the latter two categories not being associated to the endosomal pathway. To distinguish these categories, we propose the concomitant use of the following combination of markers (summarized in Fig. 5F): (i) any cell membrane protein can be used to demonstrate the vesicular nature of the analyzed materials, for example MHC I and MHC II, which are present in all EVs of DCs; (ii) GP96 and possibly other ER-associated proteins are mainly present in large EVs; (iii) actinin-4 and mitofilin, and possibly other mitochondrial proteins, are present in both large and medium-sized EVs but ab-sent from the sEVs; (iv) syntenin-1, TSG101, ADAM10, and EHD4 are only present in the sEVs, syntenin-1 and TSG101 being specific of the tetraspanin-enriched sEVs representing bona fide “exo-somes”; and (v) ECM (collagen, PEDF = SERPINF1), complement (C3, C4A), and serum-derived factors (prothrombin, serum albu-min) represent sEV-bound components of variable presence.
The fifth group of markers contains the proteins we observed specifically enriched in the F5-100K fraction and underrepre-sented in the 10K fractions and immuno-isolated by a non-specific IgG (Fig. 3D,Table S1, andDatasets S2andS3). This list includes various keratins (classically considered contaminants of proteomic analyses), collagen (C04A), fibronectin, an ECM protein previously described in trophoblast or tumor cell-derived exosomes (17, 24), and hornerin, a S100 family member also found in the ECM of breast tumors (25). In addition, Comple-ment (C3 and C4A), PEDF and prothrombin (F2), probably come from the serum used for culture and associate extracellu-larly with EVs after their secretion. The molecular mechanisms leading to association of such proteins to sEVs need further investigations, but our observations suggest that ECM and co-agulation/complement proteins represent a particular category of sEV-associated components.
A major result of our work is that some proteins often used as “exosome markers,” such as MHC class II or class I molecules, heat-shock proteins 70 (constitutive HSC70/HSP73 and induc-ible HSP70/HSP72), flotillins, or actin, are present in all types of EVs, and thus cannot be considered as either exosome- or even sEV-specific markers (Fig. 1 andFig. S1). We propose, however, newly validated sEV-specific, and among them exosome-specific,
proteins to be used as markers. To obtain these results, it was necessary to combine several separation procedures and to fol-low a nonbiased approach, rather than a molecule- or EV sub-type-targeted one. Some groups have recently performed comparative proteomic analyses of medium-sized and small EVs (with or without floatation into a gradient) from platelets (19) or tumor cells (26–29). Another group has compared the ex-pression of a few surface proteins on B lymphoma-EVs immuno-precipitated with either CD9, CD63, or CD81 (30). Our results are consistent with these other recent works, especially in iden-tifying sEV-enriched proteins (e.g., TSG101 and CD81). How-ever, our comparison of several additional subtypes of EVs leads to a higher refinement of definitions. We took advantage of an interesting observation that short-term floatation (i.e., upward displacement) into iodixanol gradients allows separation of dis-crete EV subtypes pelleted at the same speed but displaying different buoyant densities (Fig. 2B). Of note, however, this floatation protocol would not separate medium and small EVs if they had not been first separated by another means (here: cen-trifugation). In contrast, a sucrose gradient separated the me-dium and small EVs in two adjacent fractions of slightly different densities (respectively 1.17 and 1.15 g/mL) (Fig. 2D). Thus, heterogeneous EVs would have been separated with this ap-proach, but with too much overlap and potential mixing to allow clear-cut differentiation by proteomic quantitation.
In addition to these gradient-mediated separations, sEV immuno-isolations with the three tetraspanins, and their com-parative proteomic analysis with the remaining sEVs escaping PD demonstrated that some protein markers are really unique to a subclass of sEVs, whereas some others are generic. In partic-ular, Annexin XI (but also Annexins V and VI) (Dataset S3), ADAM10, ACE, and EHD4 are present in all sEVs. Flotillins were also found in all sEVs, bearing or not tetraspanins, which probably explains why they were recovered in different sucrose gradient fractions than CD63 in tumor-derived EVs (31). The GO term enrichment analysis and the identity of proteins found in the tetraspanin-bearing sEVs confirm their relationship with the endosomal pathway, but also that sEVs can originate along different stages of this pathway. For example, tetraspanin-sEV–specific markers include syntenin-1 [involved in receptor targeting to intraluminal vesicles of MVBs (31)] and some of the endosomal sorting complex required for transport (ESCRT) proteins, TSG101, CHMP4A-B, and VPS4B (Fig. 5E and Dataset S3). Interestingly other ESCRT- or endosome-associated proteins [e.g., ALIX (PDC6IP) and EHD1] are fully coimmunoprecipitated with CD9, but not with CD63 and CD81, suggesting that formation of some CD9-bearing sEVs involves a fraction of the endosomal machinery. Presence of some specific transmembrane proteins in the CD9+ sEVs (e.g., integrin α2B, matrix metalloproteinase MMP14) (Dataset S3) will allow researchers to specifically isolate this subtype in the future.
Given the more restricted set of sEVs captured via CD63, and the general enrichment of CD63 in late endosomes (32), it is tempting to propose anti-CD63 as the preferred approach to isolate endosome-derived exosomes among the sEVs. Some cell types, however, secrete sEVs devoid of CD63 (30, 33, 34), and for these it will be necessary to analyze instead either CD81- or CD9-bearing sEVs. In addition, given its presence in large EVs, CD63 cannot be used as specific exosome-isolation tool without a first step of elimination of these large EVs.
Finally, our results will also provide leads to identify specific markers of the medium-sized EVs, which probably correspond to large oncosomes described in some tumor cells (27, 35, 36). We show here that actinin-4 is abundant in medium-EVs, and un-derrepresented in sEVs. The group of Di Vizio proposed to use cytokeratin 18 (KRT18) as a marker of oncosomes (27): it may be a specific marker of tumor-derived medium size-EVs, because we did not observe this keratin enriched in our proteomic analysis.
Furthermore, given the known classic nonspecific identification of keratins in all proteomic studies, we preferred not to focus on these molecules. Comparing the molecular signatures of tumor-(26–29) and DC-derived (our work) medium EVs will surely provide additional specific markers. So far, we have not identified a protein that would be exclusively in medium EVs, and not also in the largest ones, which the other groups working on tumor-derived EVs did not evaluate: although it would be very useful, finding a specific marker for these particular EVs may be challenging.
The knowledge we provide herein, of which proteins to use as markers of different EV subtypes, will now be crucial to inves-tigate the specific molecular machineries required for their bio-genesis and secretion. These future studies will allow obtaining tools for selective inhibition or promotion of secretion each type of EV, a necessary approach to understand their physiological and pathological functions in vivo. Although several intracellular proteins (e.g., of the RAB, ESCRT, or SNARE families) have already been described as required for“exosome” biogenesis and secretion (reviewed in ref. 7), the effect of these machineries on secretion of the other EV subtypes was in most cases not in-vestigated. We propose that any new drug, gene-inhibiting tool, or treatment claiming specific effects on a population of secreted EVs (especially on exosomes) should be systematically tested for its effects on other EVs. These investigations will crucially benefit from the knowledge of which specific protein markers to analyze, provided by our work.
Generation of these comprehensive maps of EV subtypes and their biogenesis/secretion machineries, together with new ongo-ing developments of techniques and protocols, will be crucial to unravel the complexity of the EV (and non-EV) network of circulating components present in biological fluids, and their respective value as biomarkers or therapeutic tools.
Materials and Methods
Cells. Monocyte-derived DCs were obtained from blood samples of healthy human donors as described in ref. 13. This study was conducted according to the Helsinki Declaration, with informed consent obtained from the blood donors, as requested by our Institutional Review Board. Peripheral blood mononuclear cells were purified by density gradient centrifugation (LymphoPrep, Axis Shield). CD14+cells were enriched by magnetic sorting (Miltenyi Biotec) and cultured at 1–2 million cells per mL for 5 d in RPMI 1640 (Gibco) supplemented with 10% FCS (Biowest), 50μM 2-ME, 10 mM Hepes, 100 IU/mL penicillin and 100 μg/mL streptomycin (Gibco) in the presence of IL-4 and GM-CSF (50 ng/mL and 100 ng/mL, respectively; Miltenyi Biotec). Cell lines HEK293T, RPE-1 (37), HeLa-CIITA (32), MDA-MB-231, SHIN, IGROV-1 (38), and OV2008 were cultured in DMEM-glutamax (or RPMI-DMEM-glutamax for IGROV-1) supplemented with 10% FCS (Lonza), 100 IU/mL penicillin, and 100μg/mL streptomycin (Gibco). Reagents. Antibodies for Western blot were: mouse monoclonal anti-human CD63 (clone H5C6, BD Biosciences), CD9 (clone CBL162, Millipore), CD81 (clone B-11, Santa-Cruz), flotillin-1 (clone 18/Flotillin-1, BD Biosciences), MHC class II [1B5 hybridoma anti-DRa (39)], actin (clone c4, Millipore), ADAM10 (clone #163003, R&D Systems), HSP70 (clone C92F3A-5, Enzo Life Science), MHC class I [HC10 (40)+ HCA2 (41) hybridomas], anti-TSG101 (clone 51/TSG101, BD Biosciences); polyclonal mouse anti-human ALIX (Abnova); rat mono-clonal anti-human HSC70 (clone 1B5, Enzo Life Sciences), and GP96 (clone 9G10, Enzo Life Sciences); rabbit polyclonal anti-human Annexin II (Gene-tex), Annexin XI (Gene(Gene-tex), actinin-4 (Gene(Gene-tex), mitofilin (Pierce Antibodies), EHD4 (gift from Steve Caplan, National Institutes of Health, Bethesda), and syntenin-1 (gift from Pascale Zimmerman, Centre de Recherche en Cancér-ologie de Marseille, France, or rabbit monoclonal clone EPR8102, Abcam); rabbit monoclonal anti-human LAMP2 [rabbit, clone EPR4207 (2), Genetex]. HRP-coupled secondary antibodies were purchased from Jackson Immuno-Research. Ultrapure Sucrose and iodixanol (Optiprep) were from Sigma. Lipid staining was performed with FM 4-64 FX dye (Life Technology): briefly cells were seeded on poly-L-lysine–coated glass coverslips overnight, placed on ice, stained for 5 min, and then fixed with ice-cold formaldehyde 4% (Electron Microscopy Sciences).
EV Isolation. Bovine EV-depleted medium was obtained by overnight ultra-centrifugation at 100,000× g in a 45Ti rotor, of medium supplemented with 20% FCS. On day 5 of culture (DCs) or when subconfluence was reached (cell lines), cells were washed in PBS (Gibco) and further cultured in EV-depleted medium (10% EV-depleted FCS final) or in DMEM-Glutamax without FCS (MDA-MB-231 exposed to starvation) for 24 h before collection of conditioned medium for EV isolation. EVs were isolated by differential ultracentrifugation as previously described (11) (Fig. 1A). Briefly, conditioned medium was centrifuged at 300× g for 10 min at 4 °C to pellet cells. Supernatant was centrifuged at 2,000× g for 20 min at 4 °C (2K pellet), transferred to new tubes, and centrifuged in a 45Ti rotor (Beckman) for 40 min at 10,000× g (9,000 rpm= 10K pellet), and finally for 90 min at 100,000 × g (30,000 rpm = 100K pellet). All pellets were washed in 50–60 mL of PBS and recentrifuged at the same speed before being resuspended in 50–100 μL of sterile PBS. Cells recovered from the first 300× g pellet were pooled with cells detached from the plates by incubation at 4 °C in PBS-EDTA (DCs) or in trypsin-EDTA (ad-herent cells) (Gibco) and counted by Countess (Invitrogen). Viability was assessed by Trypan Blue stain 0.4% (Life Technologies) exclusion.
Iodixanol/Optiprep Gradient Separation. For iodixanol gradient separation, pellets obtained by ultracentrifugation from 80 to 200 million DCs were washed and resuspended in 1.5 mL buffer containing: 0.25 M sucrose, 10 mM Tris pH 8.0, 1 mM EDTA (pH 7.4), transferred to a SW55Ti rotor tube (Beckman), and mixed 1:1 with 60% (wt/vol) stock solution of iodixanol/ Optiprep. A 40% iodixanol working solution was prepared [40% (wt/vol) iodixanol, 0.25 M sucrose, 10 mM Tris pH 8.0, 1 mM EDTA, final pH set to 7.4] and used to prepare 20% and 10% (wt/vol) iodixanol solutions. Next, 1.3 mL 20% (wt/vol) iodixanol and 1.2 mL 10% iodixanol were successively layered on top of the vesicle suspension and tubes were centrifuged for 1 h at 4 °C at 350,000× g (54,000 rpm) in SW55Ti (stopping without break); 10 fractions of 490μL were collected from the top of the tube. Density was assessed with a refractometer (Carl Zeiss). Fractions were diluted with 2.5 mL PBS and centrifuged for 30 min at 100,000 × g (43,000 rpm) in a TLA 110 rotor (Beckman, Optima TL100 centrifuge). These concentrated fractions were resuspended in 30μL of PBS.
Sucrose Gradient Separation. Sucrose gradients were built manually as de-scribed in ref. 42. Briefly 2.0 M and 0.4 M sucrose solution in PBS were used to prepare 15 fractions with sucrose molarity ranging from 0.4 to 2.0 M. Pellets mixed with 2.5 M sucrose to 1.5 mL total volume were loaded at the bottom of a SW40Ti tube and the gradient was layered by pouring se-quentially 750μL of each of the 15 solutions (from 2 M to 0.4 M). Tubes were centrifuged for 16 h at 4 °C at 200,000× g (35,000 rpm). After stopping the centrifuge without breaks, 12 fractions of 1 mL were collected from the top of the tube. Density measurement and collection of the vesicle fractions were performed as described above.
Immuno-Isolation. Antibodies for immuno-isolation [mouse monoclonal anti-human CD63 (clone H5C6, BD Biosciences), CD9 (cat. no. CBL162, Millipore), CD81 (cat. no. CBL579, Millipore), and normal mouse polyclonal IgG (cat. no. 12–371, Millipore)] in a ratio of 1 μg of antibody per 100 μL of beads where coupled by overnight incubation at 4 °C to Pierce Protein A Magnetic Beads (Life Technologies). Beads were then washed three times with 500μL of PBS-0,001% Tween, resuspended in 500μL of the same buffer, to which sEVs from 15 million DCs in 25μL PBS were added, followed by overnight incubation at 4 °C with rotation. Bead-bound EVs were collected and washed three times in 500μL PBS-Tween. Nonbead-bound supernatant was pooled with the supernatants of bead washes and centrifuged for 30 min at 100,000× g (43,000 rpm) in a TLA 110 rotor (Beckman, Optima TL100 centrifuge), to generate concentrated FT. FT and bead-bound EV samples were resuspended in 30μL of loading buffer 1× (Invitrogen) and boiled at 95 °C for 5 min before loading on gel.
Western Blotting. Cells were lysed in 50 mM Tris, pH 7.5, 0.3 M NaCl, 0.5% Triton X-100, 0.1% sodium azide with a mixture of antiproteases (Roche) at a concentration of 4× 10⁶cells in 100μL of buffer for 20 min on ice, then centrifuged at 18,500× g for 15 min. The pellet was discarded and the su-pernatant was kept for further analysis. Protein concentration was mea-sured using Micro-BCA (Thermo Scientific) for both cell lysates and vesicle preparation in the presence of 0.2% SDS. Equivalent micrograms of proteins (Figs. 1 and 4 B and C and Fig. S1D), or pellets recovered from a given number of cells [i.e., a given volume of conditioned medium) (Figs. 4D and 5B andFig. S3 B and D) were loaded for all samples from each preparation and analyzed simultaneously on NuPAGE 4–12% BisTris gels (Invitrogen). Materials secreted by 7.5× 10⁶(Fig. 5B), or 10–25 × 106cells (Fig. 4D andFig. S3 B and D) was analyzed. Separation was performed under nonreducing
CELL
BIOLOGY
conditions. After transfer to Immobilon membranes (Millipore), antibody in-cubations and development were performed using BM Chemiluminescence Western blotting Substrate (POD) (Roche), and radiographic films (GE Healthcare and Thermo Scientific) (Figs. 1, 2, 4, and 5B, andFigs. S1DandS3 B and D) or a ChemiDoc Touch imager (Bio-Rad) (Fig. 4D, Right) were used for membrane exposure. Intensity of the bands was quantified using ImageJ software.
Nanoparticle Tracking Analysis. A LM10 Nanoparticle Tracking Analysis device (Malvern) was used according to ref. 43. Before each session, the size and concentration of standard silica beads (silica microspheres, 0.15μm; Poly-sciences) was measured. All settings for the camera were determined using the bead solution and fixed for all measurements during the session [camera level 8, camera shutter 3.73–8.75 ms (depending on the set of measure-ments), camera gain 250.00]. For each sample, at least five videos of 30–60 s with more than 200 detected tracks per video, and in at least one dilution, were taken and analyzed using the Nanoparticle Tracking Analysis software 2.3 with default settings. Results represent the mean of the videos at one dilution (Fig. S1B, Bottom) or all videos acquired for a given sample (Fig. S1B, Upper).
Electron Microscopy. Electron microscopy was performed on pellets stored at −80 °C and never unfrozen. EV suspension in PBS was deposited on formvar-carbon–coated cooper/palladium grids for whole-mount analysis as described previously (11, 13, 44). In case of double immunostaining, samples on grids were successively incubated with mouse anti-CD63, 15-nm protein-A-gold, 1% glutaraldehyde (Electron Microscopy Sciences), anti-MHC II, 10-nm protein-A-gold, and glutaraldehyde, and afterward contrasted and embedded in a mixture of methylcellulose and uranyl acetate. Vesicle size was assessed with iTEM analysis software (Soft Imaging Systems) or ImageJ software.
Proteomics and Mass Spectrometry Analysis. Three independent sets of iodixanol fractions recovered from 4.4× 10⁸(two sets) or 2.8× 10⁸cells pooled from two to three donors were simultaneously separated by SDS/ PAGE and stained with colloidal blue (LabSafe Gel Blue GBiosciences). Three gel slices were excised per fraction for each set. For immuno-isolated sam-ples and their flow-through (materials recovered from 1.5× 10⁷cells), SDS/ PAGE was used without separation as a clean-up step, and only one gel slice was excised. Subsequently, gel slices were washed and proteins were re-duced with 10 mM DTT before alkylation with 55 mM iodoacetamide. After washing and shrinking the gel pieces with 100% (vol/vol) MeCN, we per-formed in-gel digestion using trypsin (Roche) overnight in 25 mM NH4HCO3 at 30 °C. Peptides were analyzed by LC-MS/MS using an Ultimate 3000 system (Dionex) coupled to an LTQ-Orbitrap XL mass spectrometer (Thermo Fisher Scientific). Proteins were denatured, reduced, alkylated and digested with trypsin as described previously (45, 46) or trypsin/LysC. A nanoflow HPLC instrument (Ultimate 3000, Dionex) was coupled on-line to the LTQ-Orbitrap XL Hybrid Ion Trap-Orbitrap mass spectrometer (Thermo Scientific) and an RSLCnano system (Ultimate 3000, Thermo Scientific) to the Orbitrap Fusion Tribrid mass spectrometer (Thermo Scientific). Peptides were loaded onto a C18-reversed phase column (300-μm inner diameter × 5 mm; Dionex), sep-arated and MS data acquired using Xcalibur software. Peptides were sepa-rated by HPLC over a two-step gradient of 157 min from 0% to 30% (vol/vol) acetonitrile and of 20 min [from 30% to 50% (vol/vol)] and by UHPLC over a two-step gradient of 100 min [from 5% to 35% (vol/vol)] and of 15 min from 35% to 75% (vol/vol) acetonitrile (75-μm inner diameter × 50 cm; C18 Pep-Map, Dionex) and analyzed in the Orbitrap XL or Orbitrap Fusion mass spectrometer (Thermo Scientific). Full-scan MS was acquired with 60,000 and
120,000 resolution in the Orbitrap analyzer, respectively and ions from each full scan were fragmented with CID or HCD, respectively and analyzed in the linear ion trap.
Mass Spectrometry Data Processing and Statistical Analysis. For identification, the data were searched against the UniProtKB-SwissProt human database using Mascot 2.3 (Matrix Science) through Proteome Discoverer 1.4 (Thermo Scientific) workflow editor tool. Enzyme specificity was set to trypsin and a maximum of two miscleavages was allowed. Oxidized methionine, N-terminal acetylation, and carbamidomethyle cysteine were set as variable modifications. Maximum allowed mass deviation was set initially to 2 ppm for monoisotopic precursor ions and 0.5 Da for MS/MS peaks.
All peptide/protein identification data were processed using the Institut Curie-developed software myProMS (myproms-demo.curie.fr/) (47) v3.0 (work in progress), which performs search engine results validation, false-positive rate (FDR)-based data filtering, protein quantification, statistical analysis, and data visualization. FDR calculation uses the qvality algorithm (48) and was set to 1% at the peptide level for the whole study. For quali-tative analysis, a protein was considered present in an iodixanol fraction if identified by at least three distinct peptides in the group of three gel slices obtained per fraction, for at least one donor. For qualitative analysis of immuno-isolated samples, a protein was considered present if at least three peptides in all three donors were detected.
For label-free quantification, peptide XICs (Extracted Ion Chromatograms) were computed with MassChroQ v1.2.1 (49) using OBI-Warp alignment al-gorithm. A scale normalization was applied on the total signal to correct the XICs for each biological replicate as described by ref. 50. Protein ratios were computed as the geometrical mean of related peptides. To estimate ratio significance, a two-tailed t test was performed with a Benjamini–Hochberg FDR control threshold set to 0.05.
To assess replicate reproducibility for all fractions, PCA was performed using peptide XICs of common peptides in all subfractions replicates using ade4 package (51), based on R. GO enrichment analysis was performed as described by refs. 52 and 53.
Raw data have been deposited in the ProteomeXchange Consortium (www.proteomexchange.org) (54) via the PRIDE partner repository with dataset identifier PXD003257, and will be available in VesiclePedia (www. microvesicles.org) and EVpedia (student4.postech.ac.kr/evpedia2_xe/xe/). Statistical Analysis. Statistical analyses of Western blot and cell viability assays were performed using GraphPad Prism 6. Paired nonparametric (Wilcoxon signed-rank test) (Fig. 2B andFig. S1C) or parametric (Student’s t test) (Fig. S3A) tests were used to compare the different pellets obtained from DCs of each donor.
ACKNOWLEDGMENTS. We thank Dr. Pascale Zimmermann (Centre de Recherche en Cancérologie de Marseille and University Leuven) and Dr. Steve Caplan (National Institutes of Health) for generous gifts of antibodies; Drs. Patrycja Kozik and Christel Goudot for helpful discus-sions on proteomic analyses; Alan Guichard for help in fluorescence microscopy experiments; and Drs. Elodie Segura, Claire Hivroz, Nicolas Manel, and Sebastian Amigorena for critical reading of the manuscript. This work was supported by the French National Research Agency through the “Investments for the Future” program (France-BioImaging, ANR-10-INSB-04); the IDEX and Labex programs (ANR-10-IDEX-0001-02 PSL* and ANR-11-LABX-0043); a Fondation ARC Grant SL220120605293 (to C.T.) and a post-doc grant (to M.T.);“Région Ile-de-France” and Fondation pour la Recherche Médicale grants (to D.L.); Centre d’Investigations Cliniques IGR-Curie 1428; INSERM; and Institut Curie, including a PhD grant (to J.K.).
1. Yáñez-Mó M, et al. (2015) Biological properties of extracellular vesicles and their physiological functions. J Extracell Vesicles 4:27066.
2. Colombo M, Raposo G, Théry C (2014) Biogenesis, secretion, and intercellular inter-actions of exosomes and other extracellular vesicles. Annu Rev Cell Dev Biol 30: 255–289.
3. Raposo G, Stoorvogel W (2013) Extracellular vesicles: Exosomes, microvesicles, and friends. J Cell Biol 200(4):373–383.
4. Buzas EI, György B, Nagy G, Falus A, Gay S (2014) Emerging role of extracellular vesicles in inflammatory diseases. Nat Rev Rheumatol 10(6):356–364.
5. van der Pol E, Böing AN, Harrison P, Sturk A, Nieuwland R (2012) Classification, functions,
and clinical relevance of extracellular vesicles. Pharmacol Rev 64(3):676–705.
6. Melo SA, et al. (2015) Glypican-1 identifies cancer exosomes and detects early pan-creatic cancer. Nature 523(7559):177–182.
7. Kowal J, Tkach M, Théry C (2014) Biogenesis and secretion of exosomes. Curr Opin Cell
Biol 29:116–125.
8. Gould SJ, Raposo G (2013) As we wait: Coping with an imperfect nomenclature for extracellular vesicles. J Extracell Vesicles 2:20389.
9. Kanada M, et al. (2015) Differential fates of biomolecules delivered to target cells via extracellular vesicles. Proc Natl Acad Sci USA 112(12):E1433–E1442.
10. Sedlik C, et al. (2014) Different immunogenicity but similar antitumor efficacy of two DNA vaccines coding for an antigen secreted in different membrane vesicle-associated forms. J Extracell Vesicles 3:24646.
11. Théry C, Amigorena S, Raposo G, Clayton A (2006) Isolation and characterization of exosomes from cell culture supernatants and biological fluids. Curr Protoc Cell Biol Chapter 3:Unit 3.22. 12. Robbins PD, Morelli AE (2014) Regulation of immune responses by extracellular
ves-icles. Nat Rev Immunol 14(3):195–208.
13. Colombo M, et al. (2013) Analysis of ESCRT functions in exosome biogenesis, com-position and secretion highlights the heterogeneity of extracellular vesicles. J Cell Sci 126(Pt 24):5553–5565.
14. Aalberts M, et al. (2012) Identification of distinct populations of prostasomes that differentially express prostate stem cell antigen, annexin A1, and GLIPR2 in humans. Biol Reprod 86(3):82.
15. Zonneveld MI, et al. (2014) Recovery of extracellular vesicles from human breast milk is influenced by sample collection and vesicle isolation procedures. J Extracell Vesicles 3:24215.
16. Li X, Donowitz M (2014) Fractionation of subcellular membrane vesicles of epithelial
and non-epithelial cells by OptiPrep™ density gradient ultracentrifugation. Methods
Mol Biol 1174:85–99.
17. Antonyak MA, et al. (2011) Cancer cell-derived microvesicles induce transformation by transferring tissue transglutaminase and fibronectin to recipient cells. Proc Natl Acad Sci USA 108(12):4852–4857.
18. Mellacheruvu D, et al. (2013) The CRAPome: A contaminant repository for affinity purification-mass spectrometry data. Nat Methods 10(8):730–736.
19. Aatonen MT, et al. (2014) Isolation and characterization of platelet-derived extra-cellular vesicles. J Extracell Vesicles 3:24692.
20. Segura E, et al. (2005) ICAM-1 on exosomes from mature dendritic cells is critical for efficient naive T-cell priming. Blood 106(1):216–223.
21. Kalra H, et al. (2012) Vesiclepedia: A compendium for extracellular vesicles with continuous community annotation. PLoS Biol 10(12):e1001450.
22. Kim DK, et al. (2013) EVpedia: An integrated database of high-throughput data for systemic analyses of extracellular vesicles. J Extracell Vesicles 2:20384.
23. Chaput N, Théry C (2011) Exosomes: Immune properties and potential clinical
im-plementations. Semin Immunopathol 33(5):419–440.
24. Atay S, Gercel-Taylor C, Taylor DD (2011) Human trophoblast-derived exosomal fi-bronectin induces pro-inflammatory IL-1β production by macrophages. Am J Reprod Immunol 66(4):259–269.
25. Fleming JM, Ginsburg E, Oliver SD, Goldsmith P, Vonderhaar BK (2012) Hornerin, an S100 family protein, is functional in breast cells and aberrantly expressed in breast cancer. BMC Cancer 12:266.
26. Keerthikumar S, et al. (2015) Proteogenomic analysis reveals exosomes are more oncogenic than ectosomes. Oncotarget 6(17):15375–15396.
27. Minciacchi VR, et al. (2015) Large oncosomes contain distinct protein cargo and represent a separate functional class of tumor-derived extracellular vesicles. Oncotarget 6(13):11327–11341.
28. Xu R, Greening DW, Rai A, Ji H, Simpson RJ (2015) Highly-purified exosomes and shed microvesicles isolated from the human colon cancer cell line LIM1863 by sequential centrifugal ultrafiltration are biochemically and functionally distinct. Methods 87: 11–25.
29. Clark DJ, et al. (2015) Redefining the breast cancer exosome proteome by tandem mass tag quantitative proteomics and multivariate cluster analysis. Anal Chem 87(20): 10462–10469.
30. Oksvold MP, et al. (2014) Expression of B-cell surface antigens in subpopulations of exosomes released from B-cell lymphoma cells. Clin Ther 36(6):847–862.e1. 31. Baietti MF, et al. (2012) Syndecan-syntenin-ALIX regulates the biogenesis of
exo-somes. Nat Cell Biol 14(7):677–685.
32. Ostrowski M, et al. (2010) Rab27a and Rab27b control different steps of the exosome secretion pathway. Nat Cell Biol 12(1):19–30, 1–13.
33. Jakobsen KR, et al. (2015) Exosomal proteins as potential diagnostic markers in ad-vanced non-small cell lung carcinoma. J Extracell Vesicles 4:26659.
34. Yoshioka Y, et al. (2013) Comparative marker analysis of extracellular vesicles in different human cancer types. J Extracell Vesicles 2:20424.
35. Muralidharan-Chari V, et al. (2009) ARF6-regulated shedding of tumor cell-derived
plasma membrane microvesicles. Curr Biol 19(22):1875–1885.
36. Di Vizio D, et al. (2009) Oncosome formation in prostate cancer: Association with a region of frequent chromosomal deletion in metastatic disease. Cancer Res 69(13):
5601–5609.
37. Abrami L, et al. (2013) Hijacking multivesicular bodies enables long-term and
exo-some-mediated long-distance action of anthrax toxin. Cell Reports 5(4):986–996.
38. Tibaldi L, et al. (2013) New blocking antibodies impede adhesion, migration and survival of ovarian cancer cells, highlighting MFGE8 as a potential therapeutic target of human ovarian carcinoma. PLoS One 8(8):e72708.
39. Adams TE, Bodmer JG, Bodmer WF (1983) Production and characterization of monoclonal antibodies recognizing the alpha-chain subunits of human ia alloanti-gens. Immunology 50(4):613–624.
40. Gauster M, Blaschitz A, Dohr G (2007) Monoclonal antibody HC10 does not bind HLA-G. Rheumatology (Oxford) 46(5):892–893, author reply 893–894.
41. Seitz C, Uchanska-Ziegler B, Zank A, Ziegler A (1998) The monoclonal antibody HCA2 recognises a broadly shared epitope on selected classical as well as several non-clas-sical HLA class I molecules. Mol Immunol 35(13):819–827.
42. Bobrie A, Colombo M, Krumeich S, Raposo G, Théry C (2012) Diverse subpopulations of vesicles secreted by different intracellular mechanisms are present in exosome preparations obtained by differential ultracentrifugation. J Extracell Vesicles 1:18397. 43. Gardiner C, Ferreira YJ, Dragovic RA, Redman CW, Sargent IL (2013) Extracellular vesicle sizing and enumeration by nanoparticle tracking analysis. J Extracell Vesicles 2:19671.
44. Raposo G, et al. (1996) B lymphocytes secrete antigen-presenting vesicles. J Exp Med 183(3):1161–1172.
45. Lo Cicero A, et al. (2015) Exosomes released by keratinocytes modulate melanocyte pigmentation. Nat Commun 6:7506.
46. Burgo A, et al. (2013) Increased activity of the vesicular soluble N-ethylmaleimide-sensitive factor attachment protein receptor TI-VAMP/VAMP7 by tyrosine phosphor-ylation in the Longin domain. J Biol Chem 288(17):11960–11972.
47. Poullet P, Carpentier S, Barillot E (2007) myProMS, a web server for management and validation of mass spectrometry-based proteomic data. Proteomics 7(15):2553–2556. 48. Käll L, Storey JD, Noble WS (2008) Non-parametric estimation of posterior error probabilities associated with peptides identified by tandem mass spectrometry. Bioinformatics 24(16):i42–i48.
49. Valot B, Langella O, Nano E, Zivy M (2011) MassChroQ: A versatile tool for mass spectrometry quantification. Proteomics 11(17):3572–3577.
50. Yang YH, et al. (2002) Normalization for cDNA microarray data: A robust composite method addressing single and multiple slide systematic variation. Nucleic Acids Res 30(4):e15.
51. Dray S, Dufour AB (2007) The ade4 package: Implementing the duality diagram for ecologists. J Stat Softw 22(4):1–20.
52. Pan C, Kumar C, Bohl S, Klingmueller U, Mann M (2009) Comparative proteomic phenotyping of cell lines and primary cells to assess preservation of cell type-specific functions. Mol Cell Proteomics 8(3):443–450.
53. Sury MD, Chen JX, Selbach M (2010) The SILAC fly allows for accurate protein quantification in vivo. Mol Cell Proteomics 9(10):2173–2183.
54. Vizcaíno JA, et al. (2013) The PRoteomics IDEntifications (PRIDE) database and asso-ciated tools: Status in 2013. Nucleic Acids Res 41(Database issue):D1063–D1069. 55. Théry C, et al. (1999) Molecular characterization of dendritic cell-derived exosomes.
Selective accumulation of the heat shock protein hsc73. J Cell Biol 147(3):599–610.
CELL
BIOLOGY