HAL Id: hal-01271785
https://hal.sorbonne-universite.fr/hal-01271785
Submitted on 9 Feb 2016
HAL is a multi-disciplinary open access
archive for the deposit and dissemination of
sci-entific research documents, whether they are
pub-lished or not. The documents may come from
teaching and research institutions in France or
abroad, or from public or private research centers.
L’archive ouverte pluridisciplinaire HAL, est
destinée au dépôt et à la diffusion de documents
scientifiques de niveau recherche, publiés ou non,
émanant des établissements d’enseignement et de
recherche français ou étrangers, des laboratoires
publics ou privés.
Distributed under a Creative Commons Attribution| 4.0 International License
Quantifying the heritability of glioma using
genome-wide complex trait analysis
Ben Kinnersley, Jonathan S. Mitchell, Konstantinos Gousias, Johannes
Schramm, Ahmed Idbaih, Marianne Labussière, Yannick Marie, Amithys
Rahimian, H.-Erich Wichmann, Stefan Schreiber, et al.
To cite this version:
Ben Kinnersley, Jonathan S. Mitchell, Konstantinos Gousias, Johannes Schramm, Ahmed Idbaih,
et al.. Quantifying the heritability of glioma using genome-wide complex trait analysis. Scientific
Reports, Nature Publishing Group, 2015, 5, pp.17267. �10.1038/srep17267�. �hal-01271785�
Quantifying the heritability
of glioma using genome-wide
complex trait analysis
Ben Kinnersley1, Jonathan S. Mitchell1, Konstantinos Gousias2, Johannes Schramm2,
Ahmed Idbaih3,4, Marianne Labussière3, Yannick Marie3, Amithys Rahimian3,5, H.-Erich
Wichmann6,7,8, Stefan Schreiber9,10, Khe Hoang-Xuan3,4,5, Jean-Yves Delattre3,4,5,
Markus M. Nöthen11, Karima Mokhtari12, Mark Lathrop13,14, Melissa Bondy15,
Matthias Simon2, Marc Sanson3,4,5 & Richard S. Houlston1
Genome-wide association studies (GWAS) have successfully identified a number of common single-nucleotide polymorphisms (SNPs) influencing glioma risk. While these SNPs only explain a small proportion of the genetic risk it is unclear how much is left to be detected by other, yet to be identified, common SNPs. Therefore, we applied Genome-Wide Complex Trait Analysis (GCTA) to three GWAS datasets totalling 3,373 cases and 4,571 controls and performed a meta-analysis to estimate the heritability of glioma. Our results identify heritability estimates of 25% (95% CI: 20–31%, P = 1.15 × 10⁻¹⁷) for all forms of glioma - 26% (95% CI: 17–35%, P = 1.05 × 10⁻⁸) for
glioblastoma multiforme (GBM) and 25% (95% CI: 17–32%, P = 1.26 × 10⁻¹⁰) for non-GBM tumors.
This is a substantial increase from the genetic variance identified by the currently identified GWAS risk loci (~6% of common heritability), indicating that most of the heritable risk attributable to common genetic variants remains to be identified.
Gliomas account for ~40% of all primary brain tumours and are responsible for around 13,000 cancer-related deaths in the USA each year1. Gliomas are defined in part by malignancy grade (e.g.
pilocytic astrocytoma WHO grade I, diffuse ‘low grade’ glioma WHO grade II, anaplastic glioma WHO grade III and glioblastoma (GBM) WHO grade IV can be distinguished2). Most gliomas carry a poor
prognosis irrespective of treatment, with the most common form of glioma, glioblastoma (GBM), having a median overall survival of ~15 months3,4.
1Division of Genetics and Epidemiology, The Institute of Cancer Research, 15 Cotswold Road, Sutton, Surrey SM2
5NG, UK. 2Department of Neurosurgery, University of Bonn Medical Center, Sigmund-Freud-Str. 25, 53105 Bonn,
Germany. 3Sorbonne Universités UPMC Univ Paris 06, INSERM CNRS, U1127, UMR 7225, ICM, F-75013 Paris,
France. 4AP-HP, GH Pitié-Salpêtrière, Service de Neurologie Mazarin, 47 bld de l’Hôpital, 75651 Paris, France. 5Onconeurotek, F-75013 Paris, France. 6Institute of Epidemiology I, Helmholtz Zentrum München, German
Research Center for Environmental Health, Ingolstädter Landstr. 1, 85764 Neuherberg, Germany. 7Institute
of Medical Informatics, Biometry and Epidemiology, Chair of Epidemiology, Ludwig-Maximilians-Universität, Geschwister-Scholl-Platz 1, 80539 Munich, Germany. 8Institute of Medical Statistics and Epidemiology, Technical
University Munich, Germany. 91st Medical Department, University Clinic Schleswig-Holstein, Campus Kiel, House 6,
Arnold-Heller-Str. 3, 24105 Kiel, Germany. 10Institute of Clinical Molecular Biology, Christian-Albrechts-University
Kiel, Arnold-Heller-Straβe 3, 24105 Kiel, Germany. 11Institute of Human Genetics, University of Bonn, Bonn,
Germany. 12AP-HP, GH Pitié-Salpêtrière, Laboratoire de neuropathologie R Escourolle, F-75013 Paris, France. 13Fondation Jean Dausset-CEPH, 27 Rue Juliette Dodu, 75010 Paris, France. 14Génome Québec, Department of
Human Genetics, McGill University, Montreal, Quebec, H3A 0G1, Canada. 15Department of Pediatrics, Division
of Hematology-Oncology, Dan L. Duncan Cancer Center, Baylor College of Medicine, Houston, Texas, USA. Correspondence and requests for materials should be addressed to R.S.H. (email: [email protected]) received: 29 June 2015
accepted: 07 October 2015 Published: 02 December 2015
OPEN
www.nature.com/scientificreports/
While the glioma subtypes have distinct molecular profiles resulting from different etiological path-ways5, no environmental factor has been consistently linked to disease risk except exposure to ionizing
radiation, which accounts for few cases1. Evidence for inherited genetic susceptibility to glioma is
pro-vided by a number of rare inherited cancer syndromes, including Turcot’s and Li–Fraumeni syndromes, and neurofibromatosis6. Even collectively these syndromes however account for little of the two-fold
increased risk of glioma seen in relatives of glioma patients1,7.
Recent genome-wide association studies (GWAS) have provided unambiguous evidence for common genetic susceptibility to glioma - identified single nucleotide polymorphisms (SNPs) at 5p15.33 (TERT), 7p11.2 (EGFR) 8q24.21 (CCDC26), 9p21.3 (CDKN2A/CDKN2B), 11q23.3 (PHLDB1) and 20q13.33 (RTEL1) associated with risk8–10. It is not clear however how much of the heritability of glioma
ascriba-ble to common variation these risk SNPs explain.
Testing SNPs individually for an association in GWAS necessitates the imposition of a very stringent
P-value to address the issue of multiple testing (i.e. conventionally P ≤ 5.0 × 10⁻⁸). While this reduces
false positives it can result in true associations being missed. Genome-wide Complex Trait Analysis (GCTA) allows the contribution of all SNPs in a GWAS to be simultaneously evaluated in estimat-ing heritability11–13. GCTA calculates the genetic similarity between subjects and uses the restricted
maximum-likelihood approach to estimate narrow sense heritability (h2). An alternative approach based
on phenotype correlation-genotype correlation (PCGC) regression has recently been developed to avoid potential bias introduced by GCTA when applied to case-control studies14. Here we apply both GCTA
and PCGC methodologies to three glioma GWAS to enumerate the heritability accounted for by com-mon genetic variation.
Materials and Methods
Ethics. Collection of blood samples and clinical information from subjects was undertaken with informed consent and relevant ethical review board approval in accordance with the tenets of the Declaration of Helsinki. Ethical committee approval for this study was obtained from relevant study centers [France: APHP ethical committee-CPP (comité de Protection des Personnes); Germany: Ethics Commission of the Medical Faculty of the University of Bonn and USA: University of Texas MD Anderson Cancer Institutional Review Board].
Genome-wide association studies. We used three non-overlapping case-control series of Northern European ancestry which had been the subject of previous GWAS8,9; summarized in Supplementary
Table 1. Briefly, the US GWAS was based on 1,247 cases (mean age 47 years) ascertained through the MD Anderson Cancer Center, Texas, between 1990 and 2008. Individuals with European ancestry from the Cancer Genetic Markers of Susceptibility (CGEMS) studies served as controls8,15,16. The French
GWAS study comprised 1,423 patients with glioma ascertained through the Service de Neurologie Mazarin, Groupe Hospitalier Pitié-Salpêtrière Paris9. The controls were ascertained from the SU.VI.MAX
(SUpplementation en VItamines et MinerauxAntioXydants) study of 12,735 healthy subjects (women aged 35–60 years; men aged 45–60 years)17. The German GWAS comprised 846 patients who underwent
surgery for a glioma at the Department of Neurosurgery, University of Bonn Medical Center, between 1996 and 20089. Control subjects were taken from three population studies: KORA (Co-operative Health
Research in the Region of Augsburg; n = 371)18–20, POPGEN (Population Genetic Cohort; n = 595)21 and
from the Heinz Nixdorf Recall study (n = 344)22. Genotyping quality control assessment was as
previ-ously described8,9 and all SNPs presented in this study passed the required thresholds. Duplicate samples
were used to check genotyping quality. SNPs and samples with < 95% SNPs genotyped were eliminated from the analyses. Genotype frequencies at each SNP were tested for deviation from the Hardy-Weinberg equilibrium (HWE) and rejected at P < 10−4.
Statistical analysis. Consistent with our previous analysis9, quantile-quantile (Q-Q) plots for the
German and US series showed some evidence of inflation (inflation factor λ = 1.15 and 1.11, respectively, based on the 90% least significant SNPs), however after correcting for population substructure using the top 10 principal-components in Eigenstrat, λ for all studies was ≤ 1.04 (Supplementary Figure 1). Therefore all heritability estimates were calculated adjusting for 10 principal components.
Artefactual differences in allele frequencies between cases and controls can contribute to the estimation of spurious genetic variation therefore for the current analysis we imposed a number of additional quality control measures to the dataset as advocated by Lee et al. when estimating heritability23. Using PLINK
software24 we excluded SNPs in cases and controls that had a minor allele frequency (MAF) < 0.01 or
a HWE test with P < 0.05 (per-study exclusions = 60,932–62,065). Performing a differential missingness test between cases and controls we excluded SNPs with P < 0.05 (per-study exclusions = 25,002–60,235). In addition we excluded individuals having a relatedness score of > 0.05. rs2736100 exhibited a HWE
P-value of 0.01 in the German dataset but was still included in order to estimate the heritability
attribut-able to known loci. This filtering resulted in the use of 263,905 SNPs common to the three case-control series (Supplementary Table 2). A total of 93 samples in the French series, 137 samples in the German series and 78 samples in the USA series were removed during quality-control steps for reasons including a failure to genotype, unknown duplicates, and closely related individuals, leaving 3,373 cases and 4,571 controls for heritability analysis.
Estimation of heritability was performed in GCTA using the methodology of Yang et al.25 and Lee
et al 23. A genetic relationship matrix (GRM) of pairs of samples was used as input for the restricted
maximum likelihood analysis to estimate the heritability explained by the selected set of SNPs. GCTA uses the disease prevalence to transform the estimated heritability to the liability scale. As previously advocated when calculating the heritability of a common lethal disease such as cancer26,27 we used the
lifetime risk to transform the estimated heritability to the liability scale. Given glioma accounts for ~40% of all primary brain tumours1 and that GBM comprise 54.7% of gliomas28, and that the lifetime risk of
brain and nervous system tumours is 0.62%29 we estimated the lifetime risk of all glioma, GBM and
non-GBM tumors to be 0.24%, 0.13% and 0.11% respectively.
We estimated the heritability in GCTA under the following scenarios:
1. Heritability explained by the autosome. A single GRM is computed for all autosomal SNPs. 2. Heritability adjusting for incomplete LD between array SNPs and causal SNPs, following the
pro-cedure of Yang et al.25 and adjusting for a range of MAF thresholds of causal SNPs from < 0.1 to
< 0.5.
3. Heritability explained by individual chromosomes. A GRM is computed for each chromosome individually and then fitting is done simultaneously for all chromosome GRMs using the REML approach.
4. Heritability explained by risk SNPs identified by GWAS as located within autosomal regions asso-ciated with glioma. For each risk SNP the heritability is estimated for all chromosomes simultane-ously using the risk SNP genotype as a covariate. The heritability associated with the SNP is taken to be the difference between the heritability of the chromosome on which it is found as calculated with and without adjusting for the covariate.
5. Heritability explained by a) genic and intergenic, b) conserved (GERP > 2.0) and non-conserved (GERP < 2.0), c) functional (CADD > 10.0) and non-functional (CADD < 10.0) and d) transcrip-tion factor binding site occupying and non-occupying SNPs. For a-d separate GRMs are computed for SNPs in either of the two categories. Heritability was estimated simultaneously for the two GRM using the REML approach.
Estimation of genetic correlation between GBM and non-GBM glioma subtypes was carried out in GCTA using a bivariate REML analysis as per Lee et al.30, randomly assigning controls equally between
the two glioma subtypes in each of the studies.
As advocated31 we estimated heritability using PCGC regression adjusting for population structure
using a two-step procedure, where firstly the first 10 PCs (as computed in GCTA) are “cleaned” from the GRM, and are also subsequently included as fixed effects in the PCGC regression.
Meta-analysis under a fixed-effects model was conducted using standard methods. We calculated Cochran’s Q statistic to test for heterogeneity and the I2 statistic to quantify the proportion of the total
variation that was caused by heterogeneity32.
GWAS array SNPs were functionally annotated using SeattleSeq Annotation 13833, making use of
genomic evolutionary rate profiling (GERP)34 conservation metrics and combined annotation dependent
depletion (CADD)35 scores. Conserved transcription factor bindings sites were predicted by the
‘tfb-sCons’ track from the UCSC Genome Browser36, which searches for conserved elements in TransFac
Matrix Database v4 after alignment in Human/Rat/Mouse.
Results
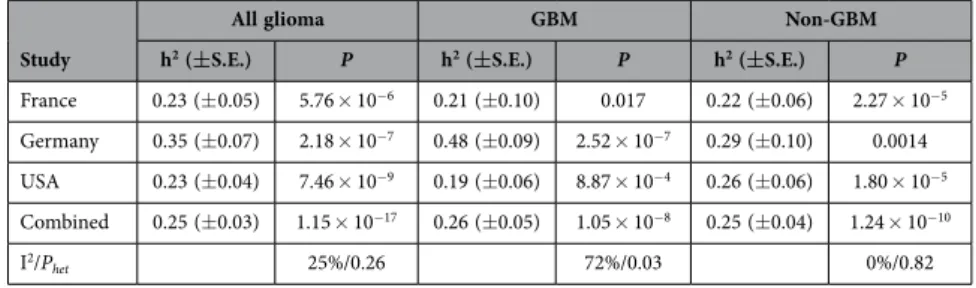
Restricting our analysis to SNPs mapping to the autosomes and following quality control filtering a total of 263,905 SNPs common to the 3,373 cases and 4,571 controls from the three GWAS were analysed (Table 1).
Variance explained by all autosomal SNPs. After transforming the data to account for lifetime risk and ascertainment the variance in liability of all glioma explained by the SNPs in each of the studies
Study
All glioma GBM Non-GBM
h2 (±S.E.) P h2 (±S.E.) P h2 (±S.E.) P
France 0.23 (± 0.05) 5.76 × 10⁻⁶ 0.21 (±0.10) 0.017 0.22 (±0.06) 2.27 × 10⁻⁵ Germany 0.35 (±0.07) 2.18 × 10⁻⁷ 0.48 (±0.09) 2.52 × 10⁻⁷ 0.29 (±0.10) 0.0014 USA 0.23 (±0.04) 7.46 × 10⁻⁹ 0.19 (±0.06) 8.87 × 10⁻⁴ 0.26 (±0.06) 1.80 × 10⁻⁵ Combined 0.25 (±0.03) 1.15 × 10⁻¹⁷ 0.26 (±0.05) 1.05 × 10⁻⁸ 0.25 (±0.04) 1.24 × 10⁻¹⁰
I2/Phet 25%/0.26 72%/0.03 0%/0.82
www.nature.com/scientificreports/
ranged from 0.23 to 0.35 (Table 1). Combining data from the three studies provides an estimate of the heritability of glioma of 0.25 (± 0.03, Table 1). The confidence intervals of overall heritability estimates from the US, French and German series overlapped, arguing against population-specific differences affecting the estimates.
PCGC has recently been proposed to reliably estimate heritability from case-control GWAS data and to avoid bias introduced by GCTA when applied to case-control studies31. Heritability estimates for
PCGC were 0.24 (± 0.07, Supplementary Table 3). As this is very close to the estimate obtained from GCTA (0.25 ± 0.03), we restricted subsequent analysis to GCTA.
To adjust for the underestimate of heritability caused by the array SNPs not being in complete LD with the causal SNPs we followed the procedure of Yang et al.25. The MAF distribution of causal SNPs
affects this estimate, and as we do not know the true distribution we calculate the adjustment for a range of MAF thresholds (Table 2). Assuming that causal SNPs and array SNPs have the same distribution (MAF threshold of 0.5) the adjusted heritability was calculated to be 31% (± 3.8%) which is close to the unadjusted value of 25% (± 3.0%). Conversely if causal SNPs are assumed to have MAF < 0.1 then the adjusted heritability is 41% (± 5.6%) which is significantly higher than the unadjusted value. While it is expected from neutral and selection theories of quantitative genetic variation that causal SNPs will on average have lower MAF than those on the array37 the exact distribution of MAF for causal SNPs in
glioma is unknown.
Accumulating data have established that the glioma subtypes have different molecular profiles pos-sibly resulting from different etiologic pathways, which might be shared by tumor subtypes or be type specific. To explore the possibility that common genetic variation en masse may impact differentially on the risk of glioma by subtype we estimated heritability for GBM and non-GBM glioma assuming that GBM accounts for ~55% of all glioma prevalence. Stratifying these data the variance in liability of GBM explained by the SNPs in each of the studies ranged from 0.21 to 0.48 with the pooled estimate being 0.26 (Table 1). The variance in liability of non-GBM explained by the SNPs in each of the studies was similar ranging from 0.22 to 0.29, with a pooled estimate of 0.25 (Table 1).
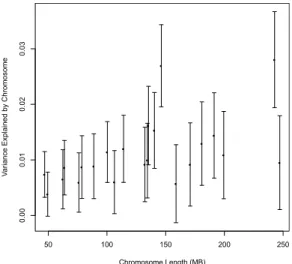
To gain insight into the underlying basis of the heritability associated with common variation we investigated the relative contribution of individual chromosomes (Supplementary Table 4). While for a trait such as height there is a strong linear relationship between chromosome length and the variance explained by the chromosome13, we observed only a modest relationship (R2 = 0.29 , P = 0.010, Fig. 1).
To determine the relative contribution of putatively functional vs non-functional SNPs to glioma her-itability, we partitioned the variance explained by all the SNPs into different groupings, (Supplementary Table 5). There was little apparent difference in heritability estimates between SNPs mapping within genes versus those mapping outside of genes. Additionally, consistent with GWAS arrays being designed for tagging purposes many of the putative functional variants comprised a small fraction of the total and therefore heritability estimates inherently had a large error.
Impact of known risk loci on variance. To determine the additive impact of the known GWAS risk loci on the heritability of glioma we estimated heritability by including the risk SNP as a covariate. The total estimated heritability of glioma explained by the seven risk loci is 1.6% (± 2.6%), 1.3% (± 3.9%) and 1.7% (± 3.3%) for all glioma, GBM and non-GBM tumors respectively (Table 3). These estimates are substantially lower than the genetic variance associated captured by all the SNPs on the array. These data therefore suggest a large proportion of the heritability in glioma remains unaccounted for by currently identified risk SNPs.
Discussion
Our results show for the first time that a substantial proportion (approximately 25%) of variation in the risk of developing glioma is associated with common SNPs (i.e. minor allele frequency, MAF > 0.01) that are in LD with functional variants. These results are consistent with a highly polygenic model because we demonstrated variation across the entire genome. The methodology we have used here does not attempt
MAF Threshold h2 (±S.E.) P
No adjustment 0.25 (± 0.030) 1.13 × 10⁻¹⁷ 0.5 0.31 (± 0.038) 5.96 × 10⁻¹⁶ 0.4 0.32 (± 0.040) 1.25 × 10⁻¹⁵ 0.3 0.33 (± 0.042) 4.20 × 10⁻¹⁵ 0.2 0.35 (± 0.046) 2.11 × 10⁻¹⁴ 0.1 0.41 (± 0.056) 2.61 × 10⁻¹³
Table 2. Heritability of glioma adjusted for incomplete LD between causal SNPs and those used to compute the GRM. Various minor allele frequency (MAF) thresholds were used to simulate different possible MAF distributions of the causal SNPs.
to test the effects of single SNPs but tests their accumulated effects. It estimates the joint effect of geno-typed SNPs and that effect reflects their LD with unknown functional variants, assuming that functional variants are in sufficient LD with the genotyped SNP for their contribution to heritability to be captured. Our estimate is based on realized relationships between very distant relationships thereby breaking up possible correlation (i.e. confounding) between genetic and environmental risk factors.
A strength of our study is that we were able to make use of data from three independent GWAS to derive combined heritability estimates, therefore minimising the possibility of biases in individual stud-ies affecting study findings. Additionally we endeavoured to protect against differences in population structure between cases and controls affecting estimates by adjusting for 10 principal components in each of the three GWAS datasets. In the German dataset the GBM heritability estimate was significantly larger than in the other datasets hence we cannot entirely exclude the possibility of residual population structure differences affecting estimates.
Previous estimates of the heritability for glioma from segregation analysis, which have been based on analyses of pedigrees of 297 and 639 glioma probands have reported values of 0.68 and 0.66 for polygenic heritability respectively38,39. These estimates could differ from those that we report here for a number
of reasons. Firstly, the narrow-sense heritability estimated in our analysis is simply the additive genetic variance as a proportion of the phenotypic variance. Therefore, it does not include non-additive epistatic gene-gene interactions, dominance effects or gene-environment interactions impacting on glioma risk.
Additionally, our estimate of heritability may provide a lower bound for narrow-sense heritability, due to imperfect LD between genotyped SNPs and unknown causal variants. Moreover, it has been argued that uneven linkage disequilibrium between genotyped SNPs and unknown causal variants could intro-duce bias in heritability estimates40. Furthermore, indels and structural variants were not considered,
although some may be tagged. In addition, the proportion of variance explained by GWAS SNPs is underestimated by GCTA, since the model imposes a prior centered zero as the effect size of the SNPs used in calculation of the GRM. We have also assumed that inheritance is strictly Mendelian which excludes the possible contribution of de novo copy number variants or methylation status variants to
Figure 1. Estimate of the variance explained by each chromosome in the combined dataset as a function of chromosome size. The regression R2 was 0.29 (P = 0.010).
Locus SNP All gliomah2 (±S.E.) h2 (±S.E.)GBM Non-GBMh2 (±S.E.)
5p15.33 rs2736100 0.0012 (± 0.011) 0.0053 (± 0.016) 0.000017 (± 0.013) 7p11.2 rs11979158 −0.00029 (± 0.0099) 0.000093 (± 0.015) −0.00017 (± 0.013) 7p11.2 rs2252586 0.00036 (± 0.0099) 0.00096 (± 0.015) −0.00021 (± 0.013) 8q24 rs4295627 0.0047 (± 0.010) 0.00035 (± 0.016) 0.0066 (± 0.013) 9p21.3 rs4977756 0.0067 (± 0.0095) 0.0036 (± 0.015) 0.0025 (± 0.012) 11q23.3 rs498872 0.0032 (± 0.0095) 0.0025 (± 0.013) 0.0082 (± 0.012) 20q13.33 rs6010620 0.00034 (± 0.0075) 0.00036 (± 0.011) −0.00021 (± 0.0098) Total 0.016 (± 0.026) 0.013 (± 0.039) 0.017 (± 0.033)
www.nature.com/scientificreports/
glioma risk. It is therefore possible that our estimates of heritability are inherently conservative in terms of defining the contribution of the impact of inherited predisposition to glioma risk. Notwithstanding such caveats the magnitude of the estimated heritability in our study is such that this polygenic suscep-tibility contributes significantly to the development of glioma.
The liability threshold model upon which we have estimated heritability assumes the distribution of disease liability is unimodal. Provided there is no single unidentified genetic or a major environmental risk factor contributing to glioma this assumption will not be violated. Since no major disease gene for glioma has been identified and the only established environmental risk factor is ionizing radiation (accounting for very few cases), our estimates of heritability are unlikely to be significantly biased as a result of the assumed model of disease risk.
Not only do our findings provide quantification of the impact of common variation on glioma risk, they also provide a strong rationale for continuing to search for additional novel risk variants through GWAS-based strategies. Thus far, eight independent loci have been shown conclusively to be associated with glioma8–10,41. While the risk of glioma associated with these common variants is not insignificant
(RRs of 1.2–1.4), collectively they underscore less than 5% of the entire genetic variance in risk of all forms of glioma. It is, therefore, likely that additional common low risk variants remain to be discovered and should be eminently harvestable in new larger GWAS or through further pooling of additional existing datasets. However, most novel risk variants yet to be discovered are likely to have more modest effect on glioma risk than those which have been so far discovered.
It is possible that some disease-causing variants which are very rare have a substantive effect on glioma risk but there is no reason to believe that much of the genetic variance is solely explained by a restricted number of high-risk mutations. Additional ongoing GWAS are therefore likely to be informa-tive in refining estimates of heritability. Moreover, higher-density SNP genotyping would however pro-vide a higher probability of LD with functional disease-causing variants thus potentially affording the capturing of a higher proportion of the genetic variance - provided the characteristics of disease-causing variants do not differ systematically from the genotyped SNPs (e.g. because of lower MAF).
Further advancements are likely to be made following the establishment of large consortia such as GLIOGENE42. Such initiatives not only provide the basis for GWAS with increased sample size, SNP
coverage and number of SNPs taken forward to large-scale replication to aid in the identification of additional novel risk variants, but also facilitate pooling studies of existing GWAS data to importantly improve the standard error of the point estimate of the heritability of glioma.
Glioma is increasingly being viewed as a highly heterogeneous cancer. Primary and secondary forms of GBM are recognized, with secondary GBM developing through progression from low-grade diffuse astrocytomas or anaplastic astrocytomas. While usually indistinguishable histologically, distinct molec-ular pathways characterize the primary and secondary forms43. Notably, IDH1 mutations are commonly
detectable in low-grade glioma and secondary GBM but are rare in primary GBMs43,44. Thus there are
limitations on the interpretation of data obtained in our study in terms of the generalizability to all specific histological forms of glioma. Moreover, in recent years MRI scanning has revealed that low grade glioma can be incidentally detected in 0.2% of healthy individuals43,44 potentially impacting on
the heritable risk. In this study we did however seek to address the impact of genetic variation on risk of glioma subtype by analysis of GBM and non-GBM glioma. A combined estimate of the genetic correla-tion between GBM and non-GBM in our datasets was 0.87, albeit with wide confidence limits (± 0.22), suggesting that a significant complement of the heritable risk of glioma may be generic.
In summary, we report the first study to show that a large proportion of the heritability of developing glioma can be ascribed to common genetic variation. Moreover, it is the first to show biologically and unequivocally that the risk of glioma is highly polygenic. Our findings imply that very large sample sizes will be needed to detect novel loci with genome-wide significance and that the majority of additive genetic variation for glioma is not explained by rare variants that are not in LD with common SNPs.
References
1. Bondy, M. L. et al. Brain tumor epidemiology: consensus from the Brain Tumor Epidemiology Consortium. Cancer 113, 1953–68 (2008).
2. Louis, D. N. et al. The 2007 WHO classification of tumours of the central nervous system. Acta Neuropathol 114, 97–109 (2007). 3. Sanson, M. et al. Isocitrate dehydrogenase 1 codon 132 mutation is an important prognostic biomarker in gliomas. J Clin Oncol
27, 4150–4 (2009).
4. Weller, M. et al. Molecular predictors of progression-free and overall survival in patients with newly diagnosed glioblastoma: a prospective translational study of the German Glioma Network. J Clin Oncol 27, 5743–50 (2009).
5. Ostrom, Q. T. et al. The epidemiology of glioma in adults: a “state of the science” review. Neuro Oncol 16, 896–913 (2014). 6. Hodgson, S. V., Maher, E. R. & Hodgson, S. A practical guide to human cancer genetics, (Springer, 1999).
7. Hemminki, K., Tretli, S., Sundquist, J., Johannesen, T. B. & Granstrom, C. Familial risks in nervous-system tumours: a histology-specific analysis from Sweden and Norway. Lancet Oncol 10, 481–8 (2009).
8. Shete, S. et al. Genome-wide association study identifies five susceptibility loci for glioma. Nat Genet 41, 899–904 (2009). 9. Sanson, M. et al. Chromosome 7p11.2 (EGFR) variation influences glioma risk. Hum Mol Genet 20, 2897–904 (2011). 10. Wrensch, M. et al. Variants in the CDKN2B and RTEL1 regions are associated with high-grade glioma susceptibility. Nat Genet
41, 905–8 (2009).
11. Yang, J., Lee, S. H., Goddard, M. E. & Visscher, P. M. GCTA: a tool for genome-wide complex trait analysis. Am J Hum Genet
12. Yang, J., Lee, S. H., Goddard, M. E. & Visscher, P. M. Genome-wide complex trait analysis (GCTA): methods, data analyses, and interpretations. Methods Mol Biol 1019, 215–36 (2013).
13. Yang, J. et al. Genome partitioning of genetic variation for complex traits using common SNPs. Nat Genet 43, 519–25 (2011). 14. Golan, D., Lander, E. S. & Rosset, S. Measuring missing heritability: Inferring the contribution of common variants. Proceedings
of the National Academy of Sciences 111, E5272–E5281 (2014).
15. Hunter, D. J. et al. A genome-wide association study identifies alleles in FGFR2 associated with risk of sporadic postmenopausal breast cancer. Nat Genet 39, 870–4 (2007).
16. Yeager, M. et al. Genome-wide association study of prostate cancer identifies a second risk locus at 8q24. Nat Genet 39, 645–9 (2007).
17. Hercberg, S. et al. The SU.VI.MAX Study: a randomized, placebo-controlled trial of the health effects of antioxidant vitamins and minerals. Arch Intern Med 164, 2335–42 (2004).
18. Wichmann, H. E., Gieger, C., Illig, T. & Group, M. K. S. KORA-gen–resource for population genetics, controls and a broad spectrum of disease phenotypes. Gesundheitswesen 67 Suppl 1, S26–30 (2005).
19. Holle, R., Happich, M., Lowel, H., Wichmann, H. E. & Group, M. K. S. KORA–a research platform for population based health research. Gesundheitswesen 67 Suppl 1, S19–25 (2005).
20. Holle, R., Happich, M., Lowel, H. & Wichmann, H. E. KORA–a research platform for population based health research.
Gesundheitswesen 67 Suppl 1, S19–25 (2005).
21. Wichmann, H. E., Gieger, C. & Illig, T. KORA-gen–resource for population genetics, controls and a broad spectrum of disease phenotypes. Gesundheitswesen 67 Suppl 1, S26–30 (2005).
22. Krawczak, M. et al. PopGen: population-based recruitment of patients and controls for the analysis of complex genotype-phenotype relationships. Community Genet 9, 55–61 (2006).
23. Lee, S. H., Wray, N. R., Goddard, M. E. & Visscher, P. M. Estimating missing heritability for disease from genome-wide association studies. Am J Hum Genet 88, 294–305 (2011).
24. Purcell, S. et al. PLINK: a tool set for whole-genome association and population-based linkage analyses. Am J Hum Genet 81, 559–75 (2007).
25. Yang, J. et al. Common SNPs explain a large proportion of the heritability for human height. Nat Genet 42, 565–9 (2010). 26. Lu, Y. et al. Most common ‘sporadic’ cancers have a significant germline genetic component. Hum Mol Genet 23, 6112–8 (2014). 27. Lee, S. H. et al. Estimation and partitioning of polygenic variation captured by common SNPs for Alzheimer’s disease, multiple
sclerosis and endometriosis. Hum Mol Genet 22 832–41 (2013).
28. Ostrom, Q. T. et al. CBTRUS Statistical Report: Primary Brain and Central Nervous System Tumors Diagnosed in the United States in 2007–2011. Neuro-Oncology 16, iv1–iv63 (2014).
29. Surveillance Epidemiology and End Results (SEER) Program. DevCan database: “SEER 18 Incidence and Mortality, -., with Kaposi Sarcoma and Mesothelioma”. National Cancer Institute, DCCPS, Surveillace Research Program, Surveillance SYstems Branch, released August 2014, based on the November 2013 submission. Underlying mortality data provided by NCHS (www. cdc.gov/nchs).
30. Lee, S. H., Yang, J., Goddard, M. E., Visscher, P. M. & Wray, N. R. Estimation of pleiotropy between complex diseases using single-nucleotide polymorphism-derived genomic relationships and restricted maximum likelihood. Bioinformatics 28, 2540–2 (2012).
31. Golan, D., Lander, E. S. & Rosset, S. Measuring missing heritability: inferring the contribution of common variants. Proc Natl
Acad Sci USA 111, E5272–81 (2014).
32. Higgins, J. P. T., Thompson, S. G., Deeks, J. J. & Altman, D. G. Measuring inconsistency in meta-analyses, 557–560 (2003). 33. Ng, S. B. et al. Targeted capture and massively parallel sequencing of 12 human exomes. Nature 461, 272–6 (2009).
34. Cooper, G. M. et al. Distribution and intensity of constraint in mammalian genomic sequence. Genome Res 15, 901–13 (2005). 35. Kircher, M. et al. A general framework for estimating the relative pathogenicity of human genetic variants. Nat Genet 46, 310–5
(2014).
36. Kent, W. J. et al. The human genome browser at UCSC. Genome Research 12, 996–1006 (2002).
37. Pritchard, J. K. Are rare variants responsible for susceptibility to complex diseases? Am J Hum Genet 69, 124–37 (2001). 38. Malmer, B. et al. Genetic epidemiology of glioma. Br J Cancer 84 429–34 (2001).
39. De Andrade, M. et al. Segregation analysis of cancer in families of glioma patients. Genet Epidemiol 20, 258–70 (2001). 40. Speed, D., Hemani, G., Johnson, M. R. & Balding, D. J. Improved heritability estimation from genome-wide SNPs. Am J Hum
Genet 91, 1011–21 (2012).
41. Enciso-Mora, V. et al. Low penetrance susceptibility to glioma is caused by the TP53 variant rs78378222. Br J Cancer 108, 2178–85 (2013).
42. Malmer, B. et al. GLIOGENE an International Consortium to Understand Familial Glioma. Cancer Epidemiol Biomarkers Prev
16, 1730–4 (2007).
43. Ohgaki, H. & Kleihues, P. Genetic pathways to primary and secondary glioblastoma. Am J Pathol 170, 1445–53 (2007). 44. Nobusawa, S., Watanabe, T., Kleihues, P. & Ohgaki, H. IDH1 mutations as molecular signature and predictive factor of secondary
glioblastomas. Clin Cancer Res 15, 6002–7 (2009).
45. Erbel, R. et al. Die Heinz Nixdorf Recall Studie. Bundesgesundheitsblatt - Gesundheitsforschung - Gesundheitsschutz 55, 809–815 (2012).
Acknowledgements
We are grateful to all the patients and individuals for their participation and we would also like to thank the clinicians and other hospital staff, cancer registries and study staff in respective centers who contributed to the blood sample and data collection. MD Anderson acknowledges the work on the USA GWA study of Phyllis Adatto, Fabian Morice, Hui Zhang, Victor Levin, Alfred W.K. Yung, Mark Gilbert, Raymond Sawaya, Vinay Puduvalli, Charles Conrad, Fredrick Lang and Jeffrey Weinberg from the Brain and Spine Center. For the French study, we are indebted to A. Rahimian (Onconeurotek), A.M. Lekieffre and M Brandel for help in collecting data, and Y Marie for database support. For the German GWA study, we are indebted to B. Harzheim (Bonn) and Dr A. Müller-Erkwoh (Bonn) for help with the acquisition of clinical data and R. Mahlberg (Bonn) who provided technical support. The US GWA study made use of control genotypes from the CGEMS prostate and breast cancer studies. A full list of the investigators who contributed to the generation of the data is available from http://cgems.cancer.gov/. French controls were taken from the SU.VI.MAX study. The German GWA study made use of genotyping data from three population control sources: KORA-gen18,19, The Heinz-Nixdorf RECALL study45 and
www.nature.com/scientificreports/
POPGEN22. We are extremely grateful to all investigators who contributed to the generation of these data
sets. In the UK, funding was provided by Cancer Research UK (C1298/A8362 supported by the Bobby Moore Fund), the Wellcome Trust and the DJ Fielding Medical Research Trust. B.K. is supported by a PhD studentship funded by the Sir John Fisher Foundation. In the US, funding was provided by NIH grants 5R01(CA119215&5R01 CA070917). Support was also obtained from the American Brain Tumor Association and the National Brain Tumor Society. In France, funding was provided by the Ligue Nationale contre le Cancer, the fondation ARC, the Institut National du Cancer (INCa; PL046), the French Ministry of Higher Education and Research and the program “Investissements d’avenir” ANR-10-IAIHU-06. This study was additionally supported by a grant from Génome Québec, le Ministère de l’Enseignement supérieur, de la Recherche, de la Science et de la Technologie (MESRST) Québec and McGill University. In Germany, funding was provided to M.S. and J.S. by the Deutsche Forschungsgemeinschaft (Si552, Schr285), the Deutsche Krebshilfe (70–2385-Wi2,70–3163-Wi3,10–6262) and BONFOR. The KORA Augsburg studies are supported by grants from the German Federal Ministry of Education and Research (BMBF) and were mainly financed by the Helmholtz Zentrum München, German Research Center for Environmental Health, Neuherberg. This work was financed by the German National Genome Research Network (NGFN) and supported within the Munich Center of Health Sciences (MC Health) as part of LMUinnovativ.
Author Contributions
R.S.H. and B.K. designed the study. R.S.H. and B.K. drafted the manuscript, with contributions from all other authors. B.K. performed statistical and bioinformatics analyses with input from J.S.M. In the US, M.B. developed protocols and patient recruitment. In Germany, M. Simon, M.M.N., H.-E.W., S. Schreiber., and J.S. developed patient recruitment and blood sample collection, M. Simon oversaw DNA isolation and storage and performed case and control ascertainment and supervision of DNA extractions and K.G. performed experimental work. In France, M. Sanson, A.I. and J.-Y.D. developed patient recruitment, Y.M. developed sample acquisition and performed sample collection of cases, M.L. performed tumor genotyping, A.R., K.M. and K.H.-X. participated in tumor collection and annotation, and K.M. performed the neuropathological analysis. M. Lathrop performed laboratory management and oversaw genotyping of the French samples. All authors contributed to the final paper.
Additional Information
Supplementary information accompanies this paper at http://www.nature.com/srep Competing financial interests: The authors declare no competing financial interests.
How to cite this article: Kinnersley, B. et al. Quantifying the heritability of glioma using genome-wide
complex trait analysis. Sci. Rep. 5, 17267; doi: 10.1038/srep17267 (2015).
This work is licensed under a Creative Commons Attribution 4.0 International License. The images or other third party material in this article are included in the article’s Creative Com-mons license, unless indicated otherwise in the credit line; if the material is not included under the Creative Commons license, users will need to obtain permission from the license holder to reproduce the material. To view a copy of this license, visit http://creativecommons.org/licenses/by/4.0/