Deciphering genetic associations using genome-wide epigenomics
approaches
by Xinchen Wang B.Sc. Biochemistry University of Toronto, 2011Submitted to the Department of Biology
in Partial Fulfillment of the Requirements for the Degree of DOCTOR OF PHILOSOPHY
at the
MASSACHUSETTS INSTITUTE OF TECHNOLOGY June 2017
© Massachusetts Institute of Technology 2017. All rights reserved
Signature of Author ... Xinchen Wang Department of Biology May 26, 2017 Certified by ... Manolis Kellis Professor of Computer Science Thesis Advisor
Certified by ... Laurie A. Boyer Associate Professor of Biology
Thesis Advisor
Accepted by ... Amy E. Keating
Deciphering genetic associations using genome-wide epigenomics
approaches
. by . Xinchen WangSubmitted to the Department of Biology on May 26, 2017 in Partial Fulfillment of the Requirements for the Degree of Doctor of Philosophy in Biology
Abstract
Genetic mapping of the drivers of complex human phenotypes and disease through the genome-wide association study (GWAS) has identified thousands of causal genetic loci in the human population. However, genetic mapping approaches can often only reveal a particular causal locus, not the molecular mechanism through which it acts. Biological interpretation of these genetic results is thus a bottleneck for turning results from GWAS into meaningful biological insights for human biology.
Genetic mapping of complex human traits has revealed that most common variants influencing human phenotypes have weak effect sizes and reside outside protein-coding regions, complicating biological interpretation of their function. In this thesis we use computational and experimental approaches to study the non-coding genome. In particular, we focus on using epigenomic signatures to characterize non-coding
transcriptional regulatory elements and predict regulatory segments of DNA disrupted by genetic variants. In Chapter 2, we describe how genome-wide maps of epigenomic
modifications can be used to characterize and discover new GWAS loci. In Chapter 3, we outline an experimental method for the high-throughput assessment of putative
transcriptional regulatory elements.
In summary, our research highlights the value of interpreting human genetics information through an epigenomic lens, and provides a glimpse into the possible biological insights that manifest from the intersection of these two areas of research.
Thesis Supervisor: Manolis Kellis Title: Professor of Computer Science Thesis Supervisor: Laurie A. Boyer Title: Associate Professor of Biology
Acknowledgements
To my advisors, Manolis Kellis and Laurie Boyer, thank you for supporting and
mentoring me over the past six years. Manolis, your enthusiasm for science is infectious. Our impromptu whiteboard talks have taught me so much about being creative and adventurous as a scientist. Laurie, thank you for helping me grow as a scientist. Your support and encouragement has been invaluable. To my informal advisor Melina Claussnitzer, you have been a terrific mentor to me, and I am grateful to have had the chance to work with you.
Thank you to my committee members Peter Reddien, David Page and David Altshuler. I deeply appreciate the scientific and career advice you have given me over the years and the many hours you have been willing to let me sit in your offices.
Thank you to my undergraduate research mentors, Ben Blencowe and Claudia dos Santos. Working with you is what inspired me to pursue scientific research and come to graduate school. To Chris Newton-Cheh and David Milan, thank you for the many conversations we had and your constant willingness to help me along the way.
I have had the fortune and privilege to meet some amazing friends and labmates over the past six years. To everyone from the Boyer lab, including Paul, Kunle, Arune, Vidya, Lauren, Sera, Joe, Gizem, Carla and Darlene, you made it a joy to come into work every day. Thank you for so many wonderful memories in and out of the lab. I am grateful to have known everyone in the Kellis lab, especially my wonderful officemates Abhishek, Kunal, Angela, Bob, Khoi, Carles and Atlas, as well as Gerald, Pouya, Andreas, and Yue, who have taught me so much over the years. Thank you to the nascent Claussnitzer lab, especially Sarah, Li, and Alham, for being great colleagues and friends. Finally, thank you to friends from outside lab and classmates I have had these years for drinks, weekend brunches, Portuguese dinners and recurring coffee trips, and a special thanks to my two roommates Dave and David who I have lived with for five years and have been a constant source of support and humor.
Lastly and most importantly, I want to express my deepest gratitude to my parents and sister for always being there for me and to my girlfriend Cheng for her endless optimism and joy. You have been my biggest supporters through a long graduate school process that has had its share of bumps and detours along the way. Thank you for your encouragement and for always believing in me.
Table of Contents
Chapter 1: Introduction ... 11
Motivation ... 12
Background ... 12
Genetic architecture of human disease ... 12
Regulation of gene transcription ... 18
Epigenetic landscapes predict enhancer activity ... 19
Regulating enhancer activity by modulating DNA accessibility ... 24
Association mapping to identify disease loci ... 25
References ... 28
Chapter 2: Discovery and validation of sub-threshold genome-wide association study loci using epigenomic signatures ... 35
Abstract ... 36
Introduction ... 37
Results ... 38
QT/QRS-associated variants are enriched in cardiac enhancers ... 38
Applicability of enhancer enrichment for studying the genetics of other human traits and diseases ... 45
Common features in GWAS cardiac enhancers identify novel sub-threshold loci ... 48
Epigenomic prioritization identifies sub-threshold loci with molecular functions ... 52
Epigenomic prioritization discriminates sub-threshold loci with stronger association statistics ... 56
Enrichment of sub-threshold loci for non-cardiac human diseases in enhancer elements61 Sub-threshold locus at rs1743292/rs1772203 functionally disrupts enhancer activity .... 63
Discussion ... 69
Methods ... 73
8
Chapter 3: Genome-wide mapping of transcriptional regulatory activity in human
cells ... 95
Abstract ... 96
Introduction ... 97
Results ... 99
Experimental design and cloning strategy ... 99
Identification of fragments with regulatory potential and size-dependent effects on activity ... 102
Transcriptionally active regions identified by ATAC-STARR are enriched for activating epigenomic marks ... 103
High-resolution mapping of regulatory activity using ATAC-STARR ... 108
Discussion ... 110
Methods ... 112
References ... 117
12
Motivation
Much of human disease is influenced by heritable variation in DNA that is transmitted between generations, suggesting that an understanding of human genetics will aid in the study of human biology and disease. Moreover, the knowledge that genetic mutations disrupting specific genes can modify disease risk hints that the perturbed biological pathways can be promising therapeutic targets1. Unbiased genetic mapping of disease
variation has now implicated thousands of DNA regions in common human disease, painting a complex picture where common disease is influenced by hundreds or thousands of distinct loci that largely fall within non-coding DNA. Non-coding DNA makes up 98% of the genome and is largely not under evolutionary conservation, making it difficult to distinguish critical regulatory DNA sequences from their non-functional surroundings. The work presented in this thesis describes computational and
experimental approaches to understand how genetic variants in non-coding DNA can affect molecular processes and ultimately cellular and organismal phenotypes associated with human traits and disease.
Background
Genetic architecture of human disease and the implications for therapeutics development
Tracing the inheritance of human genetic variation within families and populations has led to the discovery of thousands of regions of the human genome associated with a plethora of rare diseases2. In the cases of rare Mendelian diseases, the majority of
pathogenic mutations are localized to protein-coding regions and these mutations are often individually capable of conferring a strong deleterious phenotype. These family-based “linkage” analyses use genetic markers, such as single nucleotide polymorphisms (SNPs), short insertions and deletions (indels) or larger structural variants, as a proxy to infer the inheritance of different segments of DNA from parents to children3 (Fig. 1). The
linkage, or statistical correlation between inheritance of a specific genetic marker and the phenotypic manifestation of a disease, has been used highly effectively to map mutations
contributing to Mendelian diseases, however this group of statistical approaches is not applicable to complex traits and diseases that do not have clear family clustering and inheritance patterns and are believed to be influenced by the collective effects of hundreds or thousands of genetic loci. Population genetics offers a solution to this problem through the design of a genetic association study, where instead of tracking allele transmissions within pedigrees through time, the frequencies of densely spaced polymorphic alleles spanning the entire human genome are compared within cohorts drawn from the human population2 (Fig. 1). Unlike a family-based linkage study, the genome-wide association
study (GWAS) uses cohorts of unrelated individuals to avoid artifacts from genetic relatedness and thus does not explicitly model a family structure. With increasingly large cohort sizes now in the hundreds of thousands of individuals, the genome-wide
association study has identified thousands of genetic loci targeting a multitude of biological pathways associated with complex human traits4.
Figure 1: Overview of two approaches for genetic mapping of human disease. Adapted from
Lander and Schork (1994)3. Left, Study design for genetic linkage analysis. A model is constructed
to identify genetic variants inherited within pedigrees that follow a similar transmission pattern as the disease phenotype (shaded individuals). Right, Study design for a case-control genetic
association study. For complex traits with hundreds or thousands of contributing genetic loci, allele frequencies are compared between sample groups with no consideration of family structure that would be too difficult to model under a linkage analysis.
Due to the presence of discrete recombination hotspots in the genome, individual alleles are often inherited with other nearby alleles, a phenomenon that is termed linkage
disequilibrium (LD, Fig. 2). Thus, the genotype of any particular SNPs is often statistically correlated with those nearby. This correlation is measured using two metrics – r2, the
14
population5. The strength of both metrics drop by distance from the SNP it is calculated
from, however it is not uncommon for any particular SNP to be in strong linkage disequilibrium (r2>0.8) with dozens of nearby variants. This effect of linkage
disequilibrium has two practical consequences on disease mapping. First, the correlation structure imposes a substantial reduction in the number of unique “haplotype blocks”, groups of SNPs strongly correlated to each other in genotypes across individuals, that are present in the human genome6 (Fig. 2). Thus, disease mapping can be accomplished by
genotyping only a subset of all human genetic variants, and the remaining unobserved genotypes could be computationally inferred by comparison to a pre-existing reference panel of individuals. This has the effect of reducing experimental burden for performing an association study across large cohorts of individuals. Second, the haplotype
architecture makes it difficult to identify the specific SNP(s) that are causally acting to influence a specific human disease or trait. The SNP in a particular locus with the lowest p-value for association may not be the causal variant contributing to an association signal, and on average it is statistically unlikely to be the case7.
Figure 2: Haplotype structure of the human genome. Adapted from Altshuler et al. (2008).
Genetic variants, such as SNPs, are densely spaced over an entire genome interval, and the possible allelic combinations that exist across individuals in a population are limited by the positioning of discrete recombination hotspots. Thus, SNP alleles are often correlated with each
16
The success of GWAS has led to a greater understanding of the architecture of complex human traits, but also the realization that in contrast to Mendelian disease, arriving at a mechanistic understanding of how complex disease loci influence phenotype will be substantially more difficult. This is for four main reasons: first, as described above there are many candidate causal variant(s) at each locus. Second, unlike in Mendelian disease, the vast majority of loci associated with complex traits reside outside protein-coding regions, complicating the identification of a causal gene, if any, and increasing the number of possible molecular mechanisms through which the locus can act. Third, the collection of current GWAS hits collectively often explain only a small proportion of the total heritability for any disease8,9. With few exceptions, GWAS loci have very modest
effect sizes. In contrast to Mendelian disease, where there is often a singular large-effect perturbation of a pathway, for any complex trait there appear to be orders of magnitude more loci that each act to subtly perturb many different pathways2. Fourth, the observed
distribution of modest effect sizes, which may have been caused by evolutionary pressure acting against strongly deleterious variants, combined with a large multiple hypothesis-testing burden necessitates that GWAS be performed with very large cohorts to achieve sufficient statistical power to implicate any individual locus8 (Fig. 3). These four problems
compel the development of computational and experimental tools to “fine map” individual GWAS loci to identify the causal variants and identify therapeutically important genes and pathways involved in complex human disease.
Figure 3: Sample sizes required in genome-wide association studies to detect loci with varying
effect size. Adapted from Altshuler et al. (2008)2. Columns correspond to varying degrees of
statistical power to reach genome-wide significance (p<5x10⁻⁸). Curves correspond to different
frequencies (f) of disease-causing allele in the cohort.
Genetic mapping of Mendelian diseases often implicate genes encoding proteins with a direct functional role in a critical cellular process, such as the CFTR gene for cystic fibrosis that acts as a channel for chloride ions in the lung, or the phenylalanine
hydroxylase enzyme that when lost leads to an inability to metabolize phenylalaine and the development of phenylketonuria. However, genetic mapping of Mendelian diseases occasionally implicates mutations in regulators of gene expression, such as transcription factors or chromatin remodelers, as the culprits for a particular disease, indicating that pathogenic mutations are not confined to only proteins with a direct biochemical role in a disease phenotype but can also target upstream transcriptional regulators of such
proteins10,11. Remarkably, there is also recent evidence indicating that mutations in the
binding sites of transcription factors on DNA can similarly be causal for human disease12.
As non-coding DNA represents 98% of the human genome and harbors many such transcriptional regulatory elements, we hypothesized that mutations and genetic variation
18
enhancers, could contribute to the pathogenesis of complex diseases as well. In particular, as the majority of variants associated with complex traits identified through GWAS do not appear to affect protein-coding sequence, we believe that a detailed investigation of genomic variation in enhancers is critical for understanding the etiology of complex human traits.
Regulation of gene transcription
Advances in genome research have provided an unprecedented opportunity to investigate the function of transcriptional enhancers – noncoding DNA regulatory regions that control transcription. The recognition that transcriptional enhancer elements contribute to gene activation was first illustrated in the early 1980’s based on experiments using SV40 viral enhancers to drive transcription in vitro13. These distal enhancers have
subsequently been shown to function at variable distances from the genes they regulate (up to 1Mb away), and can function in an orientation-independent manner to promote expression of reporter genes both in vitro and in vivo14-16. Enhancer trapping experiments
in Drosophila provided critical evidence that these non-coding cis-regulatory regions mediate the precise spatial and temporal control of gene expression during metazoan development17. However, pinpointing the location of distal enhancers in the genome has
historically been difficult because these elements reside at variable distances from the genes they regulate and lack conspicuous sequence features similar to those leveraged to annotate the genome for protein-coding genes. In the past decade, high-throughput analyses of the binding of transcription factors (TFs) and chromatin regulators as well as histone modification patterns and DNase I accessible sites have led to the identification of hundreds of thousands of enhancers across a large number of different cell types and tissues in flies, mice, and humans18-24. As transcription factors bind to enhancer elements
and recruit co-activators and chromatin regulators to facilitate transcription, the
experimentally-derived binding sites of these TFs and chromatin remodelers has become a widely used proxy for enhancer identification.
Epigenetic landscapes predict enhancer activity
Large-scale studies using chromatin immunoprecipitation followed by high-throughput sequencing (ChIP-seq) have recently identified hundreds of thousands of distal enhancer elements in the human genome at various tissues and at different development stages. Their discovery has revealed new insights into the mechanistic details of how tissue-specific gene expression patterns are established and maintained during development. Emerging evidence indicates that tissue-specific transcription factors and chromatin regulators coordinate the activation of distal enhancers to ensure robust control of gene expression programs in a cell type-specific manner. The recent ability to identify
enhancers on a global scale has provided investigators with new opportunities to dissect how cis-regulatory elements control gene expression programs in normal and disease states.
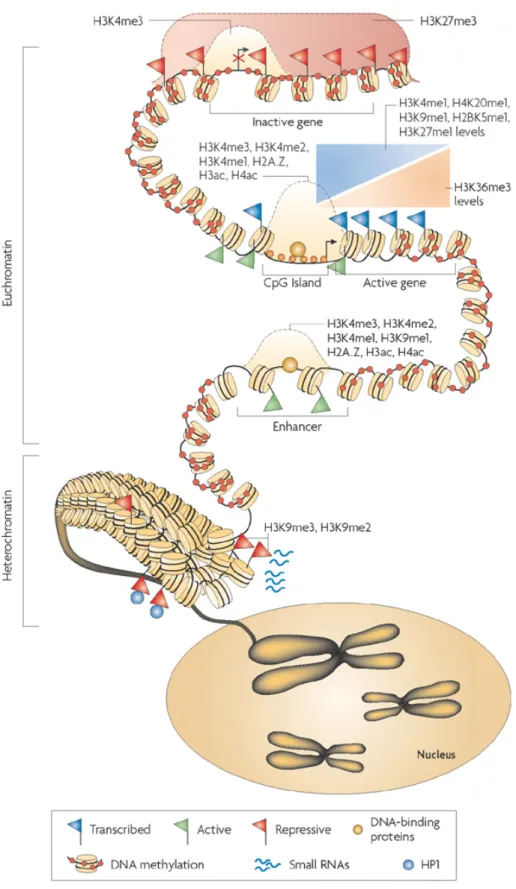
Genome-wide profiling of post-translational histone modifications has similarly become a powerful method for identifying tissue specific regulatory elements (Figure 4). In particular, mono-methylation of histone H3 lysine 4 (H3K4me1) and acetylation of histone H3 lysine 27 (H3K27ac) can identify active enhancer regions in the genome19,23,24.
H3K4me1 marks various classes of enhancer elements as well as promoters depending on the co-occurrence of H3K4me1 with other histone modifications. Specifically, the
combination of H3K4me1 and H3K27ac marks the class of “active enhancers”, designated as these elements strongly correlate with transcriptional activation of target genes19,23,24. In
contrast, the presence of H3K4me1 alone has been used to predict enhancer elements and is generally indicative of a “weak enhancer” that shows weaker but still statistically
significant correlation with transcriptional activation of nearby genes. The set of enhancers identified by histone modification patterns is highly unique in each cell type and active enhancers often neighbor genes with cell type specific functions. Collectively, combinations of histone modifications can distinguish enhancer states and can be used to predict non-coding regions of the genome important in transcriptional regulation.
20
Additional histone modifications have been implicated in the regulation of enhancer regions and may allow for further delineation of different subclasses of enhancer regions. For example, the repressive mark H3K27me3 and the active marks H3K4me3 and
H3K4me2, appear to be enriched at subsets of these cis-regulatory elements. H3K27me3 in combination with activating modifications has been shown to mark “poised” enhancer regions in embryonic stem cells and implicates Polycomb activity in regulating enhancer states prior to transcriptional activation and also in deactivation of enhancer elements, similar to its role at gene promoters19,23,25. Conversely, enrichment of several other marks
including H3K9ac and H3K18ac is associated with active enhancer regions23,25. In
Drosophila, H3K79me3, a mark of active transcription, has also been implicated at active enhancers occupied by RNAPII26. Thus, future investigations aimed at determining how
combinations of histone modifications distinguish regulatory regions and impact transcription of target genes may reveal additional insights into enhancer biology.
22
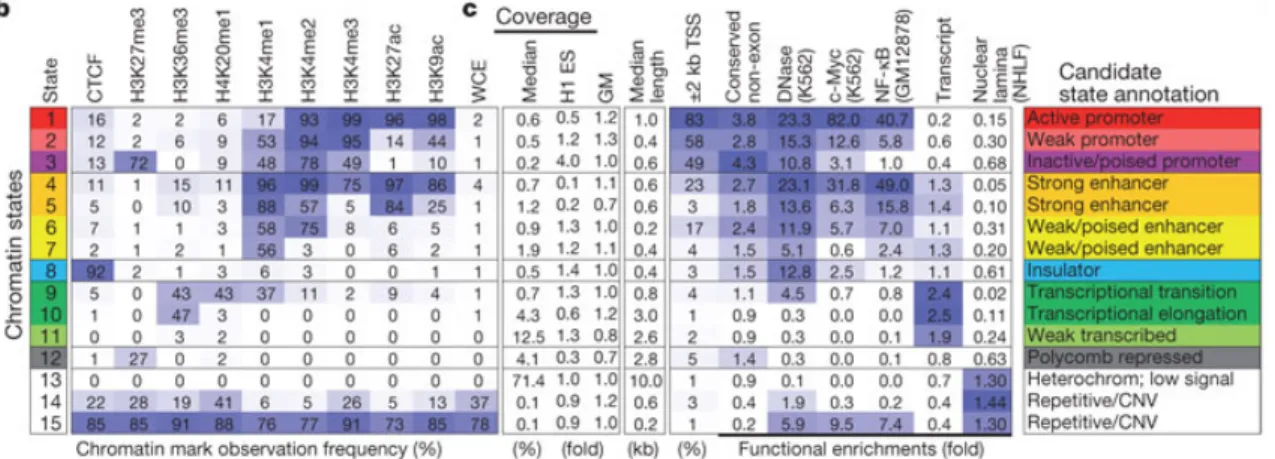
Combinations of epigenomic marks, including histone modifications, can be integrated in a formal machine learning framework to identify chromatin “states”. One approach taken by Ernst and Kellis (2010) uses an unsupervised machine learning approach, the multivariate Hidden Markov Model (HMM), to discover over-represented combinations of epigenomic marks in the genome23,28 (Fig. 5). Specifically, the multivariate HMM
models multiple “observed” input data tracks, such as the genome-wide presence of various histone modifications, as being generated by unobserved “hidden” states that each individually represent a class of genomic element, such as an active enhancer or heterochromatic region. This model, termed ChromHMM, has been applied to dozens of marks, however a core set of 5 and 7 histone modifications are now commonly used to annotate the genome into 15 or 18 informative chromatin states, respectively,
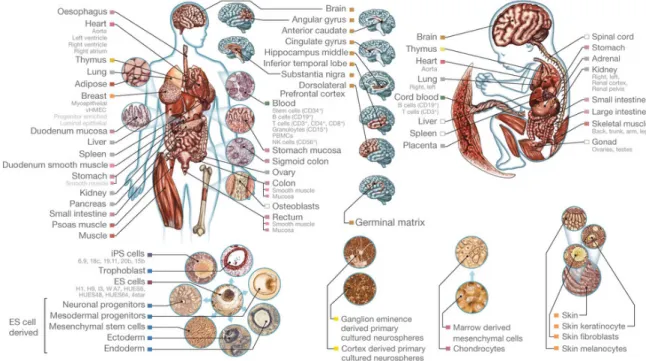
encompassing both active and repressive regulatory regions (Fig. 5). This approach was recently expanded to profile histone modifications across 127 different human tissues and cell lines under the Epigenomics Roadmap project and predict both 15 and 18-state ChromHMM models in these regions (Fig. 6, 7).
Figure 5: Systematic unbiased annotation of the human genome using epigenomic marks.
Adapted from Ernst et al. (2011). ChromHMM uses an unbiased machine learning algorithm to scan the genome and identify recurring combinations of histone modifications. These
combinations of histone modifications correspond to distinct “chromatin states” that are enriched for a variety of genomic elements, including promoters, enhancers and repressed regions28.
Figure 6: Overview of human tissues and cell lines used profiled by the Roadmap Epigenomics
24
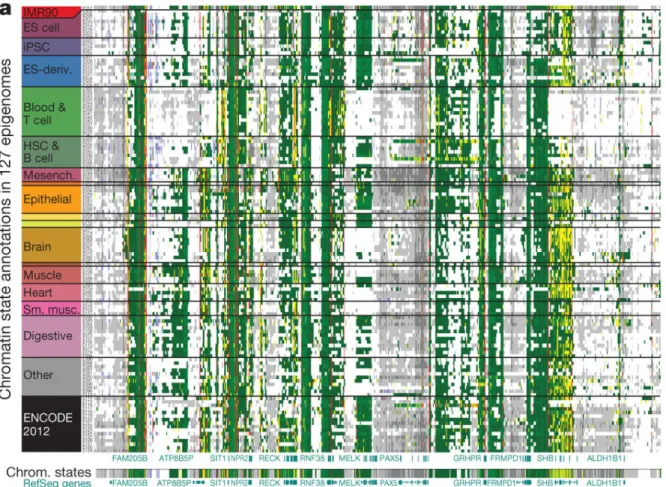
Figure 7: ChromHMM-predicted chromatin states across epigenomics of 127 human tissues
and cell lines. Adapted from the Roadmap Epigenomics Consortium (2015)20. Coloring of
chromatin states correspond to coloring used in Figure 5. Some regions of the genome (e.g. promoters and transcribed regions) maintain the same chromatin state across cell types, while others are highly variable and tissue-specific.
Regulating enhancer activity by modulating DNA accessibility
Access to DNA plays a critical role in the ability of the transcriptional machinery to recognize sequence features at promoter regions and at the numerous distal regulatory elements required for precise control of gene expression. Studies using DNaseI or the Tn5 transposon, both enzymes that preferentially cleave DNA in regions of open chromatin, combined with high-throughput sequencing have proved successful in identifying
regulatory regions on a genome-wide level29-31. These DNaseI hypersensitive sites (DHSs)
or ATAC-seq (Assay for Transposase-Accessible Chromatin with high-throughput sequencing) peaks discretely mark TF binding throughout the genome and can identify a broad set of regulatory elements, including enhancers, silencers, boundary elements and
promoters in a relatively unbiased manner31. Thus, mapping open chromatin can capture
the shifting regulatory landscape that occurs during developmental transitions.
Exploiting this principle, punctate regions of open chromatin have now been profiled in a wide array of human tissues and cell types. Among the cell types tested by the Roadmap Epigenomics Consortium, DHS signatures could be used to identify the developmental identity of the cell20. The importance of DNA accessibility in regulatory regions
throughout the genome in a cell type specific manner suggests that certain factors must locate, define, and initiate the process of opening chromatin in these regions. A class of transcription factors, termed “pioneer factors”, possess the ability to bind regions of silent chromatin and initiate the cascade of events leading to recruitment of chromatin
remodelers and downstream transcription factors32. Emerging evidence suggests that
pioneer factors bind regulatory regions early in development to facilitate rapid
transcriptional responses. The binding of pioneer factors at enhancer elements provides a molecular explanation for the persistence of a subset of DHSs across regulatory regions as cells differentiate. Although the exact mechanism by which pioneer factors alter overall chromatin structure to prime DNA for future regulatory events is not fully understood, these factors clearly play important roles in establishing the early connection between lineage specific transcription factors and the enhancer network.
Association mapping to identify disease loci
Emerging evidence suggests that the perturbation of enhancer activity by disease-associated single nucleotide polymorphisms (SNPs) is a common phenomenon33-36. For
example, a recent genome-wide study identified enhancers in seven cell types and demonstrated that trait-associated SNPs were specifically enriched in enhancers from biologically relevant cell types28. Similar observations were reported by comparing the
localization of disease SNPs to DHSs37. These two studies suggest that SNPs can
26
Disruption of enhancer activity may occur through a mechanism where the SNP either adds or removes a TF binding site and alters the activity of enhancer and expression of a nearby gene. Indeed, recent targeted studies demonstrated that individual disease-associated loci identified through genome wide association studies (GWAS) could affect TF binding. For example, the minor allele at rs12740374, a GWAS SNP within a non-coding region on chromosome 1p13 that affects plasma LDL cholesterol levels and myocardial infarction risk, resulted in the creation of a novel C/EBP binding site that increased expression of a nearby gene, SORT1, that is involved in controlling VLDL secretion from the liver33. Another recent study found that the rs1421085 at the FTO
locus in obesity disrupted an ARID5B binding site that controls IRX3 and IRX5
expression, altering the balance between adipocyte thermogenesis and lipid storage38 (Fig.
8). Collectively, these studies strongly support the idea that non-coding regulatory region such as enhancers are disrupted by complex trait variants.
Figure 8: Overview of FTO/IRX3/IRX5 locus molecular mechanism in obesity. Adapted from
Claussnitzer et al. (2015)38. A non-coding SNP, rs1421085, in the FTO-obesity locus alters
ARID5B binding at an enhancer that regulates IRX3/5 expression and the balance between adipocyte thermogenesis and lipid storage.
The identification of specific causal variants at individual GWAS loci remains another outstanding problem in the human genetics field. While initial studies focused primarily on the SNPs with the most significant p-value at each locus, these “lead” SNPs are often in linkage disequilibrium with dozens of other SNPs and variants2. Therefore, at most
GWAS loci, it is statistically unlikely that the lead SNP is responsible for the discovered association signal. Epigenetics may play a critical role in resolving this issue by providing annotations for the regions surrounding SNPs, which help prioritize candidate causal SNPs for experimental validation. Demonstrating that putative causal SNPs can cause molecular or cellular phenotypes will be an important next step. Recent advances in genome engineering, including CRISPR-Cas9-based systems, have the potential to make this step a possibility39,40. Thus, strategies using epigenomics to interpret association
signals from human genetics can be used to uncover mechanistic insights into the molecular pathways underlying complex human traits and the role of enhancers in this process.
28
References
1. Plenge, R. M., Scolnick, E. M. & Altshuler, D. Validating therapeutic targets through human genetics. Nat Rev Drug Discov 12, 581–594 (2013).
2. Altshuler, D., Daly, M. J. & Lander, E. S. Genetic mapping in human disease. Science 322, 881–888 (2008).
3. Lander, E. S. & Schork, N. J. Genetic dissection of complex traits. Science 265, 2037–2048 (1994).
4. Hindorff, L. A. et al. Potential etiologic and functional implications of genome-wide association loci for human diseases and traits. Proceedings of the National Academy of Sciences 106, 9362–9367 (2009).
5. Raychaudhuri, S. Mapping Rare and Common Causal Alleles for Complex Human Diseases. Cell 147, 57–69 (2011).
6. Gabriel, S. B. The Structure of Haplotype Blocks in the Human Genome. Science
296, 2225–2229 (2002).
7. Farh, K. K.-H. et al. Genetic and epigenetic fine mapping of causal autoimmune disease variants. Nature (2014). doi:10.1038/nature13835
8. Manolio, T. A. et al. Finding the missing heritability of complex diseases : Article : Nature. Nature 461, 747–753 (2009).
9. Maher, B. Personal genomes: The case of the missing heritability. Nature 456, 18– 21 (2008).
10. Zaidi, S. et al. De novo mutations in histone-modifying genes in congenital heart disease. Nature 498, 220–223 (2013).
11. Li, N. et al. Mutations in the Histone Modifier PRDM6 Are Associated with Isolated Nonsyndromic Patent Ductus Arteriosus. The American Journal of Human Genetics 98, 1082–1091 (2016).
12. Smemo, S. et al. Regulatory variation in a TBX5 enhancer leads to isolated congenital heart disease. Hum. Mol. Genet. 21, 3255–3263 (2012).
13. Banerji, J., Rusconi, S. & Schaffner, W. Expression of a β-globin gene is enhanced by remote SV40 DNA sequences. Cell 27, 299–308 (1981).
14. Bulger, M. & Groudine, M. Functional and Mechanistic Diversity of Distal Transcription Enhancers. Cell 144, 327–339 (2011).
15. Maston, G. A., Evans, S. K. & Green, M. R. Transcriptional regulatory elements in the human genome. Annu Rev Genomics Hum Genet 7, 29–59 (2006).
16. Atchison, M. L. Enhancers: Mechanisms of Action and Cell Specificity. Annu. Rev. Cell. Biol. 4, 127–153 (1988).
17. O'Kane, C. J. & Gehring, W. J. Detection in situ of genomic regulatory elements in Drosophila. Proc. Natl. Acad. Sci. U.S.A. 84, 9123–9127 (1987).
18. Barski, A. et al. High-resolution profiling of histone methylations in the human genome. Cell 129, 823–837 (2007).
30
20. Consortium, R. E. et al. Integrative analysis of 111 reference human epigenomes. Nature 518, 317–330 (2015).
21. Visel, A. et al. ChIP-seq accurately predicts tissue-specific activity of enhancers. Nature 457, 854–858 (2009).
22. Nord, A. S. et al. Rapid and Pervasive Changes in Genome-wide Enhancer Usage during Mammalian Development. Cell 155, 1521–1531 (2013).
23. Ernst, J. & Kellis, M. Discovery and characterization of chromatin states for systematic annotation of the human genome. Nat Biotechnol 28, 817–825 (2010).
24. Creyghton, M. P. et al. Histone H3K27ac separates active from poised enhancers and predicts developmental state. Proceedings of the National Academy of Sciences 107, 21931–21936 (2010).
25. Zentner, G. E., Tesar, P. J. & Scacheri, P. C. Epigenetic signatures distinguish multiple classes of enhancers with distinct cellular functions.
26. Taylor, G. C. A., Eskeland, R., Hekimoglu-Balkan, B., Pradeepa, M. M. &
Bickmore, W. A. H4K16 acetylation marks active genes and enhancers of embryonic stem cells, but does not alter chromatin compaction. Genome Res. 23, 2053–2065 (2013).
27. Schones, D. E. & Zhao, K. Genome-wide approaches to studying chromatin modifications. Nat Rev Genet 9, 179–191 (2008).
28. Ernst, J. et al. Mapping and analysis of chromatin state dynamics in nine human cell types. Nature 473, 43–49 (2011).
29. Buenrostro, J. D., Giresi, P. G., Zaba, L. C., Chang, H. Y. & Greenleaf, W. J. Transposition of native chromatin for fast and sensitive epigenomic profiling of open chromatin, DNA-binding proteins and nucleosome position. Nature Methods 10, 1213– 1218 (2013).
30. Neph, S. et al. Circuitry and Dynamics of Human Transcription Factor Regulatory Networks. Cell 150, 1274–1286 (2012).
31. Thurman, R. E. et al. The accessible chromatin landscape of the human genome. Nature 489, 75–82 (2012).
32. Smale, S. T. Pioneer factors in embryonic stem cells and differentiation. Curr. Opin. Genet. Dev. 20, 519–526 (2010).
33. Musunuru, K. et al. From noncoding variant to phenotype via SORT1 at the 1p13 cholesterol locus. Nature 466, 714–719 (2000).
34. Smemo, S. et al. Obesity-associated variants within FTO form long-range functional connections with IRX3. Nature 507, 371–375 (2014).
35. Bezzina, C. R. et al. Common variants at SCN5A-SCN10A and HEY2 are
associated with Brugada syndrome, a rare disease with high risk of sudden cardiac death. Nature Genetics 45, 1044–1049 (2013).
36. van den Boogaard, M. et al. Genetic variation in T-box binding element functionally affects SCN5A/SCN10A enhancer. J. Clin. Invest. 122, 2519–2530 (2012).
37. Maurano, M. T. et al. Systematic Localization of Common Disease-Associated Variation in Regulatory DNA. Science 337, 1190–1195 (2012).
32
38. Claussnitzer, M. et al. FTOObesity Variant Circuitry and Adipocyte Browning in Humans. N Engl J Med 373, 895–907 (2015).
39. Sanjana, N. E. et al. High-resolution interrogation of functional elements in the noncoding genome. Science 353, 1545–1549 (2016).
40. Ran, F. A. et al. Double Nicking by RNA-Guided CRISPR Cas9 for Enhanced Genome Editing Specificity. Cell 154, 1380–1389 (2013).
Chapter 2
Discovery and validation of sub-threshold genome-wide
association study loci using epigenomic signatures
A similar version of this work has been published
Wang, X. et al. Discovery and validation of sub-threshold genome-wide association study loci using epigenomic signatures. eLife 5, e10557 (2016).
36
Abstract
Genetic variants identified by genome-wide association studies explain only a modest proportion of heritability, suggesting that meaningful associations lie “hidden” below current thresholds. Here, we integrate information from association studies with epigenomic maps to demonstrate that enhancers significantly overlap known loci
associated with the cardiac QT interval and QRS duration. We apply functional criteria to identify loci associated with QT interval that do not meet genome-wide significance and are missed by existing studies. We demonstrate that these “sub-threshold” signals represent novel loci, and that epigenomic maps are effective at discriminating true biological signals from noise. We experimentally validate the molecular, gene-regulatory, cellular and organismal phenotypes of these sub-threshold loci, demonstrating that most sub-threshold loci have regulatory consequences and that genetic perturbation of nearby genes causes cardiac phenotypes in mouse. Our work provides a general approach for improving the detection of novel loci associated with complex human traits.
Introduction
Genome-wide association studies (GWAS) hold the promise of identifying genetic loci that drive complex disease, however realizing this goal has been challenging due to the modest effect sizes of most common variants that require extremely large cohorts to detect with significance. The recent demonstration that disease-associated single
nucleotide polymorphisms (SNPs) reside preferentially in enhancer elements provides a unique opportunity to leverage epigenomic maps of regulatory elements for
understanding the function of known GWAS loci and for prioritizing new loci missed in current studies1-4. Despite increasingly large GWAS cohort sizes, the current catalog of
genome-wide significant loci still explains only a modest proportion of the heritability for any given trait, with an excess of low p-value loci still below the genome-wide significance threshold5. These observations suggest that many more signals with “sub-threshold”
significance remain to be identified, however, the recognition of biologically relevant sub-threshold loci is hindered by a higher false positive rate6-8. Thus, new computational
approaches that integrate genetic data with genome-wide epigenomic profiles are needed to use existing cohorts to discover new loci and genes that influence complex traits and diseases.
Here, we use epigenomic maps of 127 tissues from the Roadmap Epigenomics Project as a guide to systematically identify biologically relevant sub-threshold variants9. As proof of
concept, we focused on two cardiac traits with clinical significance: electrocardiographic QT interval reflecting myocardial repolarization and QRS duration reflecting cardiac conduction. These two traits have a clear tissue of origin and published GWASs have reported over a hundred QT/QRS loci, making these traits ideal for testing variants with sub-threshold significance6-8. In particular, variation within QT interval length plays an
important role in human disease, where extreme QT prolongation is associated with sudden cardiac death and can occur as an unintended side effect of many non-cardiac medications10,11. We combine genome-wide maps of cardiac enhancer activity with the
38
these sub-threshold loci can alter enhancer activity, and we implicate specific genes through which these loci act to influence QT interval length. Importantly, we
demonstrate that epigenetic signals can distinguish true biological signals from noise, thus bypassing the higher false positive rate that has previously hindered study of sub-threshold loci. We expect our work will uncover new genes involved in cardiac
electrophysiology, aid in the identification of patients at risk for sudden cardiac death, and enable development of new treatments for susceptible individuals. More broadly, our work demonstrates the power of integrating epigenomics with existing GWAS to discover sub-threshold genetic loci and novel genes associated with complex human disease.
Results
QT/QRS-associated variants are enriched in cardiac enhancers
We compiled a list of 112 QT/QRS loci from the NHGRI GWAS database (accessed July 2013) and identified SNPs in strong linkage disequilibrium (r2>0.8) using genotype data
from the 1000 Genomes Project (Phase 1, CEU population)12. We also collected GWAS
loci from a later meta-analysis of QT interval studies, published in June 2014 by Arking et al., which we held out from the aforementioned 112 QT/QRS loci as a validation dataset for subsequent analyses5. While Mendelian disease mutations often alter the function of
proteins and are thus found in protein-coding regions of the genome, the majority of common variants (those where the frequency of the minor allele in the population is greater than 5%) linked to common human traits and diseases are reported to lie within non-coding regions of the genome. In line with this, we find that only 22 of 112 loci (20%) associated with QT interval length and QRS duration harbor SNPs that overlap exons. Thus, we hypothesized that many common genetic loci associated with QT/QRS and other traits act on the regulation of gene transcription, rather than on protein function. To test if this is the case, we first computationally examined whether QT/QRS variants are present in predicted transcriptional enhancer elements more often than expected. As specific histone modifications such as H3K27ac and H3K4me1 are [enriched at enhancer elements], we used the combination of histone modifications maps to
predicted cardiac enhancers genome-wide. We used chromatin maps across 127 tissues generated by the Roadmap Epigenomics Project including adult left ventricle (LV), adult right ventricle (RV), fetal heart (FH) and adult right atrium (RA), first focusing on enhancers defined by five histone modifications – H3K4me1, H3K4me3, H3K9ac, H3K36me3, and H3K27me3, chosen to maximize the number of distinct human tissues with available enhancer predictions9. QT/QRS variants have greatest overlap with
predicted enhancers (as defined by high levels of H3K4me1 and low H3K4me3 using ChromHMM) from the four cardiac tissues compared to the other 123 non-cardiac tissues (red circles, Fig. 1b, Supplementary File 1)1. To assess the statistical significance of
this overlap, we sampled a background distribution of “control” loci in the genome that have genetic characteristics similar to the 112 QT/QRS loci but do not show statistical association with cardiac electrophysiology. We matched control loci for genetic
properties including minor allele frequency, number of SNPs in LD, distance to nearest gene, number of nearby genes, and presence on an Affymetrix 660W genotyping array (Fig. 1a, Methods). Of the 127 tissues, we observed that enhancers from the four cardiac tissues were most enriched for QT/QRS loci compared to the sampled background of control loci. In particular, enhancers from the LV showed the strongest enrichment of any tissue (z-score=7.67, empirical p<1x10⁻⁵, 105 permutations), demonstrating that an
unbiased analysis can resolve the causal tissue with high precision, as QT interval and QRS duration are primarily reflective of myocardial repolarization in the ventricles.
40
Figure 1. GWAS repolarization loci preferentially overlap cardiac enhancers. a, Enrichment of
human left ventricle enhancers in 112 QT/QRS loci. The number of loci that contain a SNP overlapping an enhancer are computed for the 112 QT/QRS loci, and compared against 100,000 permutations of randomly sampled control loci matched for LD block size (number of SNPs), MAF, distance to nearest gene, number of nearby genes, and presence on genotyping array. b,
Top, Enrichment of enhancers from 127 human tissues in QT/QRS loci. Bottom, Enrichment of
enhancers from non-cardiac tissues for QT/QRS loci is substantially weaker following removal of enhancers active in any of the four cardiac tissues. c, Top, QT/QRS SNPs are more likely to disrupt motifs corresponding to expressed TFs compared to 100,000 sets of matched control loci.
Bottom, Weaker enrichment was observed between repolarization and matched control loci when
the sequence of the TF motif was randomly shuffled and re-mapped to the genome (10,000 permutations).
Enhancers are the most predictive class of elements for QT/QRS-associated SNPs
Because the left ventricle showed the strongest enrichment for QT/QRS loci, we focused on this tissue to determine the relative enrichment of diverse classes of annotations and to
identify the annotations that are most strongly associated with disease SNPs. We analyzed the enrichment of both coding annotations using GENCODE and non-coding
annotations using individual chromatin marks and chromatin states defined by ChromHMM as well as DNase I hypersensitivity (DHS) maps available in heart tissue1,13,14. We observed that intergenic enhancers are the most strongly enriched
annotated genomic region (z-score > 7.5) in QT/QRS loci, followed by gene transcription regions (z-score between 3 and 6) (Fig. 2 and 3). This enrichment increased significantly (z-score from 7.67 to 9.31 for left ventricle) when restricting the analysis to “strong” enhancers (H3K4me1 enhancers that are also marked by H3K27ac). Our results indicate that predicted enhancers are highly informative for annotating trait-associated variants compared to other classes of genomic regions.
42
Figure 2: 112 QT/QRS loci overlap enhancers more significantly than other genomic regions in adult left ventricle. Comparison of H3K4me1-enhancers defined by a 15-state model of
ChromHMM against other ChromHMM states including protein-coding and non-coding genes and their promoters as well as DNase I hypersensitive (DHS) peaks that broadly mark regulatory regions. The left panel shows the enrichment of features in the 112 GWAS loci compared to randomly sampled control loci; the right panel shows the total number of the 112 GWAS loci overlapped by each feature.
Left ventricle ChromHMM states (15 state model)
ChromHMM cardiac enhancers (15-state, H3K4me1)
ChromHMM strong cardiac enhancers (18-state, H3K4me1/K27ac)
DNase I Hypersensitivity peaks Gene body 1. Active TSS 2. Flanking active TSS 3. Transcription at gene 5’/3’ 4. Strong transcription 5. Weak transcription 6. Genic enhancers 7. Enhancers
8. ZNF genes & repeats 9. Heterochromatin 10. Bivalent TSS
11. Flanking bivalent TSS/enhancer 12. Bivalent enhancer
13. Repressed polycomb 14. Weak repressed polycomb 15. Quiescent Fetal heart Left ventricle Right atrium Right ventricle Left ventricle Right atrium Right ventricle Fetal heart
Expressed protein-coding genes Expressed lncRNAs
0 2.5 5.0 7.5 10.0 0 30 60
GWAS loci enrichment over control loci (z-score)
# GWAS loci overlapped Genomic feature
Figure 1 - figure supplement 1
Figure 1 – figure supplement 1. 112 QT/QRS loci overlap enhancers more significantly than
other genomic regions in adult left ventricle. Comparison of H3K4me1-enhancers defined by a 15-state model of ChromHMM against other ChromHMM states including protein-coding and non-coding genes and their promoters as well as DNase I hypersensitive (DHS) peaks that broadly mark regulatory regions. The left panel shows the enrichment of features in the 112 5
GWAS loci compared to randomly sampled control loci; the right panel shows the total number of the 112 GWAS loci overlapped by each feature.
Figure 3: QT/QRS loci overlap enhancers more significantly than other genomic regions in non-LV cardiac tissue. Comparison of enhancers defined by H3K4me1 against other
ChromHMM states in fetal heart, adult right ventricle and adult right atrium. The left panel shows the enrichment of features in the 112 GWAS loci compared to randomly sampled control loci; the right panel shows the total number of the 112 GWAS loci overlapped by each feature.
0.0 2.5 5.0 7.5 0 20 40 60
0 20 40 60 80
0.0 2.0 4.0 6.0 0 20 40 60 80
Adult right ventricle
GWAS loci enrichment over control loci (z-score)
# GWAS loci overlapped Active TSS Flanking active TSS Transcription at gene 5’/3’ Strong transcription Weak transcription Genic enhancers Enhancers ZNF genes & repeats Heterochromatin Bivalent TSS Flanking bivalent TSS/enhancer Bivalent enhancer Repressed polycomb Weak repressed polycomb Quiescent Active TSS Flanking active TSS Transcription at gene 5’/3’ Strong transcription Weak transcription Genic enhancers Enhancers ZNF genes & repeats Heterochromatin Bivalent TSS Flanking bivalent TSS/enhancer Bivalent enhancer Repressed polycomb Weak repressed polycomb Quiescent Active TSS Flanking active TSS Transcription at gene 5’/3’ Strong transcription Weak transcription Genic enhancers Enhancers ZNF genes & repeats Heterochromatin Bivalent TSS Flanking bivalent TSS/enhancer Bivalent enhancer Repressed polycomb Weak repressed polycomb Quiescent
Adult right atrium Fetal heart
0.0 2.0 4.0 6.0
44
We next asked whether LV enhancers that overlap QT/QRS loci have features that distinguish them from putative LV enhancers identified by ChromHMM that do not overlap QT/QRS loci (Fig. 4). First, we considered the density of H3K27ac marks, as the co-enrichment of H3K4me1 and H3K27ac correlates with strong enhancer activity15,16.
We found that the 65 enhancers overlapping 45 QT/QRS loci have a 3.1-fold higher H3K27ac density compared to non-GWAS LV enhancers (p=1.54x10⁻⁴). In fact,
incorporating H3K27ac into ChromHMM enhancer predictions resulted in substantially greater enrichment of QT/QRS loci (z-score = 10.10 vs. 8.29 for left ventricle); 44 of the 45 QT/QRS loci overlap an H3K27ac-defined “strong” enhancer. QT/QRS LV enhancers are also more likely to be marked by either H3K4me1 or H3K27ac in at least one of the other three heart tissues (fetal, right atrium, right ventricle) compared to non-GWAS LV enhancers (p-values between 0.008 and 0.07, Fig. 4) and less likely to be active in non-cardiac tissues (p=9x10⁻³, Fig. 4).
Left ventricular QT/QRS enhancers are significantly more hypomethylated than predicted LV enhancers not overlapping QT/QRS loci (hypomethylation p=1.07x10⁻⁶,
hypermethylation p=0.60, Fig. 4). Similar to H3K27ac, CpG hypomethylation correlates with increased enhancer activity, possibly through modulation of TF binding site accessibility17,18. Consistent with this idea, 22 of the 45 GWAS loci contain an enhancer
SNP that alters a predicted motif for a cardiac-expressed TF (empirical p=0.002, 105
permutations) (Fig. 1c). Moreover, QT/QRS GWAS enhancers are enriched for DHS and Cap Analysis Gene Expression (CAGE) signals in human fetal heart, both of which are marks of greater enhancer activity (Fig. 4) 14,19. Finally, QT/QRS left ventricular enhancers
show significant evolutionary conservation across the primate lineage compared to non-GWAS LV enhancers (p=6.82x10⁻⁵ compared to 105 size-matched sets of LV enhancers),
suggesting that perturbation of these enhancers is under stronger negative selection. Taken together, QT/QRS loci preferentially overlap conserved enhancers that show cardiac-restricted activity, suggesting that common variants associated with these loci play roles in regulating cardiac functions that drive human phenotypes.
Figure 4: Enhancers overlapping QT/QRS loci differ in functional characteristics from all enhancers. Several functional characteristics were compared between enhancers overlapping
QT/QRS loci (red) and non-GWAS left ventricle enhancers (blue). Fold change represents fold change between median values for the two groups, and p-values were calculated using the Mann-Whitney U test. See Methods for comparison methodology between GWAS QT/QRS enhancers and non-GWAS enhancers for each functional or epigenomic feature. For primate conservation, LV enhancers (blue) were size-matched (+/-1kb) to GWAS enhancers to control for skewed enrichments driven by larger GWAS enhancer size.
Applicability of enhancer enrichment for studying the genetics of other human traits and diseases
Quantifying the enrichment of GWAS loci in enhancers identified in a diverse panel of tissues has many potential uses within the human genetics field. For traits and diseases driven by known tissues-of-origin, observing enrichment of GWAS loci specifically in
Enhancer characteristic GWAS vs. non-GWAS LV enhancers Fold difference p-value
3.10 1.53x10⁻⁴
H3K27ac density log(H3K27ac density)
-10 -5 0 5
0.60 8.96x10⁻³
Activity in non-cardiac tissues (# non-cardiac tissues with activity)
0 25 50 75 (Proportion of LV-specific hypomethylated CpGs) LV-specific hypomethylation undef. 9.99x10⁻⁷ 222 more (14697 total) 0.0 0.1 0.2 0.3 2 more (37 total) NA 0.60 LV-specific hypermethylation (Proportion of LV-specific hypermethylated CpGs) 0.0 0.1 0.2 0.3 8 more (14697 total) 1.94 5.17x10⁻⁴ (DNase reads / kb) DNase I hypersensitivity fetal heart 0 1000 2000 3000 1234 more (50605 total) 3 more (65 total) 1.43x10⁻³ 1.30
CAGE-seq fetal heart (CAGE-seq reads / kb) 0 10 20 30 40 6 more (65 total) 2522 more (50605 total) 4.36x10⁻³ 4.11x10⁻² 1.14x10⁻² 1.24 F. heart 1.18 R. atrium 1.34 R. ventricle
Activity in cardiac tissues (Proportion overlap) 0 1 0 0.5 1 0 0.5 1 R. atrium R. ventricle F. heart 0.5 6.82x10⁻⁵ 1.14 Primate conservation (Average conservation best 100nt window) -0.25 0.00 0.25 0.50 0.75
46
enhancers identified from these tissues can act as an independent measure of validation to ensure that the loci did not reach genome-wide significance due to either technical artifacts from genotyping array usage, or biological cofounders such as population stratification20. For diseases where the tissue-of-origin is less clear, calculating enhancer
enrichments by tissue can serve as an initial unbiased computational screen for putative biologically relevant tissues for downstream experimental follow-up.
To demonstrate the applicability of computing enhancer enrichments for a variety of complex traits, we first performed similar enrichment analyses for a GWAS of myocardial mass21. This GWAS was performed on 73,518 individuals and identified 52 loci associated
with any of four electrophysiological traits associated with the QRS complex, a measure of ventricular depolarization. Using epigenomic information from the human adult left ventricle, we first calculated enrichments of overlap between these GWAS loci and six histone modifications that include both activating (e.g. H3K27ac, H3K4me1/3) and repressive modifications (e.g. H3K27me3, H3K9me3). We observed a substantial difference in enrichment of these six modifications: H3K27ac, the activating histone modification enriched at enhancers and promoters showed greatest enrichment for QRS-associated GWAS loci, while the two inactivating marks, H3K9me3 and H3K27me3, showed no enrichment for these GWAS loci, consistent with a role of these loci in promoting activation of gene expression. We also calculated the enrichment of overlap for the 53 voltage-associated GWAS loci and H3K4me1/H3K27ac-predicted enhancers identified in four cardiac developmental time points from an in vitro mouse
cardiomyocyte differentiation system. We observe a weak enrichment for enhancers from embryonic stem cell (ESC), mesoderm (MES) and cardiac progenitor (CP) cells, but a substantially stronger enrichment for enhancers identified at the cardiomyocyte (CM) stage, consistent with a role for the QRS-associated GWAS loci in altering cardiomyocyte depolarization.
Similar to the enrichment plots presented in Figure 1 for QT/QRS GWAS loci, we also computed enhancer enrichments for genome-wide significant loci identified from a
variety of other complex human traits and diseases including LDL cholesterol levels, type 1 diabetes, platelet count and ulcerative colitis22-25. For these four complex traits, we
observed that GWAS loci were enriched in specific tissues and cell types that match the known pathology of each trait or disease. For example, LDL cholesterol-associated GWAS loci are enriched in predicted active enhancers from adult liver tissue, while GWAS loci associated with platelet count are enriched in enhancers predicted from hematopoetic stem cells, the progenitor cell type that ultimately gives rise to platelets.
Figure 5: Enrichment of SNPs associated with myocardial mass in activating enhancers from human left ventricle and mouse cardiomyocytes. Left, Enrichment of GWAS SNPs associated
with QRS complex and myocardial mass in ChIP-seq peaks of histone modifications from the adult human left ventricle. Right, Enrichment of GWAS loci associated with the QRS complex and myocardial mass in active enhancers from four in vitro developmental timepoints in the mouse cardiomyocyte differentiation system. ESC – embryonic stem cells, MES – mesoderm cells, CP –
cardiac progenitor cells, CM – cardiomyocytes.
0 2 4 6
ESC MES CP CM
Enrichment of myocardial mass GWAS loci in active enhancers
48
Figure 6: Unbiased enhancer enrichment analysis distinguishes known causal tissue and cell types of origin for a variety of complex human traits and diseases. Enrichment and plots are
generated as described in Figure 1 for QT/QRS interval GWAS loci, with size of circles corresponding to number of GWAS loci that overlap enhancers from each tissue.
Common features in GWAS cardiac enhancers identify novel sub-threshold loci
Current GWAS loci collectively explain only a small fraction of the estimated heritability of a complex trait in part due to strict Bonferroni thresholds for multiple hypothesis
Enhancer enrichment in GWAS loci
0.0 2.5 5.0 -2.5 Liver LDL Cholesterol 127 human tissues 127 human tissues -2.5 0.0 2.5 5.0 7.5 Type 1 Diabetes Fetal thymus Blood & immune cell types
T-cells
0 3 6
9 Platelet count
Hematopoetic stem cells
K562 Leukemia Ulcerative colitis -2.5 0.0 2.5 5.0 7.5 10.0 T-cells NK cells Blood & immune cell types
Colon, GI mucosa
(z-score)
Enhancer enrichment in GWAS loci
(z-score)
127 human tissues 127 human tissues
IMR90 Blood & T-cell Neurosphere Heart
ESC HSC & B-cell Thymus Smooth muscle
iPSC Mesenchymal Brain Digestive
ES-derived Myosatellite Adipose Other
testing (p<5x10⁻⁸) and the limited statistical power of existing studies to discover variants
with modest effect sizes7,26. We hypothesized that knowledge of the genomic properties
associated with existing GWAS loci can guide the search for additional genetic signals that cannot be detected without increasing GWAS cohort sizes, and that these loci with weaker “sub-threshold” p-values (i.e. 0.05>p>5x10⁻⁸) might reveal novel genes and
biological pathways that contribute to complex disease. To test this idea, we used SNP summary statistics from the Arking et al. (2014) QT interval GWAS study we had earlier held out as a validation dataset5. These summary statistics include the 112 QT/QRS loci
identified by prior GWASs (red dots, bottom, Fig. 7), as well as loci that reach genome-wide significance in the larger meta-analysis cohort but were not discovered in any previous GWAS (and therefore were not included in the 112 QT/QRS loci used for enrichment analyses above, gold dots, bottom, Fig. 7). We observed that active LV enhancers are strongly enriched for loci harboring SNPs with p-values between 1x10⁻⁴
and 5x10⁻⁸ (Fig. 7a, black line). Furthermore, the combination of functional features
identified for above-threshold QT/QRS enhancers (Fig. 4) substantially improves sub-threshold locus enrichment across a wide range of p-value sub-thresholds (Fig. 7a, colored lines, Fig. 8).
50
Fig. 7. Cardiac enhancers harbor additional sub-threshold QT loci. a, Top, Enhancer
characteristics learned on above-threshold QT/QRS loci from Fig. 2 are predictive for additional sub-threshold loci (colored lines). Each point on a curve represents the fold difference in
proportion of SNPs with p-value below the cutoff in the enhancer set versus the whole genome.
Bottom, Manhattan plot of p-values for all SNPs from Arking et al. (2014) QT interval GWAS.
112 QT/QRS loci and all SNPs within 1Mb are highlighted in red. Genome-wide significant loci newly discovered by Arking et al. and not in the 112 QT/QRS loci are highlighted in yellow. b,
Top, Enrichment signals for sub-threshold SNPs in left ventricle enhancers persists following
removal of the 112 GWAS loci and nearby SNPs (+/- 1Mb). Bottom, Manhattan plot of p-values for all SNPs from Arking et al. (2014) QT interval GWAS following removal of 112 QT/QRS loci and all SNPs within 1Mb. Genome-wide significant loci newly discovered by Arking et al. and not in the 112 QT/QRS loci are highlighted in yellow.
a Enrichment for all b
QT GWAS SNPs Remove +/-1Mb around112 NHGRI GWAS loci
Sub-threshold SNP enrichmen
t
Enhancers vs. genome
H3K4me1-defined enhancers
H3K4me1/H3K27ac active enhancers 1
2 + high density of fetal heart DHS reads
3 1
2 + active in fetal heart
0 3 4 + LV-specific CpG hypomethylation = = = = = 0 2 4 6 8 10 0 2 4 6 8 10 12 0 2 4 6 8 10 0 2 4 6 8 10 12 -log(p-value) -log(p-value)
112 NHGRI GWAS loci (+/-1Mb)
New (held-out) loci with p<5x10⁻⁸
7 6 5 4 3 2 1 14 13 12 11 10 9 8 19 18 17 16 15 20 21 X 7 6 5 4 3 2 1 14 13 12 11 10 9 8 19 18 17 16 15 20 21 X Chromosome p=1x10⁻⁴ p=5x10⁻⁸ p=1x10⁻⁴ p=5x10⁻⁸ 0 2 4 6 8 10 0 2 4 6 8 10
Figure 8: High density of fetal heart DNase I hypersensitivity reads in LV enhancers is robustly informative for identifying enriched sets of sub-threshold loci. Top: Enrichment of
DHS reads in GWAS enhancers. Middle: Example comparison of sub-threshold locus enrichment in active LV enhancers vs. active LV enhancers with high DHS read density. Bottom: Y-axis of graphs corresponds to fold enrichment of sub-threshold loci in enhancers taken at three p-value cutoffs (10-4, 10-5 and 10-6). X-axis represents enrichments plotted for different subsets of
enhancers chosen by varying DHS read density cutoffs.
Whether the enrichment of SNPs in the sub-threshold significance range represents linkage disequilibrium with existing above-threshold GWAS SNPs or novel biologically relevant loci remains an unresolved question3. In fact, an enrichment analysis using only
SNPs nearby above-threshold GWAS loci produced a strong enrichment signature in the x-axis: varying thresholds: keep top x enhancers (x1000) with greatest fetal heart DNase I read density per kb
Enhancers with high fetal heart DHS read density
0 2 4 6 8 10 0 2 4 6 8 10 12
log(P value) cutoff
F
old en
richment
H3K4me1/H3K27ac active enhancers
Threshold: keep top 25,000 enhancers with greatest DNase I read density
0 2 4 6 8 10 0 2 4 6 8 10 12
log(P value) cutoff
F old en richment 0 1000 2000 3000 4000 5000 GWAS All 427 outliers (50670 total) DNase reads / kb 1.45 5.25x10⁻⁴ Fetal heart DNase I
hypersensitivity a b c a: p<10-4 cutoff 0 10 20 30 40 50 0 2 4 6 8 10 Fold enrichment b: p<10-5 cutoff 0 10 20 30 40 50 0 2 4 6 8 10 Fold enrichment c: p<10-6 cutoff 0 10 20 30 40 50 0 2 4 6 8 10 Fold enrichment Legend
Enrichment of H3K4me1/H3K27ac enhancers at cut-off
Enrichment for subsets of H3K4me1/H3K27ac enhancers at cut-off defined using DHS read density Enhancer subset used in Fig. 4 (removed bottom 25% of enhancers with lowest DHS read density)
a b c
Enhancer characteristic GWAS vs. all left ventricle enhancers Fold difference p-value
Figure 3 - figure supplement 1
Figure 3 – figure supplement 1. High density of fetal heart DNase I hypersensitivity reads in
LV enhancers is robustly informative for identifying enriched sets of sub-threshold loci. Top: Enrichment of DHS reads in GWAS enhancers. Middle: Example comparison of sub-threshold locus enrichment in active LV enhancers vs. active LV enhancers with high DHS read density. Bottom: Y-axis of graphs corresponds to fold enrichment of sub-threshold loci in enhancers 5
taken at three p-value cutoffs (10-4, 10-5 and 10-6). X-axis represents enrichments plotted for
52
took a conservative approach and removed all SNPs within 1Mb of the initial 112
QT/QRS loci. Remarkably, the enrichment for LV enhancers persists and increases in the sub-threshold range (i.e. p=1x10⁻⁴ to 5x10⁻⁸, Fig. 7b), likely due to removal of nominally
significant SNPs that are in LD with above-threshold QT/QRS loci and do not represent true association signals. In total, we identified 2075 SNPs with p<1x10⁻⁴ that are
independent of the 112 published QT/QRS loci, of which 208 SNPs overlap LV enhancers.
Figure 9: Enrichment in the sub-threshold significance range can be observed using only SNPs nearby known above-threshold loci. The foreground consisted of only SNPs within +/- 1Mb of
the 112 QT/QRS loci, and was compared against a background of all SNPs in the genome. Enrichment analyses were performed as described for Figure 7.
Epigenomic prioritization identifies sub-threshold loci with molecular functions
Because the enrichment of sub-threshold SNPs in cardiac enhancers suggests that epigenetic prioritization can be used as a starting point for more in-depth investigations of sub-threshold signals from GWAS, we sought to directly test the molecular hypothesis that these sub-threshold loci impact the transcriptional regulation of cardiac genes (Fig. 10a). We grouped all 2075 sub-threshold SNPs using linkage disequilibrium data (minimum r2=0.2) to identify 287 independent sub-threshold loci in the genome
(Methods). We prioritized loci where a sub-threshold SNP overlapped an active LV enhancer and either (i) also overlapped a fetal heart DNase I hypersensitivity peak or (ii) was an expression quantitative trait locus (eQTL) for a nearby gene. In total, we cloned allele-specific enhancer fragments from 22 cardiac enhancers that overlap SNPs from 18 independent sub-threshold loci, and performed quantitative luciferase assays in human iPSC-derived cardiomyocytes to determine whether the sub-threshold SNP genotypes influence enhancer activity (Methods). We observed that 13 of 18 sub-threshold loci (72.2%) contain an enhancer that drives luciferase activity in an allele-specific manner (Fig. 10b,d, Fig. 12, Fig. S1). Moreover, we estimate that between 51.1%-89.8% (95% Bayesian confidence interval) of prioritized sub-threshold loci show allele-specific activity on transcription, suggesting that the majority of sub-threshold loci identified by
54
Figure 10: Sub-threshold loci prioritized by epigenomics alter enhancer activity. a, Model
detailing how sub-threshold SNPs overlapping enhancers can affect QT interval. Green text:
methods used to test mechanistic step in model. b, Summary of luciferase enhancer reporter
experiments, cloning steps and luciferase enhancer reporter construct. c, Example luciferase assay on two haplotypes of containing the rs1044503 SNP shows allele-specific enhancer activity in human cardiomyocytes, n=24 per haplotype. Error bars represent standard error of the mean. d, Number of sub-threshold loci tested that exhibit significant allelic activity (p<0.05 between two haplotypes).
We also performed chromosome conformation capture combined with high-throughput sequencing (4C-seq) to experimentally test whether predicted enhancers in sub-threshold loci can form contacts with promoters, and to identify potential target genes of threshold enhancers. We used 4C-seq to test ten predicted enhancers from eight sub-threshold loci in human iPSC-derived cardiomyocytes27. Eight enhancers in six loci
formed enhancer-promoter interactions in the proximal 500kb region (Fig. 11c, Fig. 12, Fig. S2). This analysis provides evidence that the novel QT loci enhancers have regulatory activity and that the sub-threshold SNPs identified in our analyses can alter the activity of cardiac enhancers.
Figure 11: Predicted enhancers in sub-threshold loci form 3D interactions with nearby genes.
a, Model detailing how sub-threshold SNPs overlapping enhancers can affect QT interval. Green
text: methods used to test mechanistic step in model. b, Summary of luciferase enhancer reporter
experiments, cloning steps and luciferase enhancer reporter construct. c, Example luciferase assay on two haplotypes of containing the rs1044503 SNP shows allele-specific enhancer activity in human cardiomyocytes, n=24 per haplotype. Error bars represent standard error of the mean. d, Number of sub-threshold loci tested that exhibit significant allelic activity (p<0.05 between two