The MIT Faculty has made this article openly available.
Please share
how this access benefits you. Your story matters.
Citation
Zhang, Zhizhuo et al. "An AR-ERG transcriptional signature defined
by long-range chromatin interactomes in prostate cancer cells."
Genome Research 29, 2 (January 2019): 223-235 © 2019 Zhang et al.
As Published
http://dx.doi.org/10.1101/gr.230243.117
Publisher
Cold Spring Harbor Laboratory
Version
Final published version
Citable link
https://hdl.handle.net/1721.1/127808
Terms of Use
Creative Commons Attribution NonCommercial License 4.0
An AR-ERG transcriptional signature defined by
long-range chromatin interactomes in prostate cancer cells
Zhizhuo Zhang,
1,2,3,9Kern Rei Chng,
4,9Shreyas Lingadahalli,
5,6,9Zikai Chen,
4,5,6Mei Hui Liu,
4,10Huy Hoang Do,
4Shaojiang Cai,
4Nicola Rinaldi,
2Huay Mei Poh,
4Guoliang Li,
4,7Ying Ying Sung,
4Charlie L. Heng,
4Leighton J. Core,
8,11Si Kee Tan,
4Xiaoan Ruan,
4,12John T. Lis,
8Manolis Kellis,
2,3Yijun Ruan,
4,12Wing-Kin Sung,
1,4and Edwin Cheung
4,5,61
School of Computing, National University of Singapore, Singapore 117417;
2Computer Science and Artificial Intelligence
Laboratory, Massachusetts Institute of Technology, Cambridge, Massachusetts 02139, USA;
3Broad Institute of MIT and Harvard,
Cambridge, Massachusetts 02142, USA;
4Genome Institute of Singapore, Singapore 138672;
5Cancer Centre,
6Centre of Precision
Medicine Research and Training, Faculty of Health Sciences, University of Macau, Taipa, Macau 999078, China;
7National Key
Laboratory of Crop Genetic Improvement, Agricultural Bioinformatics Key Laboratory of Hubei Province, College of Informatics,
Huazhong Agricultural University, Wuhan, Hubei 430070, China;
8Department of Molecular Biology and Genetics, Cornell
University, Ithaca, New York 14853, USA
The aberrant activities of transcription factors such as the androgen receptor (AR) underpin prostate cancer development.
While the AR
cis-regulation has been extensively studied in prostate cancer, information pertaining to the spatial
architec-ture of the AR transcriptional circuitry remains limited. In this paper, we propose a novel framework to profile long-range
chromatin interactions associated with AR and its collaborative transcription factor, erythroblast transformation-specific
related gene (ERG), using chromatin interaction analysis by paired-end tag (ChIA-PET). We identified ERG-associated
long-range chromatin interactions as a cooperative component in the AR-associated chromatin interactome, acting in
con-cert to achieve coordinated regulation of a subset of AR target genes. Through multifaceted functional data analysis, we
found that AR-ERG interaction hub regions are characterized by distinct functional signatures, including bidirectional
tran-scription and cotrantran-scription factor binding. In addition, cancer-associated long noncoding RNAs were found to be
con-nected near protein-coding genes through AR-ERG looping. Finally, we found strong enrichment of prostate cancer
genome-wide association study (GWAS) single nucleotide polymorphisms (SNPs) at AR-ERG co-binding sites participating
in chromatin interactions and gene regulation, suggesting GWAS target genes identified from chromatin looping data
pro-vide more biologically relevant findings than using the nearest gene approach. Taken together, our results revealed an
AR-ERG-centric higher-order chromatin structure that drives coordinated gene expression in prostate cancer progression and
the identification of potential target genes for therapeutic intervention.
[Supplemental material is available for this article.]
A major effort in prostate cancer biology is to understand how the androgen receptor (AR) mediates prostate cancer development and maintenance (Shen and Abate-Shen 2010; Chng and Cheung 2013; Sung and Cheung 2014). A number of studies have shown that AR is responsible for dictating the transcriptional output that fuels the growth and survival of prostate cancer cells (Wang et al. 2007, 2009; Tan et al. 2012) Accordingly, therapies targeted against AR are highly touted for the treatment of prostate cancer (Tran et al. 2009; Clegg et al. 2012). Recent findings from the anal-ysis of genome-wide AR binding profiles (Wang et al. 2005, 2009)
revealed a highly complex transcriptional circuitry in which AR likely acts through distal enhancers far from gene promoters to achieve gene regulation (Yu et al. 2010; Chng et al. 2012). In addi-tion to regulating AR target gene transcripaddi-tion, AR-associated chro-matin looping also appears to be involved in the formation of recurrent fusion genes in prostate cancers (Lin et al. 2009; Mani et al. 2009). Together, these findings suggest that AR-associated chromatin interactions play an important role in prostate cancer biology.
AR acts in conjunction with a number of collaborative tran-scription factors (co-TFs) to precisely regulate the trantran-scription of target genes in prostate cancer cells (Wang et al. 2007). Thus, co-TFs might also be involved in AR-associated chromatin in-teractions. Indeed, findings from our group and others suggest
9These authors contributed equally to this work.
Present addresses: 10Food Science and Technology Programme, Department of Chemistry, National University of Singapore, Singapore 117543; 11Molecular and Cell Biology Institute for Systems Genomics, University of Connecticut, Farmington, CT 06030, USA; 12The Jackson Laboratory for Genomic Medicine, Farmington, CT 06032, USA
Corresponding authors: yijun.ruan@jax.org, manoli@mit.edu, sungk@gis.a-star.edu.sg, echeung@umac.mo
Article published online before print. Article, supplemental material, and publi-cation date are at http://www.genome.org/cgi/doi/10.1101/gr.230243.117.
© 2019 Zhang et al. This article is distributed exclusively by Cold Spring Harbor Laboratory Press for the first six months after the full-issue publication date (see http://genome.cshlp.org/site/misc/terms.xhtml). After six months, it is available under a Creative Commons License (Attribution-NonCommercial 4.0 International), as described at http://creativecommons.org/licenses/by-nc/4.0/.
transcriptional crosstalk between AR and the prostate cancer recur-rent fusion gene, ERG, could be established through chromatin loops (Chen and Sawyers 2010; Chng et al. 2012). With regard to genome organization, recent studies showed that (1) ectopic ex-pression of ERG in prostate cancer cells leads to a global alteration of higher-order chromatin organization (Rickman et al. 2012), (2) a chromosomal rearrangement-prone phenotype appears to be asso-ciated with ERG-fusion-positive prostate cancers (Pflueger et al. 2011), and (3) AR and ERG colocalized binding sites are enriched in breakpoints in ERG-fusion-positive prostate cancers but not in their ERG-fusion-negative counterparts (Berger et al. 2011). Taken together, these findings strongly suggest the importance of ERG in AR-associated higher-order chromatin structure for tran-scriptional activity and in the development of genomic structural alterations.
In this study, utilizing our previously developed genomic technology (Fullwood et al. 2009), chromatin interaction analysis by paired-end tag (ChIA-PET) sequencing, we comprehensively mapped AR- and ERG-associated chromatin loops and character-ized in detail their interaction and transcriptional landscape in prostate cancer cells.
Results
The AR interactome landscape in ERG-fusion
–positive prostate
cancer cells
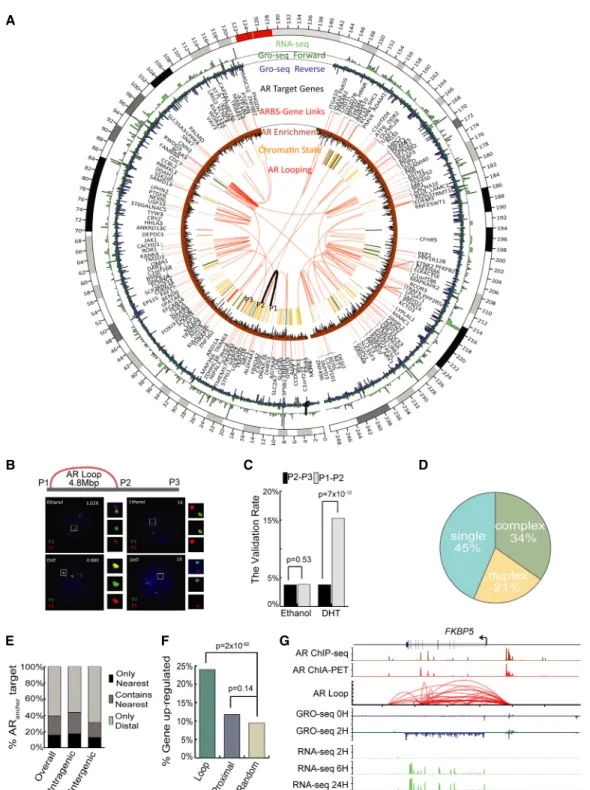
Using ChIA-PET, we constructed a genome-wide map of long-range chromatin interactions associated with AR in VCaP cells 2 h after androgen stimulation (Fig. 1A). Nonchimeric and uniquely mapped PET reads were utilized to define AR-associated chromatin loops (Supplemental Tables S1–S3). Genomic structural rearrange-ments in VCaP cells that were identified from our in-house-gener-ated genome-wide pair-end DNA sequencing (G-PET) and publicly available paired-end DNA sequencing with chromatin immuno-precipitation (ChIP-PET) data (Yu et al. 2010) were excluded as looping artifacts (Supplemental Table S4). The AR binding sites (ARBSs) derived from the ChIA-PET data in this study are largely in concordance with our previously generated chromatin immu-noprecipitation sequencing (ChIP-seq) of AR (Chng et al. 2012), indicating consistencies between immunoprecipitation tech-niques (Supplemental Fig. S1). To establish the validity of the ChIA-PET-defined chromatin interactions, we performed DNA-fluorescence in situ hybridization (DNA-FISH) and were able to confirm seven out of eight AR-associated chromatin interactions that we identified from our data set (Fisher’s exact test P < 0.05) (Fig. 1B,C;Supplemental Figs. S2–S8). Altogether, we identified 62,286 high-quality ARBSs and 70,133 AR-associated chromatin interactions.
We began by determining some of the basic properties of the ARBS in long-range chromatin interactions. Overall, we found 55% of the ARBSs serve as anchors for AR-associated chromatin interactions (ARanchor): 34% in complex interactions and 21% in
duplex interactions (Fig. 1D). This observation is similar to CTCF- (Handoko et al. 2011), POLR2A- (Li et al. 2012), and ESR1- (Fullwood et al. 2009) mediated chromatin interactions. The remaining ARBSs (45%) not participating in any chromatin in-teractions were placed in a single category (ARalone). Furthermore,
we observed that most ARanchor(∼60%) do not interact with their
nearest genes (Fig. 1E).
Next, we investigated the relationship between AR-associated chromatin interactions and the androgen-induced transcriptome.
For this, we performed GRO-seq (0 and 2 h post-DHT stimulation) and RNA-seq (0, 6, and 24 h post-DHT stimulation) on VCaP cells to assess both the direct transcriptional response and the steady-state RNA levels of androgen-regulated genes, respectively (Fig. 1A;Supplemental Fig. S9). Globally, we found there were approx-imately twofold more androgen up-regulated genes associating with ARanchor(Loop) as compared with ARaloneproximal to the
TSS (Proximal) (green vs. blue, Fig. 1F). This result is consistent with the hypothesis that AR can up-regulate transcription through long-range chromatin interaction. Furthermore, these observa-tions highlight the limitaobserva-tions of identifying AR target genes based on the proximity to ARBSs and underscore the need of an AR inter-actome map for this purpose.
FKBP5, a well-known AR target gene, is an early androgen-re-sponsive gene whose expression is maintained throughout long exposure to androgen stimulation. ARBSs located at both distal up-stream sites and in the intronic region of FKBP5 have been impli-cated in regulation of the gene (Fig. 1G; Magee et al. 2006; Makkonen et al. 2009; Chng et al. 2012; Tan et al. 2012; Sahu et al. 2014) but with unclear roles. From our AR interactome map, we now provide evidence to show that FKBP5 is transcrip-tionally up-regulated through AR-associated chromatin inter-actions spanning the promoter and several enhancers. These findings show that chromatin interaction data are critical for elu-cidating the long-range gene regulatory mechanisms.
ERG is involved in AR-associated chromatin interactions
Co-TFs work together with nuclear hormone receptors to coordi-nate different steps in the transcription process, including long-range chromatin interaction (Fullwood et al. 2009; Zhang et al. 2011; Chng et al. 2012). ERG is a well-known co-TF of AR in prostate cancer; however, it is unclear if ERG functions together with AR in modulating long-range chromatin interactions. To address this, we searched for TF DNA motif sequences that are differentially en-riched between ARanchorand ARalone. As shown in Figure 2A, the
motif sequence for ERG is highly enriched in ARanchorcompared
to ARalone. In contrast, other important transcription factors like
FOXA1 and HOXA1 were not differentially enriched between these two types of ARBS (Supplemental Fig. S10). When we overlapped the ARBSs identified from the AR interactome with our previously defined set of ERG binding sites (ERGBSs) (Chng et al. 2012), there was a significant enrichment (Binomial test; P-value <2 × 10⁻¹⁶) of ERGBS co-occurring with ARanchorin comparison to ARalone(Fig.
2B). Moreover, a large proportion (64%) of AR loop anchors were found to be occupied by ERG with binding intensity correlating to that of AR (Fig. 2C;Supplemental Fig. S11). These findings dem-onstrate the preferential recruitment of ERG to ARanchor over
ARaloneand the potential involvement of ERG in AR-associated
chromatin interaction events.
Due to the above observations, we generated a ChIA-PET interactome map for ERG and dissected the crosstalk between ERG and AR in long-range chromatin interactions (Supplemental Tables S5, S6). Notably, the fraction of ARBSs (57%) co-occurring with ERGBSs that are involved in long-range chromatin interac-tions (ERGanchor) was significantly higher than ARBS at ERGBSs
that do not participate in long-range interaction (ERGalone)
(38%; Binomial test; P-value <2 × 10⁻¹⁶) (Fig. 2D). With respect to androgen-mediated transcription, we observed ERG-associated chromatin loops intertwining with AR-associated chromatin loops around androgen-regulated genes and gene clusters including but not limited to FKBP5, VCL, the KLK gene family, and the
EAF2-E
F
B
A
C
D
G
Figure 1. The genome-wide AR interactome in prostate cancer cells. (A) Circos (Krzywinski et al. 2009) view of the AR interactome landscape in Chromosome 1. From innermost to outermost: (1) AR ultra-long-range looping (>1 Mbp), FISH-validated loops are highlighted in black, and the locations of the three FISH probes P1, P2, and P3 are annotated; (2) chromatin state track; (3) AR-Gene Linking; (4) AR target genes; (5) GRO-seq signal 2 h after DHT; (6) RNA-seq signal 6 h after DHT. (B) FISH analysis for the intra-Chromosome 1 interaction (16934619–21771843). (C) Summary of the validation rate of FISH experiments from examining 180 cells. (D) Breakdown of AR binding sites (ARBS) according to their associated type of chromatin interaction model classification from our previous study (Fullwood et al. 2009). (E) The fraction of ARanchorin either intra-genic regions or inter-genic regions whose targets
genes were defined by ChIA-PET interaction matching the nearest gene. (Only Nearest) The nearest gene is the only target gene, (Contain Nearest) the nearest gene is one of the target genes, (Only Distal) the nearest gene is not one of the target genes. (F ) Bar plot (Wickham 2009) showing the fraction of genes from different categories that are up-regulated after DHT. The genes with AR looping in their TSS show more up-regulation events than genes with only ARalonein proximal 5 kbp to TSS and random genes. (G) Snapshot representation (from top to bottom) of the AR binding peak profile (defined by
ChIP-seq), AR self-ligation peak profile (defined by ChIA-PET), AR-associated chromatin interaction profile (defined by ChIA-PET), transcriptional rate profiles (defined by GRO-seq), and steady-state mRNA level profiles (defined by RNA-seq) associated with the androgen-regulated gene, FKBP5.
SLC15A2-ILDR1 gene cluster (Fig. 2E). Taken together, these obser-vations suggest AR and ERG can function together through com-plex chromatin looping to regulate gene transcription.
Distinct genomic signatures demarcating AR- and ERG-associated
chromatin looping anchors
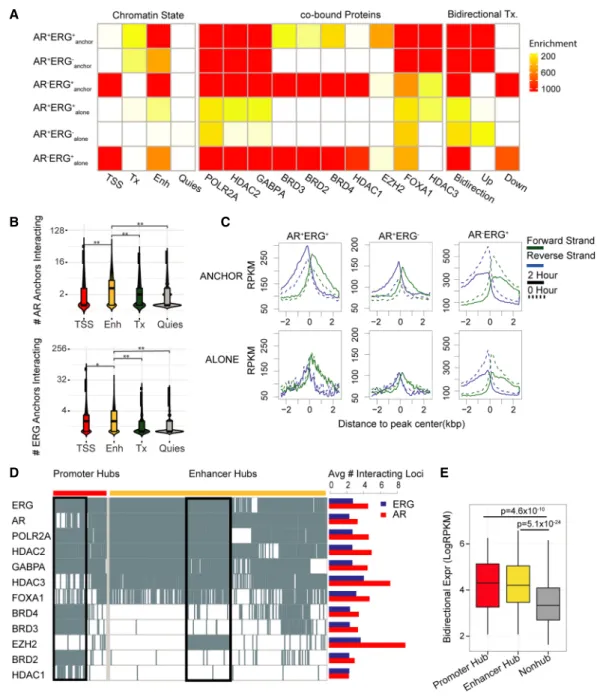
To better understand how AR and ERG function together in long-range chromatin interactions to regulate gene transcription, we first examined the genomic features of ARBSs and ERGBSs by classifying them into six specific categories based on their co-occu-pancy status and association with chromatin interactions. We uti-lized ChromHMM (Ernst and Kellis 2012) with six distinct histone marks (H3K36me3, H3K4me1, H3K27ac, H3K4me3, H3K27me3, H3K9me3) to define the various chromatin states (Quiescent, non-transcribed regions with very little epigenetic signal [Quies], Transcribed region [Tx], Active Promoter [TSS], and Active Enhancer [Enh]) associated with the different ARBS and ERGBS categories. From this analysis (Fig. 3A, left panel), we found AR preferentially cobinds with ERG at active enhancers with
long-range chromatin interactions (AR+ERG+
anchor). Active enhancers
containing AR or ERG showed the highest number of long-range chromatin interactions compared to other chromatin states (Fig. 3B). These observations demonstrate the role of AR and ERG at en-hancers in coordinating the activity of multiple regulatory regions in gene transcription.
Apart from ERG, a plethora of other transcriptional coregula-tors, including histone deacetylases (HDACs), bromodomain-con-taining proteins (BRDs), EZH2, and GABPA, function with AR to mediate gene transcription in prostate cancer cells (Chng et al. 2012; Asangani et al. 2014; Sharma et al. 2014). Accordingly, we ex-amined the potential involvement of these transcriptional coregu-lators in the AR-ERG co-associated chromatin interaction network (Supplemental Table S7). As shown in Figure 3A (middle panel), we identified three distinct groups of coregulators associated with dif-ferent categories of the AR-ERG transcriptional network. The first group (FOXA1, EZH2, and HDAC3) is enriched at AR+ERG+
anchor
sites, the second group (HDAC1, BRD2, BRD3, and BRD4) binds with ERG in the absence of AR (AR−ERG+anchorand AR−ERG+alone
sites), and the third group (POLR2A, HDAC2, and GAPBPA) is
E
B
A
C
D
Figure 2. ERG binding is involved in AR-associated chromatin looping. (A) Bar chart showing the top 10 motifs enriched at interacting ARBS (ARanchor)
compared to noninteracting ARBS (ARalone). There is no difference in AR motif enrichment between the two sets. (B) Fraction of ARanchorwith colocalized
ERGBS compared to ARalone. (C ) Left: Heat map depiction of the AR and ERG ChIP intensity (±5 kbp) centered at AR anchor pairs. Each row is one AR loop
represented by two anchor regions, and AR loops are classified into seven categories based on the occupancy status of AR and ERG at both anchors. Right: Pie-chart summarizing the fraction of different categories. (D) Fraction of interacting ERGBS (ERGanchor) with colocalized ARBS compared to noninteracting
enriched in categories with AR chromatin looping (but not AR+ERG+aloneand AR+ERG−alone), which may indicate AR needs
chromatin looping to recruit other proteins like POLR2A (
Supple-mental Table S8). Notably, FOXA1 binding is enriched at both AR+ERG+anchor and AR+ERG−anchor. This observation could be
attributed to the indirect binding of FOXA1 to chromatin, since
E
B
A
C
D
Figure 3. Regulatory signatures of the AR and ERG interactome in prostate cancer. (A) Dissecting AR/ERG binding sites into six categories based on AR/ ERG binding status and whether the binding sites associate with either AR loops or ERG loops. The left heat map presents enrichment of different chromatin states in the six categories of AR/ERG binding. The middle heat map presents enrichment of cotranscription factor ChIP-seq peak regions in VCaP cells. The three columns of the right heat map present enrichment of regions with bidirectional transcription 2 h after DHT treatment, with increasing bidirectional transcription in the middle column and decreasing bidirectional transcription on the right. The enrichment was computed as the negative log binomial P-value of the overlapping fraction of peaks in a given category (row) with the given annotation feature (column). The ENCODE combined DNase peaks (open chromatin) overlapping fractions are used as the null distribution. (B) Distribution of the number of interacting anchors comprising four different chromatin states in the AR anchored network (top) and ERG network (bottom). The Wilcoxon rank-sum test was applied to test if the number of anchors in the enhancer state is higher than other chromatin states. (∗) P-value = 1.6 × 10⁻⁷, (∗∗) P-value < 2.2 × 10⁻¹⁶. (C ) GRO-seq profile around six categories of AR/ERG binding sites. The forward strand GRO-seq signal is presented in green and the reverse strand in blue. The dashed line represents the GRO-seq signal before DHT treatment, and the solid line represents the GRO-seq signal 2 h after DHT treatment. (D) Left: Binary heat map representation of the distribution of listed transcription factor binding sites in promoter and enhancer hub regions. Each column represents one genomic region, with rows representing TF binding sites. The black boxes illustrate two TF clusters in promoter hub regions and enhancer hub regions. Right: Bar plot shows the average number of interacting loci for the AR (red) or ERG (blue) anchor regions with different TF binding. (E) Box plot showing the average bidirectional expression level (2 h after DHT treatment) of promoter hub regions (red), enhancer hub regions (yellow), and nonhub anchor regions (gray). The bidirectional expression level is defined by the minimum reads per kilobase per million mapped reads (RPKM) of two strands.
the FOXA1 motif shows similar enrichment in AR alone binding sites (Supplemental Fig. S10).
In addition to the chromatin state and transcriptional coregu-lator occupancy, bidirectional transcription (e.g., eRNA) has also been suggested to be associated with active enhancers (Core et al. 2014) and is a distinguishing marker for AR-associated chro-matin interactions (Wang et al. 2011); however, evidence thus far has been limited to only a few AR loci. To extend this finding, we integrated GRO-seq information with AR chromatin interaction data. In general, a clear androgen-inducible bidirectional transcrip-tion signature can be seen at ARBSs with long-range interactranscrip-tions after DHT treatment (AR+ERG+anchorand AR+ERG−anchor, top
pan-el, Fig. 3C), but not at ARBSs without long-range interactions (AR+ERG+
aloneand AR+ERG−alone, bottom panel, Fig. 3C). In
con-trast, AR−ERG+sites exhibited a decrease in GRO-seq signal upon
androgen stimulation regardless of chromatin interactions (third column, Fig. 3C), for which we hypothesize that an increase in ERG binding with transcriptional corepressors (e.g., HDAC1) at promoters might be one of the mechanisms that result in gene re-pression upon androgen stimulation (Chng et al. 2012). Taken to-gether, our results show that AR and ERG cobinding sites involved in long-range chromatin interactions (AR+ERG+
anchor) are
associat-ed with functional enhancer signatures (e.g., enhancer state, co-TF binding, bidirectional Tx) compared to those binding sites that do not participate in long-range chromatin interactions.
We next sought to check if the number of chromatin interac-tions would also affect functional enhancer signatures. For this, we defined the top 1% of AR and/or ERG anchors with the highest number of distinct chromatin interactions as interaction hub re-gions. These interaction hub regions were further classified as pro-moter or enhancer hubs based on their associated chromatin states. From this analysis, we found that, in addition to AR and ERG, other co-TFs, including POLR2A, HDAC2, and GABPA, are highly prevalent at both promoter and enhancer hubs (Fig. 3D; Supplemental Fig. S12). Coregulators BRD2/3/4 are enriched at promoter hubs while HDAC3 and EZH2 are preferred at enhancer hubs (Supplemental Fig. S13) and have a higher number of AR in-teractions than ERG inin-teractions (Fig. 3D, right panel). We found EZH2, a subunit of the Polycomb repressive complex 2 (PRC2), spe-cifically targeting enhancer hubs driven by AR and ERG binding (Supplemental Fig. S14), suggesting that PRC2 regulates those in-teraction hub regions, which is consistent with the previous model that ERG recruits PRC2 to inhibit AR activity (Yu et al. 2010). In addition, we found the expression of bidirectional transcripts was higher at interaction hubs of the AR-ERG interaction network versus non-hubs (Fig. 3E), suggesting a positive correlation be-tween bidirectional expression and the degree of chromatin inter-actions. In summary, our findings show the interaction hubs of the AR-ERG interaction network are associated with functional sig-natures, including enhancer state, co-TF binding, and bidirec-tional transcripts.
AR and ERG chromatin loops shape the transcriptional
regulatory circuit in prostate cancer
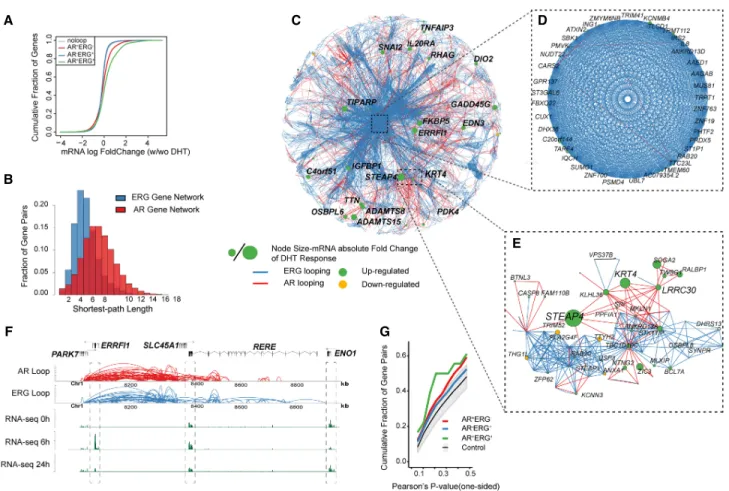
To understand how the AR and ERG interactomes are integrated as components of the AR transcriptional network, we associated androgen-regulated genes with long-range chromatin interac-tions. In general, we found the anchor regions of AR-ERG loops (AR+ERG+loop) and to a lesser extent AR-only loops (AR+ERG− loop) are enriched for androgen up-regulated genes (Fig. 4A; Supplemental Fig. S15). Moreover, AR+ERG+loops tend to be
asso-ciated with genes up-regulated at early time points (6 h vs. 0 h) af-ter androgen stimulation, as well as late (24 h vs. 6 h) down-regulated genes (Supplemental Fig. S15A,B). On the other hand, AR+ERG+alone sites preferentially associate with down-regulated
genes at both early and late time points (Supplemental Fig. S15A, B). Although these observations suggest that AR+ERG+loops
asso-ciate with the cumulative transcription level of their target genes, we could not find significant evidence for those loops in associa-tion with the change in pause-index at the target genes ( Supple-mental Fig. S16). This may indicate AR’s role in transcription initiation over a role in transcription elongation.
Network architecture has been demonstrated to affect the robustness of a regulatory network (Zamal and Ruths 2012; Winterbach et al. 2013), leading to our interest in the topology of the gene network mediated by AR and ERG. We therefore structed a representation of the AR and ERG gene networks by con-necting pairs of genes if their promoters are linked through AR or ERG long-range interactions (AR+ERG−and AR−ERG+). Our results
show that the ERG-mediated gene network is dense and highly connected (average path length is 4) (Fig. 4B,C) in contrast to the AR-mediated gene network (average path length is 7) (Fig. 4B,C). This observation could be reflective of a stable ERG gene transcrip-tional regulatory network (Fig. 4D) that might be more resistant to androgen stimulus (requiring a significantly higher androgen sig-nal to perturb the network) as compared to a more dynamic AR-me-diated gene transcriptional regulatory network (Fig. 4E), which is easily amendable to stimulus. In addition, we found that andro-gen-responsive genes (green nodes in Fig. 4C–E) were preferentially located in the AR-mediated gene network (e.g., STEAP4 and KRT4) (Fig. 4E). Taken together, these observations suggest ERG may play a role in isolating a set of genes from the androgen effect.
However, when we examined the AR+ERG+coregulated gene network, which consists of 169 gene pairs (Supplemental Table S9) that are linked via AR+ERG+loops, we found it has a higher positive
gene expression correlation compared to AR+ERG− or AR−ERG+
loops (Fig. 4G). For instance, ERRFI1 and RERE, two genes which are 300 kb apart, are linked extensively via AR+ERG+loops and their expression is highly coordinated across different time points after androgen induction, with the highest expression at 6 h (Fig. 4F). In contrast, ENO1, a nearby gene, which is not connected by AR+ERG+loops, shows a different expression pattern. Collectively, our results support a combinatorial association whereby AR and ERG chromatin loops govern androgen-regulated transcriptional output more than AR alone. Genes that are regulated only by ERG appear to be insensitive to androgen stimulation or potential-ly require a larger stimulus to respond.
Crosstalk between the AR-ERG interactome and long noncoding
RNAs in prostate cancers
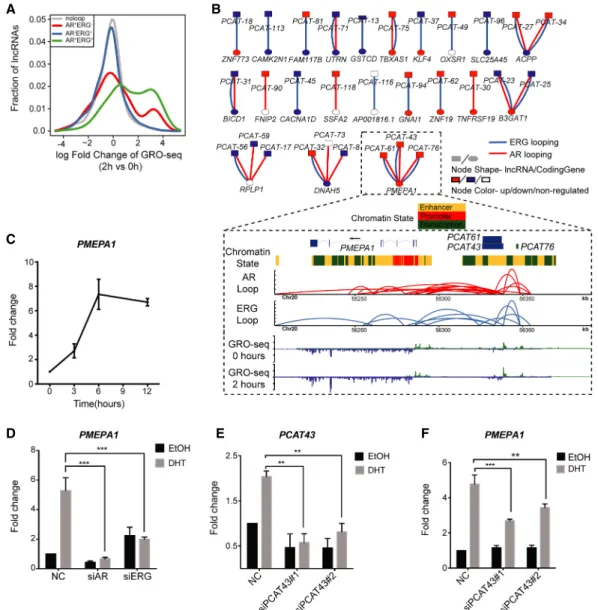
The importance of lncRNAs in prostate cancer progression has been highlighted recently (Prensner et al. 2011, 2013; Chen et al. 2018; Lingadahalli et al. 2018). Since AR and ERG are also crit-ical transcriptional regulators in prostate cancer (Chen and Saw-yers 2010; Yu et al. 2010; Chng et al. 2012; Chng and Cheung 2013), we postulated their potential involvement in regulating lncRNAs. Indeed, analysis of the GRO-seq and ChIA-PET data sets shows that AR-ERG co-associated chromatin loops are highly correlated with androgen up-regulated lncRNA transcripts, partic-ularly those that are up-regulated at the early time points after DHT stimulation (Fig. 5A). Next, we examined the clinical relevance of our finding by comparing with lncRNAs that are differentially
expressed between normal and cancer prostate tissue samples (Prensner et al. 2011). We found more than half of these lncRNAs have overlap with AR and/or ERG looping, with 36% overlapping with both types of looping (Supplemental Fig. S17). The connec-tion between lncRNAs at the DNA level and coding genes suggests the possibility of a regulatory interaction due to spatial proximity (Fig. 5B;Supplemental Table S10). From these observations, we hy-pothesized that chromatin looping might be one of the mecha-nisms for facilitating crosstalk between lncRNAs (or transcription from enhancers) and their target coding genes. To explore this hy-pothesis further, we examined the PMEPA1 locus, which harbors three clinically relevant lncRNAs (PCAT43, PCAT61, and PCAT76) (Prensner et al. 2011) that are all linked to the PMEPA1 (prostate transmembrane protein, androgen induced 1) gene by AR+ERG+loops (Fig. 5B). We first established that PMEPA1 is
acti-vated by androgen in a time-dependent manner and regulated by AR and ERG (Fig. 5C,D). Next, we examined the effect of lncRNA depletion on PMEPA1 gene expression. We had difficulties
knock-ing down PCAT76 (Supplemental Fig. S18), and thus we were not able to determine the effect of PCAT76 on PMEPA1 gene transcrip-tion. However, depleting PCAT43/PCAT61 significantly reduced the androgen-mediated activation of PMEPA1 (Fig. 5E,F), suggest-ing that these lncRNAs are important for regulatsuggest-ing PMEPA1 gene expression. In summary, our results reveal a complex cross-talk between lncRNAs and AR-ERG chromatin loops in transcrip-tional regulation in prostate cancer.
Association of GWAS noncoding SNPs from prostate cancer
patients with AR-ERG chromatin interactions
Genome-wide association studies (GWASs) have identified over 100 potential risk loci for prostate cancer, with most located in non-coding regions of the genome (Berndt et al. 2015; Hoffmann et al. 2015; Kim et al. 2015; Wang et al. 2015). Given the importance of AR and ERG in prostate cancer etiology (Chen and Sawyers 2010; Chng et al. 2012), we hypothesized that some of these
E
F
B
A
C
D
G
Figure 4. Transcriptome network defined AR and ERG interactome in prostate cancer. (A) Distribution of mRNA expression changes at 0 and 2 h after DHT treatment. mRNA changes are classified into four categories depending on the association with different types of loops. The x-axis shows the log fold change of the gene expression by RNA-seq data, and the y-axis is the cumulative fraction of genes in the given gene categories. (B) The distribution of shortest path lengths between any two genes in the AR or ERG loop defined gene networks. (C ) Cytoscape (Shannon et al. 2003) map of the largest con-nected component of the gene network defined by both AR and ERG associated loops. Each node is a gene, and the node size represents the absolute log fold change of the mRNA expression at 0 and 2 h after DHT treatment. The edge color represents either AR looping (red) or ERG looping (blue). (D) A zoomed view of a core gene network showing 39 genes highly inter-connected by ERG loops and a few AR loops. (E) Zoomed in subnetwork view of the neighborhood of genes with STEAP4. (F ) A browser track view of genes linked by AR-ERG co-associated looping. From top to bottom: the gene track, AR looping track, ERG looping track, RNA-seq signal at 0 h, RNA-seq signal at 6 h, and RNA-seq signal at 24 h after DHT treatment. (G) Cumulative fraction of gene pairs against the Pearson’s correlation value of their expression across four time points after DHT treatment (based on microarray data). The P-value is one-sided and the alternative hypothesis is that the correlation is greater than zero. The green curve is for gene pairs linked by AR-ERG co-associated looping, the red curve is for gene pairs linked by AR looping only, and the blue curve is for gene pairs linked by ERG loops only. The gray color band denotes the 95% confidence interval of the same number of randomly selected gene pairs as in the AR-ERG co-association.
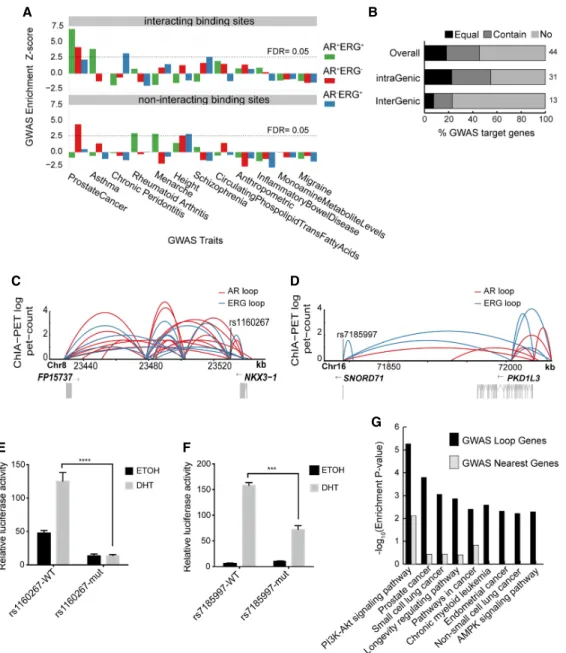
noncoding risk loci may function through AR and ERG co-associat-ed chromatin loops. In support of this, we found AR+ERG+anchor
sites significantly enriched in prostate cancer GWAS SNPs (permu-tation test, P-value = 6.8 × 10⁻¹⁴) (Fig. 6A;Supplemental Fig. S19). Moreover, performing the same analysis across 11 other GWAS studies showed that the enrichment of SNPs in AR+ERG+anchorsites
is specific to prostate cancer (Fig. 6A;Supplemental Fig. S19). These observations suggest that GWAS noncoding variants may contrib-ute to the risk of prostate cancer by altering AR-ERG cobinding and subsequent chromatin interactions.
Using this novel set of chromatin interaction information, we next linked prostate cancer GWAS SNPs to target genes through AR/
ERG chromatin loops (Supplemental Table S11). Notably, only 22% of target genes that are defined by AR/ERG chromatin loops are nearest genes associated with the GWAS SNPs (Fig. 6B), imply-ing that, for most risk loci, findimply-ing target genes requires chromatin looping information. Next, we examined whether GWAS SNPs in AR/ERG binding sites are functionally active. For this, we identi-fied three significant prostate cancer GWAS SNPs (rs1035545, rs7185997, and rs1160267) (Al Olama et al. 2014) that are located within AR+ERG+
anchorsites. We then cloned a 500- to 1000-bp
re-gion encompassing the SNPs upstream of a luciferase reporter. Two (rs1160267 and rs7185997) out of the three SNP-containing regions have significant AR/ERG binding activity (Supplemental
E
F
B
A
C
D
Figure 5. Functional relationship between lncRNA and chromatin loops in the AR-ERG transcriptional network. (A) Distribution of lncRNA expression change from 0 to 2 h after DHT treatment as measured by GRO-seq. Genes were classified into four categories depending on their association with different loop types. The x-axis shows the log fold change of the lncRNA expression, and the y-axis is the fraction of genes in the given lncRNA categories. (B) Bipartite graph linking clinically relevant lncRNAs to coding genes by AR/ERG looping. The node shape indicates the molecule type (lncRNA or coding gene), and the node color represents a more than 1.5-fold expression increase (red) or decrease (blue) after DHT treatment. Lower panel: An example showing three clin-ically relevant lncRNAs linked to the gene PMEPA1 by AR-ERG co-associated looping. Snapshot representation of (from top to bottom) gene track and ChromHMM track, the ERG and AR loops (defined by ChIA-PET), and transcriptional rate profiles before and after DHT (defined by GRO-seq). (C ) Graph showing the time-dependent activation of PMEAP1 in VCaP cells after treatment with 10 nM DHT. (D) Bar graph showing the expression of PMEAP1 in VCaP cells transfected with siNC, siAR, or siERG and treated with DHT or EtOH for 6 h. (E) Transcribed from the same genomic region, PCAT43 and PCAT76 transcripts are indistinguishable from each other. Bar graph showing the efficiency of siRNA-mediated knockdown of PCAT43 in VCaP cells. (F ) Graph show-ing the effect of PCAT43 knockdown on the androgen regulation of PMEAP1. VCaP cells transfected with siPCAT43 were treated with DHT or EtOH for 6 h.
Fig. S20). GWAS SNP rs1160267 is in an enhancer region linked to the NKX3-1 gene through AR-ERG looping (Fig. 6C), whereas rs7185997 is located within the AP1G1 gene and is connected to the PKD1L3 gene also through AR-ERG looping (Fig. 6D). Sanger se-quencing of these regions confirmed that VCaP cells contain both of these SNPs. Site-directed mutagenesis of both SNPs disrupted AR/ERG binding activity (Fig. 6E,F), indicating that these variants likely affect AR-ERG co-activation of NKX3-1 and PKD1L3. Taken together, our results indicate that prostate GWAS SNPs may disrupt distal target genes through AR/ERG-mediated chromatin looping.
Finally, we performed pathway enrichment analysis (Kule-shov et al. 2016) on GWAS-associated target genes in prostate can-cer that are either defined by spatial proximity (AR-ERG chromatin loop) or by linear proximity (nearest genes). Compared to linear proximity, GWAS target genes that are defined by our ChIA-PET interactions (Supplemental Table S12) are much more enriched in many pathways, including the PI3K-AKT signaling pathway (Fig. 6G), which previously has been implicated in prostate cancer from various preclinical studies (Majumder and Sellers 2005; Edlind and Hsieh 2014; Lee et al. 2015). Taken together, our results
E
F
B
A
C
D
G
Figure 6. Noncoding GWAS SNPs contribute to the risk of prostate cancer through AR/ERG chromatin interaction. (A) Graph showing the enrichment of different classes of AR/ERG binding sites in diverse GWAS traits. Upper panel: Examined regions with AR/ERG chromatin looping including AR-ERG cobind-ing sites (green), AR only bindcobind-ing sites (red), and ERG only bindcobind-ing sites (blue) with overlappcobind-ing GWAS top loci. Lower panel: Similar to the upper panel but considered only regions without AR/ERG chromatin looping. (B) The fraction of prostate cancer GWAS loci in either intra-genic regions or inter-genic re-gions whose targets genes (defined by AR/ERG looping) match the nearest gene: The nearest gene is the only target gene (Equal), the nearest gene is one of the target genes (Contain), and the nearest gene is not a target gene (No). (C ) Prostate cancer associated GWAS SNP rs1160267 linked to the NKX3-1 gene through AR/ERG chromatin looping. (D) Prostate cancer associated GWAS SNP rs7185997 linked to PDK1L3 gene through AR/ERG chromatin looping. (E) Luciferase assay activity before and after mutating the GWAS SNP rs1160267, which is located in the enhancer region of the NKX3-1 gene. (F ) Luciferase assay activity before and after mutating GWAS SNP rs7185997, which is located in the enhancer region of PDK1L3 gene. (G) A list of the top 10 pathways enriched in prostate GWAS target genes defined by either using our chromatin looping data or the nearest gene method.
demonstrate the power of integrating GWAS and long-range chro-matin interaction information for revealing the convergence of signals that lead to pathways involved in prostate cancer. More-over, our AR and ERG interactome data is an important resource for researchers who are interested in identifying target genes for prostate cancer associated noncoding mutations and exploring the molecular mechanisms of those mutations.
Discussion
The characterization of a transcription factor’s activity would be incomplete without any information on its higher-order chromo-somal organization (Schoenfelder et al. 2010; Göndör and Ohlsson 2009; Schneider and Grosschedl 2007). Thus, to build the most comprehensive regulatory network to date in prostate cancer, we generated a large scale molecular experimental data set that includ-ed 3D chromatin interaction data (AR and ERG ChIA-PET), multi-ple time point transcriptome data (GRO-seq, RNA-seq), and DNA sequencing data (G-PET for structural variations). Overall, we have mapped and characterized in detail the general features of the AR interactome and implicated the ERG interactome as a coop-erative part of the AR transcriptional network in prostate cancer cells. To visualize the long-range chromatin interactions and asso-ciated genomic data from this study, we have created a genome browser, which is available at the following link: http://biogpu. ddns.comp.nus.edu.sg/basic2/basic/public/zzz/hg19/.
In this work, we observed distinct functional signatures for the different classes of binding sites defined by AR and ERG, with or without chromatin interactions. From our AR and ERG long-range interaction network, we identified cis-regulatory ele-ments that displayed high interconnectivity, serving as network hubs. In particular, we found interaction hub regions colocalized with the binding of other transcription factors (e.g., HDAC3 and EZH2), bidirectional transcripts (e.g., eRNA), and prostate cancer-associated lncRNAs. Herein, we provide the first evidence to show that this topological connectivity in the AR and ERG interac-tion network might be an indicator of funcinterac-tional importance.
From our findings, we observed that highly interconnected interaction hub regions drive gene/eRNA/lncRNA expression in prostate cancer after androgen treatment. Moreover, these hub re-gions are occupied by histone remodeling factors and lncRNAs. Therefore, we think the interaction hubs might serve as potential targets for genetic editing methods such as CRISPR-Cas9 or cell therapies for prostate cancer patients, as they appear to alter the androgen transcriptional response in cancer cells. The importance of these promoter/enhancer hubs can be further validated with interactome data for other transcription factors, including ESR1 (Fullwood et al. 2009), POLR2A (Li et al. 2012; Zhang et al. 2013), Cohesin (DeMare et al. 2013), and CTCF (Handoko et al. 2011). Future work could examine whether the relationship among interaction hubs, lncRNAs, and histone remodeling factors can be extended to other interaction networks.
In a recent study, Rosenfeld and colleagues showed PCGEM1, an androgen-regulated lncRNA, is important in establishing AR-as-sociated chromatin loops in LNCaP cells (Yang et al. 2013; Parolia et al. 2015). Because of this, we attempted to examine the extent to which PCGEM1 functions in regulating the genome structure of VCaP cells. We did this by overlapping our AR and ERG interac-tomes with PCGEM1 binding sites previously defined by chroma-tin isolation by RNA purification (ChIRP-seq) (Yang et al. 2013). In general, we found a strong colocalization between PCGEM1 and ARanchorin comparison to ARalone(Fisher’s exact test; P-value <2 ×
10−16) (Supplemental Fig. S21) but not with ERG loops. However, upon experimental validation, we found that PCGEM1 expression in VCaP cells is extremely low compared to LNCaP cells and is not regulated by AR or ERG (Supplemental Fig. S22A,B). Additionally, siRNA-mediated knockdown of PCGEM1 was unsuccessful ( Sup-plemental Fig. S22C). Hence, at this stage, we speculate that a dif-ferent lncRNA other than PCGEM1 may be facilitating AR and ERG looping in VCaP cells.
From this study, we also discovered that the connectivity of the AR-mediated gene network and the ERG-mediated gene net-work are very different, although there are common genes between the two networks. Specifically, we found that the AR-mediated network is sparser than the ERG-mediated network and andro-gen-responsive genes are depleted in the dense core of the ERG-me-diated gene network. However, genes that are linked by AR and ERG co-associated chromatin loops demonstrated a strong transcrip-tional expression correlation in response to androgen, indicating a possible cotranscription of interconnected genes.
Finally, our work demonstrated the clinical usefulness of the AR and ERG chromatin looping information in associating differ-entially expressed lncRNAs in patient tumors and in prostate can-cer GWAS SNPs with coding genes in close spatial proximity. For example, the prostate cancer GWAS SNP rs9364554 (Hoffmann et al. 2015) (GWAS P-value = 6 × 10⁻¹²) is located in the intron of the SLC22A3 gene within an AR+ERG+loop anchor (Supplemental Fig. S23). From our data, it appears that rs9364554 is also connect-ed through AR-ERG looping to the SLC22A2 gene, which is 130 kb away. Thus, our data suggest that not one but two genes are poten-tial targets of this GWAS SNP. In support of our observation, rs9364554 has been reported as an eQTL for both of these genes (Thibodeau et al. 2015).
Our analysis of GWAS-significant SNPs also revealed that an enrichment of AR-ERG cobinding sites is involved in chromatin interactions in prostate cancers and that target genes linked by AR and ERG chromatin loops are more highly enriched in prostate cancer pathways as compared to a simple nearest gene approach. Moreover, our analysis of the interactions between lncRNAs and protein coding genes at the DNA level suggests a potential method for predicting the target genes of lncRNAs through chromatin in-teractions. Taken together, our work has resulted in a novel way for understanding the possible biological functions of prostate cancer lncRNAs or GWAS SNPs through the coding genes.
In summary, our work has significantly enhanced our mech-anistic insight of hormone-regulated gene transcription in prostate cancer and at the same time provided many novel data sets includ-ing the chromatin interactomes of AR and ERG which we believe are highly valuable to the research community. In addition, our work provides a new analytic framework for understanding long-range interactions of multiple transcription factors and a method-ology that can be applied broadly, beyond cancer research.
Methods
Cell culture
VCaP prostate cancer cells (American Type Culture Collection) were cultivated in DMEM with 10% fetal bovine serum (FBS; Invitrogen) at 37°C under 5% CO2. To deprive the prostate cancer
cells of hormones prior to DHT (Tokyo Chemical Industry) stimu-lation, VCaP cells were first grown for 24 h in phenol red-free DMEM with 10% charcoal-dextran-treated fetal bovine serum (CDFBS; HyClone).
siRNA studies
A double knockdown approach was utilized for siRNA studies and was performed as described previously (Lingadahalli et al. 2018). In brief, VCaP cells were transfected consecutively with 5 and 10 nM of dsiRNA (IDT) with a gap of 24 h between each transfec-tion using Lipofectamine RNAi Max (Invitrogen) following the manufacturer’s protocol. After the second round of transfection, the media was changed to phenol red-free DMEM with 10% CDFBS and hormone deprived for another 24 h, followed by treat-ment with 10 nM of DHT or EtOH for 6 h. Two dsiRNAs were de-signed for each target and paired with a nontargeting control (siNC).
Construction of reporter plasmids and luciferase assay
A 600- to 700-bp region around the GWAS SNP was amplified from VCaP genomic DNA with homologous recombination primers such that the final amplified product contained KpnI and XhoI re-striction endonuclease sites. The amplified products were cloned into the pGL4-TATA vector (Lin et al. 2007) by homologous recom-bination using the Quick ligation kit (bimake.com) according to the manufacturer’s protocol.
VCaP cells were cotransfected with 250 ng of reporter construct and 2.5 ng of Renilla using Lipofectamine 3000 (Invitro-gen) according to the manufacturer’s protocol. After 24 h of trans-fection, the media was changed to phenol red-free DMEM with 10% CDFBS and hormone-deprived for another 24 h before treat-ing with 10 nM of DHT or EtOH for 24 h. Firefly and Renilla lucifer-ase activities were assayed using the Dual Luciferlucifer-ase System kit (Promega) and VICTOR3 (PerkinElmer) according to the manufac-turers’ protocols. The relative reporter gene activity was obtained by normalizing the Firefly luciferase activity with the Renilla lucif-erase activity.
Chromatin immunoprecipitation (ChIP) and ChIA-PET library
construction
Androgen-stimulated VCaP cells were first fixed with 2 mM DSG (Pierce, Thermo Fisher Scientific) for 45 min prior to a 10 min fixa-tion with 1% formaldehyde (Sigma-Aldrich). Harvested cells were lysed and the chromatin sonicated into a length of∼500 bp. The fragmented chromatin was first precleared with rabbit IgG (Santa Cruz Biotechnology [SCBT], sc-2027x) for roughly 4 h before over-night immunoprecipitation with the corresponding AR/ERG anti-bodies. Dynabeads Protein G (Life Technologies) was utilized for the pull-down. Captured DNA was eluted and de-crosslinked at 65°C for∼16 h. Anti-AR (SCBT, 815x) and anti-ERG (SCBT, sc-353) antibodies were used for AR and ERG ChIP, respectively. ChIA-PET library construction for sequencing was performed as previously described (Fullwood et al. 2009). Two libraries, CHV029 and CHV031, were generated for AR and ERG, respectively.
Genomic DNA extraction and long-span paired-end-tag
sequencing (G-PET)
High-quality genomic DNA was extracted from VCaP cells using the DNeasy kit (Qiagen) according to the manufacturer’s instruc-tions. A long-span paired-end-tag sequencing library was con-structed as previously described (Hillmer et al. 2011). One SOLiD paired-end read library, DHV001, was generated.
RNA extraction and RNA-sequencing
VCaP cells were harvested in TRI-reagent (Sigma-Aldrich). Total RNA was purified and obtained using the PureLink RNA Mini kit (Invitrogen). RNA sequencing libraries were prepared as described
previously (Xu et al. 2013). Three libraries were generated (RHV006, RHV007, RHV008) corresponding to 0, 6, and 24 h after DHT treatment.
Global run-on sequencing (GRO-seq)
Nuclei were isolated from VCaP cells with or without DHT treat-ment. GRO-seq libraries were prepared from 10 million cells based on our previously published protocol (Core et al. 2008). After har-vesting the cells, RNA polymerases were allowed to run-on for 5 min at 30°C (∼100 bp) in the presence of sarkosyl and BrUTP. The RNA was then base hydrolyzed, end-repaired, and immuno-purified with anti-BrdUTP-coated agarose beads thrice (SCBT, sc-32323ac). The affinity-enriched RNAs were then reverse tran-scribed, amplified, and PAGE purified for deep sequencing on the Illumina Genome Analyzer and HiSeq 2000. Two libraries, RHV001 and RHV002, were generated corresponding to 0 and 2 h after DHT treatment, respectively.
Fluorescence in-situ hybridization
FISH was performed as described previously (Fullwood et al. 2009) with some modification. Briefly, VCaP nuclei were harvested by treating cells with 0.075M KCl for 15 min at 37°C and fixed with a fixative (methanol: acetic acid at 3:1) and mounted onto slides. For the BAC probes, the DNA was extracted from BACs and labeled with biotin or digoxigenin (DIG) by nick translation (ITS Science). The probes were then coprecipitated with 1 µg/µL of Cot1 DNA and salmon sperm DNA and resuspended in hybridization buffer at 5 ng/µL. Prior to hybridization, VCaP nuclei slides were treated with pepsin and dehydrated with a series of ethanol treatment (70%, 80%, and 100%). After the probes were hybridized in a hu-mid chamber at 37°C overnight, the slides were treated with avi-din-conjugated fluorescein isothiocyanate (FITC) for biotinylated probes and anti-DIG-Rhodamine for DIG-labeled probes and visualized under a fluorescence microscope (Nikon Eclipse 80i) to obtain the figures in the paper. Detailed information on the ob-taining intra-chromosomal interactions and inter-chromosomal interactions are provided inSupplemental Methods.
G-PET data processing
The SOLiD paired-end reads generated from libraries (DHV001_1 and DHV001_2) were mapped to reference genome hg19 using the SOLiD mapper provided by Life Technologies. The structural variations (deletions, inversions, insertions, tandem, and translo-cations) were detected using the SVGenModule program (Hillmer et al. 2011). In addition, to detect the amplified regions in VCaP, we partition the genome into a series of 10-kbp bins, count the gPET read count in each bin, and compute the outlier bins (with P < 0.01) as amplified regions assuming the read count per bin fol-lows the normal distribution.
RNA-seq data processing
Illumina paired-end reads generated from RHV006, RHV007, and RHV008 were mapped to the reference genome hg19 using TopHat (Trapnell et al. 2012). To compute the gene expression for different time points, we used HOMER (Heinz et al. 2010) with the command“analyzeRNA.pl rna hg19 -strand both -count genes”. Differential expressed genes are defined as genes with a fourfold expression change between any two time points (three time points in total). The use of the reference genome hg19 versus GRCh38 for mapping is not likely to have significantly affected our conclusions (seeSupplemental Methods).
GRO-seq data processing
The raw read data were mapped to the reference genome hg19 using BatMis (Tennakoon et al. 2012), and the coverage profile along the genome was generated using HOMER (Heinz et al. 2010) and nor-malized by the sequencing depth of each library. The expression level and pausing index of each RefSeq gene were quantified by HOMER (Heinz et al. 2010) using the command“analyzeRNA.pl rna hg19 -pausing 500 -count genes”. To define pausing regulated genes, we chose genes with a gene body length longer than 1000 bp and with a pausing index change (increase or decrease) of more than twofold after DHT treatment. The de novo transcripts were called by combining two time points from the GRO-seq data and using the HOMER (Heinz et al. 2010)“find peak -groseq” com-mand. LincRNA transcripts were defined as de novo transcripts that do not overlap the coding genes in GENCODE V16.
ChIA-PET data processing
ChIA-PET sequence reads were processed as described previously (Li et al. 2012) with some modifications using the ChIA-PET Tool (Li et al. 2010). To avoid artifacts due to structure variations, we combined the SV calling result from our G-PET data and the pub-lished ChIP-PET data. We retained ChIA-PET interactions that do not overlap with those SVs and defined these as true long-range chromatin interactions that were used for follow-up analysis. The detailed work flow is described inSupplemental Methods.
Bioinformatics analysis
The parameters that were used in this study to define an interac-tion anchor, binding sites with or without looping, target genes of an interaction binding site, transcriptional models from AR or ERG peaks and chromatin looping, promoter and enhancer region, and hub and nonhub region can be found in Supplemental Methods. Additional computational and statistical procedures in-cluding GWAS pathway enrichment analysis, gene network analy-sis, and Pearson’s correlation coefficient analysis for co-expression can also be found inSupplemental Methods.
Data access
The ChIA-PET, GRO-seq, RNA-seq, G-PET, and Sanger sequencing data from this study have been submitted to the NCBI BioProject database (https://www.ncbi.nlm.nih.gov/bioproject) under acces-sion number PRJNA238129.
Acknowledgments
This work was supported in part by grants from the University of Macau (MYRG 2015-00196-FHS) and the Macau Science and Technology Development Fund (FDCT/023/2014/A1 and FDCT102/2015/A3) to E.C. K.R.C. was supported by an A∗STAR graduate scholarship. S.K.T. was supported by a NUS Graduate School for Integrative Sciences and Engineering Scholarship. G.L. was supported by the National Natural Science Foundation of China (Grant No. 91440114). Z.Z. was supported by the NIH/ NHGRI grants (5-U01-HG007610-03 and 1-RF1-AG054012-01) awarded to M.K. Work from the J.T.L. lab was supported by NIH-GM25232 and NIH-U01 HL129958.
Author contributions: Z.Z., K.R.C., W.-K.S., and E.C. conceived and designed the project. Z.Z., H.H.D., S.C., G.L., and C.L.H. con-ducted the bioinformatics analysis with guidance from M.K. and W.-K.S. K.R.C., Z.C., M.H.L., H.M.P., Y.Y.S., L.J.C., S.K.T., and S.L. performed the experiments under the supervision of J.T.L.,
Y.R., X.R., and E.C. Z.Z., K.R.C., S.L., W.-K.S., and E.C. drafted the manuscript with input from all authors.
References
Al Olama AA, Kote-Jarai Z, Berndt SI, Conti DV, Schumacher F, Han Y, Benlloch S, Hazelett DJ, Wang Z, Saunders E, et al. 2014. A meta-analysis of 87,040 individuals identifies 23 new susceptibility loci for prostate cancer. Nat Genet46: 1103–1109. doi:10.1038/ng.3094
Asangani IA, Dommeti VL, Wang X, Malik R, Cieslik M, Yang R, Escara-Wilke J, Wilder-Romans K, Dhanireddy S, Engelke, C, et al. 2014. Therapeutic targeting of BET bromodomain proteins in castration-resis-tant prostate cancer. Nature510: 278–282. doi:10.1038/nature13229 Berger MF, Lawrence MS, Demichelis F, Drier Y, Cibulskis K, Sivachenko AY,
Sboner A, Esgueva R, Pflueger D, Sougnez C, et al. 2011. The genomic complexity of primary human prostate cancer. Nature470: 214–220. doi:10.1038/nature09744
Berndt SI, Wang Z, Yeager M, Alavanja MC, Albanes D, Amundadottir L, Andriole G, Beane Freeman L, Campa D, Cancel-Tassin G, et al. 2015. Two susceptibility loci identified for prostate cancer aggressiveness. Nat Commun6: 6889. doi:10.1038/ncomms7889
Chen Y, Sawyers CL. 2010. Coordinate transcriptional regulation by ERG and androgen receptor in fusion-positive prostate cancers. Cancer Cell 17: 415–416. doi:10.1016/j.ccr.2010.04.022
Chen X, Yang C, Xie S, Cheung E. 2018. Long non-coding RNA GAS5 and ZFAS1 are prognostic markers involved in translation targeted by miR-940 in prostate cancer. Oncotarget 9: 1048–1062. doi:10.18632/ oncotarget.23254
Chng KR, Cheung E. 2013. Sequencing the transcriptional network of an-drogen receptor in prostate cancer. Cancer Lett340: 254–260. doi: 10.1016/j.canlet.2012.11.009
Chng KR, Chang CW, Tan SK, Yang C, Hong SZ, Sng NY, Cheung E. 2012. A transcriptional repressor co-regulatory network governing androgen re-sponse in prostate cancers. EMBO J31: 2810–2823. doi:10.1038/emboj. 2012.112
Clegg NJ, Wongvipat J, Joseph JD, Tran C, Ouk S, Dilhas A, Chen Y, Grillot K, Bischoff ED, Cai L, et al. 2012. ARN-509: a novel antiandrogen for prostate cancer treatment. Cancer Res72: 1494–1503. doi:10.1158/ 0008-5472.CAN-11-3948
Core LJ, Waterfall JJ, Lis JT. 2008. Nascent RNA sequencing reveals wide-spread pausing and divergent initiation at human promoters. Science 322: 1845–1848. doi:10.1126/science.1162228
Core LJ, Martins AL, Danko CG, Waters CT, Siepel A, Lis JT. 2014. Analysis of nascent RNA identifies a unified architecture of initiation regions at mammalian promoters and enhancers. Nat Genet 46: 1311–1320. doi:10.1038/ng.3142
DeMare LE, Leng J, Cotney J, Reilly SK, Yin J, Sarro R, Noonan JP. 2013. The genomic landscape of cohesin-associated chromatin interactions. Genome Res23: 1224–1234. doi:10.1101/gr.156570.113
Edlind MP, Hsieh AC. 2014. PI3K-AKT-mTOR signaling in prostate cancer progression and androgen deprivation therapy resistance. Asian J Androl16: 378–386. doi:10.4103/1008-682X.122876
Ernst J, Kellis M. 2012. ChromHMM: automating chromatin-state discovery and characterization. Nat Methods9: 215–216. doi:10.1038/nmeth. 1906 Fullwood MJ, Liu MH, Pan YF, Liu J, Xu H, Mohamed YB, Orlov YL, Velkov S, Ho A, Mei PH, et al. 2009. An oestrogen-receptor-α-bound human chro-matin interactome. Nature462: 58–64. doi:10.1038/nature08497 Göndör A, Ohlsson R. 2009. Chromosome crosstalk in three dimensions.
Nature461: 212–217. doi:10.1038/nature08453
Handoko L, Xu H, Li G, Ngan CY, Chew E, Schnapp M, Lee CW, Ye C, Ping JL, Mulawadi F, et al. 2011. CTCF-mediated functional chromatin inter-actome in pluripotent cells. Nat Genet43: 630–638. doi:10.1038/ng.857 Heinz S, Benner C, Spann N, Bertolino E, Lin YC, Laslo P, Cheng JX, Murre C, Singh H, Glass CK. 2010. Simple combinations of lineage-determin-ing transcription factors prime cis-regulatory elements required for mac-rophage and B cell identities. Mol Cell38: 576–589. doi:10.1016/ j.molcel.2010.05.004
Hillmer AM, Yao F, Inaki K, Lee WH, Ariyaratne PN, Teo AS, Woo XY, Zhang Z, Zhao H, Ukil L, et al. 2011. Comprehensive long-span paired-end-tag map-ping reveals characteristic patterns of structural variations in epithelial cancer genomes. Genome Res21: 665–675. doi:10.1101/gr. 113555.110 Hoffmann TJ, Van Den Eeden SK, Sakoda LC, Jorgenson E, Habel LA, Graff
RE, Passarelli MN, Cario CL, Emami NC, Chao CR, et al. 2015. A large multiethnic genome-wide association study of prostate cancer identifies novel risk variants and substantial ethnic differences. Cancer Discov5: 878–891. doi:10.1158/2159-8290.CD-15-0315
Kim S, Shin C, Jee SH. 2015. Genetic variants at 1q32.1, 10q11.2 and 19q13.41 are associated with prostate-specific antigen for prostate can-cer screening in two Korean population-based cohort studies. Gene556: 199–205. doi:10.1016/j.gene.2014.11.059
Krzywinski M, Schein J, Birol I, Connors J, Gascoyne R, Horsman D, Jones SJ, Marra MA. 2009. Circos: an information aesthetic for comparative geno-mics. Genome Res19: 1639–1645. doi:10.1101/gr.092759.109 Kuleshov MV, Jones MR, Rouillard AD, Fernandez NF, Duan Q, Wang Z,
Koplev S, Jenkins SL, Jagodnik KM, Lachmann A, et al. 2016. Enrichr: a comprehensive gene set enrichment analysis web server 2016 update. Nucleic Acids Res44: W90–W97. doi:10.1093/nar/gkw377
Lee SH, Johnson D, Luong R, Sun Z. 2015. Crosstalking between androgen and PI3K/AKT signaling pathways in prostate cancer cells. J Biol Chem 290: 2759–2768. doi:10.1074/jbc.M114.607846
Li G, Fullwood MJ, Xu H, Mulawadi FH, Velkov S, Vega V, Ariyaratne PN, Mohamed YB, Ooi HS, Tennakoon C, et al. 2010. ChIA-PET tool for comprehensive chromatin interaction analysis with paired-end tag se-quencing. Genome Biol11: R22. doi:10.1186/gb-2010-11-2-r22 Li G, Ruan X, Auerbach RK, Sandhu KS, Zheng M, Wang P, Poh HM, Goh Y,
Lim J, Zhang J, et al. 2012. Extensive promoter-centered chromatin in-teractions provide a topological basis for transcription regulation. Cell 148: 84–98. doi:10.1016/j.cell.2011.12.014
Lin CY, Vega VB, Thomsen JS, Zhang T, Kong SL, Xie M, Chiu KP, Lipovich L, Barnett DH, Stossi F, et al. 2007. Whole-genome cartography of estro-gen receptorα binding sites. PLoS Genet 3: e87. doi:10.1371/journal. pgen.0030087
Lin C, Yang L, Tanasa B, Hutt K, Ju BG, Ohgi K, Zhang J, Rose DW, Fu XD, Glass CK, et al. 2009. Nuclear receptor-induced chromosomal proximity and DNA breaks underlie specific translocations in cancer. Cell139: 1069–1083. doi:10.1016/j.cell.2009.11.030
Lingadahalli S, Jadhao S, Sung YY, Chen M, Hu L, Chen X, Cheung E. 2018. Novel lncRNA LINC00844 regulates prostate cancer cell migration and invasion through AR signaling. Mol Cancer Res16: 1865–1878. doi: 10.1158/1541-7786.MCR-18-0087
Magee JA, Chang LW, Stormo GD, Milbrandt J. 2006. Direct, androgen re-ceptor-mediated regulation of the FKBP5 gene via a distal enhancer ele-ment. Endocrinology147: 590–598. doi:10.1210/en.2005-1001 Majumder PK, Sellers WR. 2005. Akt-regulated pathways in prostate cancer.
Oncogene24: 7465–7474. doi:10.1038/sj.onc.1209096
Makkonen H, Kauhanen M, Paakinaho V, Jääskeläinen T, Palvimo JJ. 2009. Long-range activation of FKBP51 transcription by the androgen recep-tor via distal intronic enhancers. Nucleic Acids Res37: 4135–4148. doi:10.1093/nar/gkp352
Mani RS, Tomlins SA, Callahan K, Ghosh A, Nyati MK, Varambally S, Palanisamy N, Chinnaiyan AM. 2009. Induced chromosomal proximity and gene fusions in prostate cancer. Science326: 1230. doi:10.1126/ science.1178124
Parolia A, Crea F, Xue H, Wang Y, Mo F, Ramnarine VR, Liu HH, Lin D, Saidy NR, Clermont PL, et al. 2015. The long non-coding RNA PCGEM1 is regulated by androgen receptor activity in vivo. Mol Cancer14: 46. doi:10.1186/s12943-015-0314-4
Pflueger D, Terry S, Sboner A, Habegger L, Esgueva R, Lin PC, Svensson MA, Kitabayashi N, Moss BJ, MacDonald TY, et al. 2011. Discovery of non-ETS gene fusions in human prostate cancer using next-generation RNA sequencing. Genome Res21: 56–67. doi:10.1101/gr.110684.110 Prensner JR, Iyer MK, Balbin OA, Dhanasekaran SM, Cao Q, Brenner JC,
Laxman B, Asangani IA, Grasso CS, Kominsky HD, et al. 2011. Transcriptome sequencing across a prostate cancer cohort identifies PCAT-1, an unannotated lincRNA implicated in disease progression. Nat Biotechnol29: 742–749. doi:10.1038/nbt.1914
Prensner JR, Iyer MK, Sahu A, Asangani IA, Cao Q, Patel L, Vergara IA, Davicioni E, Erho N, Ghadessi M, et al. 2013. The long noncoding RNA SChLAP1 promotes aggressive prostate cancer and antagonizes the SWI/SNF complex. Nat Genet45: 1392–1398. doi:10.1038/ng.2771 Rickman DS, Soong TD, Moss B, Mosquera JM, Dlabal J, Terry S, MacDonald TY, Tripodi J, Bunting K, Najfeld V, et al. 2012. Oncogene-mediated al-terations in chromatin conformation. Proc Natl Acad Sci109: 9083– 9088. doi:10.1073/pnas.1112570109
Sahu B, Pihlajamaa P, Dubois V, Kerkhofs S, Claessens F, Jänne OA. 2014. Androgen receptor uses relaxed response element stringency for selec-tive chromatin binding and transcriptional regulation in vivo. Nucleic Acids Res42: 4230–4240. doi:10.1093/nar/gkt1401
Schneider R, Grosschedl R. 2007. Dynamics and interplay of nuclear archi-tecture, genome organization, and gene expression. Genes Dev 21: 3027–3043. doi:10.1101/gad.1604607
Schoenfelder S, Sexton T, Chakalova L, Cope NF, Horton A, Andrews S, Kurukuti S, Mitchell JA, Umlauf D, Dimitrova DS, et al. 2010. Preferential associations between co-regulated genes reveal a transcrip-tional interactome in erythroid cells. Nat Genet 42: 53–61. doi: 10.1038/ng.496
Shannon P, Markiel A, Ozier O, Baliga NS, Wang JT, Ramage D, Amin N, Schwikowski B, Ideker T. 2003. Cytoscape: a software environment for integrated models of biomolecular interaction networks. Genome Res 13: 2498–2504. doi:10.1101/gr.1239303
Sharma NL, Massie CE, Butter F, Mann M, Bon H, Ramos-Montoya A, Menon S, Stark R, Lamb AD, Scott HE, et al. 2014. The ETS family mem-ber GABPα modulates androgen receptor signalling and mediates an ag-gressive phenotype in prostate cancer. Nucleic Acids Res42: 6256–6269. doi:10.1093/nar/gku281
Shen MM, Abate-Shen C. 2010. Molecular genetics of prostate cancer: new prospects for old challenges. Genes Dev24: 1967–2000. doi:10.1101/ gad.1965810
Sung YY, Cheung E. 2014. Androgen receptor co-regulatory networks in castration-resistant prostate cancer. Endocr Relat Cancer 21: R1–R11. doi:10.1530/ERC-13-0326
Tan PY, Chang CW, Chng KR, Wansa KD, Sung WK, Cheung E. 2012. Integration of regulatory networks by NKX3-1 promotes androgen-de-pendent prostate cancer survival. Mol Cell Biol 32: 399–414. doi: 10.1128/MCB.05958-11
Tennakoon C, Purbojati RW, Sung WK. 2012. BatMis: a fast algorithm for k-mismatch mapping. Bioinformatics28: 2122–2128. doi:10.1093/ bioinformatics/bts339
Thibodeau SN, French AJ, McDonnell SK, Cheville J, Middha S, Tillmans L, Riska S, Baheti S, Larson MC, Fogarty Z, et al. 2015. Identification of can-didate genes for prostate cancer-risk SNPs utilizing a normal prostate tis-sue eQTL data set. Nat Commun6: 8653. doi:10.1038/ncomms9653 Tran C, Ouk S, Clegg NJ, Chen Y, Watson PA, Arora V, Wongvipat J,
Smith-Jones PM, Yoo D, Kwon A, et al. 2009. Development of a second-gener-ation antiandrogen for treatment of advanced prostate cancer. Science 324: 787–790. doi:10.1126/science.1168175
Trapnell C, Roberts A, Goff L, Pertea G, Kim D, Kelley DR, Pimentel H, Salzberg SL, Rinn JL, Pachter L. 2012. Differential gene and transcript ex-pression analysis of RNA-seq experiments with TopHat and Cufflinks. Nat Protoc7: 562–578. doi:10.1038/nprot.2012.016
Wang Q, Carroll JS, Brown M. 2005. Spatial and temporal recruitment of an-drogen receptor and its coactivators involves chromosomal looping and polymerase tracking. Mol Cell19: 631–642. doi:10.1016/j.molcel. 2005.07.018
Wang Q, Li W, Liu XS, Carroll JS, Jänne OA, Keeton EK, Chinnaiyan AM, Pienta KJ, Brown M. 2007. A hierarchical network of transcription fac-tors governs androgen receptor-dependent prostate cancer growth. Mol Cell27: 380–392. doi:10.1016/j.molcel.2007.05.041
Wang Q, Li W, Zhang Y, Yuan X, Xu K, Yu J, Chen Z, Beroukhim R, Wang H, Lupien M, et al. 2009. Androgen receptor regulates a distinct transcrip-tion program in androgen-independent prostate cancer. Cell138: 245– 256. doi:10.1016/j.cell.2009.04.056
Wang D, Garcia-Bassets I, Benner C, Li W, Su X, Zhou Y, Qiu J, Liu W, Kaikkonen MU, Ohgi KA, et al. 2011. Reprogramming transcription by distinct classes of enhancers functionally defined by eRNA. Nature 474: 390–394. doi:10.1038/nature10006
Wang M, Takahashi A, Liu F, Ye D, Ding Q, Qin C, Yin C, Zhang Z, Matsuda K, Kubo M, et al. 2015. Large-scale association analysis in Asians identi-fies new susceptibility loci for prostate cancer. Nat Commun6: 8469. doi:10.1038/ncomms9469
Wickham H. 2009. Ggplot2: elegant graphics for data analysis. Springer, New York.
Winterbach W, Van Mieghem P, Reinders M, Wang H, de Ridder D. 2013. Topology of molecular interaction networks. BMC Syst Biol 7: 90. doi:10.1186/1752-0509-7-90
Xu Q, Chen LL, Ruan X, Chen D, Zhu A, Chen C, Bertrand D, Jiao WB, Hao BH, Lyon MP, et al. 2013. The draft genome of sweet orange (Citrus sinensis). Nat Genet45: 59–66. doi:10.1038/ng.2472
Yang L, Lin C, Jin C, Yang JC, Tanasa B, Li W, Merkurjev D, Ohgi KA, Meng D, Zhang J, et al. 2013. lncRNA-dependent mechanisms of androgen-re-ceptor-regulated gene activation programs. Nature500: 598–602. doi: 10.1038/nature12451
Yu J, Yu J, Mani RS, Cao Q, Brenner CJ, Cao X, Wang X, Wu L, Li J, Hu M, et al. 2010. An integrated network of androgen receptor, Polycomb, and TMPRSS2-ERG gene fusions in prostate cancer progression. Cancer Cell17: 443–454. doi:10.1016/j.ccr.2010.03.018
Zamal FA, Ruths D. 2012. On the contributions of topological features to transcriptional regulatory network robustness. BMC Bioinformatics13: 318. doi:10.1186/1471-2105-13-318
Zhang Z, Chang CW, Goh WL, Sung WK, Cheung E. 2011. CENTDIST: dis-covery of co-associated factors by motif distribution. Nucleic Acids Res 39: W391–W399. doi:10.1093/nar/gkr387
Zhang Y, Wong CH, Birnbaum RY, Li G, Favaro R, Ngan CY, Lim J, Tai E, Poh HM, Wong E, et al. 2013. Chromatin connectivity maps reveal dynamic promoter–enhancer long-range associations. Nature 504: 306–310. doi:10.1038/nature12716