HAL Id: inserm-00617599
https://www.hal.inserm.fr/inserm-00617599
Submitted on 29 Aug 2011
HAL is a multi-disciplinary open access
archive for the deposit and dissemination of
sci-entific research documents, whether they are
pub-lished or not. The documents may come from
teaching and research institutions in France or
abroad, or from public or private research centers.
L’archive ouverte pluridisciplinaire HAL, est
destinée au dépôt et à la diffusion de documents
scientifiques de niveau recherche, publiés ou non,
émanant des établissements d’enseignement et de
recherche français ou étrangers, des laboratoires
publics ou privés.
Guillemette Antoni, Tiphaine Oudot-Mellakh, Apostolos Dimitromanolakis,
Marine Germain, William Cohen, Philip Wells, Mark Lathrop, France
Gagnon, Pierre-Emmanuel Morange, David-Alexandre Tregouet
To cite this version:
Guillemette Antoni, Tiphaine Oudot-Mellakh, Apostolos Dimitromanolakis, Marine Germain, William
Cohen, et al.. Combined analysis of three genome-wide association studies on vWF and FVIII plasma
levels.. BMC Medical Genetics, BioMed Central, 2011, 12 (1), pp.102. �10.1186/1471-2350-12-102�.
�inserm-00617599�
R E S E A R C H A R T I C L E
Open Access
Combined analysis of three genome-wide
association studies on vWF and FVIII plasma
levels
Guillemette Antoni
1,2,3†, Tiphaine Oudot-Mellakh
2†, Apostolos Dimitromanolakis
3, Marine Germain
1,2,
William Cohen
4,5, Philip Wells
6, Mark Lathrop
7, France Gagnon
3, Pierre-Emmanuel Morange
4,5and
David-Alexandre Tregouet
1,2*Abstract
Background: Elevated levels of factor VIII (FVIII) and von Willebrand Factor (vWF) are well-established risk factors for cardiovascular diseases, in particular venous thrombosis. Although high, the heritability of these traits is poorly explained by the genetic factors known so far. The aim of this work was to identify novel single nucleotide polymorphisms (SNPs) that could influence the variability of these traits.
Methods: Three independent genome-wide association studies for vWF plasma levels and FVIII activity were conducted and their results were combined into a meta-analysis totalling 1,624 subjects.
Results: No single nucleotide polymorphism (SNP) reached the study-wide significance level of 1.12 × 10⁻⁷that
corresponds to the Bonferroni correction for the number of tested SNPs. Nevertheless, the recently discovered association of STXBP5, STX2, TC2N and CLEC4M genes with vWF levels and that of SCARA5 and STAB2 genes with FVIII levels were confirmed in this meta-analysis. Besides, among the fifteen novel SNPs showing promising
association at p < 10-5with either vWF or FVIII levels in the meta-analysis, one located in ACCN1 gene also showed
weak association (P = 0.0056) with venous thrombosis in a sample of 1,946 cases and 1,228 controls.
Conclusions: This study has generated new knowledge on genomic regions deserving further investigations in the search for genetic factors influencing vWF and FVIII plasma levels, some potentially implicated in VT, as well as providing some supporting evidence of previously identified genes.
Background
Elevated plasma levels of factor VIII (FVIII) and von Willebrand factor (vWF), two key molecules of the coa-gulation cascade, are well-established risk factors for venous thrombosis (VT) [1-3]. More recent evidence shows that these plasma hemostatic proteins are also risk factors for other cardiovascular diseases (CVD) [4-8]. The broader role of FVIII and vWF is further sup-ported by studies showing that genetic factors modulat-ing the variability of these proteins are also associated with CVD. These include single nucleotide polymorph-isms (SNPs) at the BAI3 [9], LDLR [5,10], VWF [4] and
ABO [11] genes, the latter being associated with other
quantitative risk factors for CVD [12,13].
The estimated heritability of FVIII and vWF levels range between 40% and 60% [14,15] among which about 20% is attributable to the ABO locus. A genome wide association study (GWAS) within the CHARGE consor-tium [16] has recently identified five new genes, apart from their structural genes and ABO, consistently influ-encing vWF and/or FVIII plasma levels. These include
CLEC4M, SCARA5, STX2, STXBP5 and TC2N,
collec-tively explaining ~10% of the variability of each two traits. These observations suggest that there are addi-tional genetic factors remaining to be identified and contributing to the hidden heritability of these quantita-tive traits.
* Correspondence: david.tregouet@upmc.fr †Contributed equally
1UMR_S 937, INSERM, Boulevard de l’Hopital, Paris, 75013, France
Full list of author information is available at the end of the article
© 2011 Antoni et al; licensee BioMed Central Ltd. This is an Open Access article distributed under the terms of the Creative Commons Attribution License (http://creativecommons.org/licenses/by/2.0), which permits unrestricted use, distribution, and reproduction in any medium, provided the original work is properly cited.
The increased power of selected samples has long been recognized in family-based studies but more recently the putative advantages of carefully selected samples for quantitative trait analysis of unrelated sub-jects has also been highlighted [17]. Therefore, we undertook the combined analysis of individual data from three GWAS performed in samples of VT patients and in extended families ascertained on VT and Factor V Leiden (FVL) to identify novel genetic factors implicated in the variation of plasma levels of FVIII and vWF.
Methods
Overall strategy
To achieve our primary goal of identifying new genetic factors that could influence vWF and/or FVIII plasma levels, we used data from three carefully selected inde-pendent GWAS. Great attention was drawn to the homogeneity across samples in terms of - ethnic background (most individuals were of French origin), -exclusion criteria with respect to rare forms of inherited thrombophilia, - objectively diagnosed VT, - studied intermediate phenotypes (although some adjustments were done) and similar genotyping technologies (Illu-mina platform).
In the context of quantitative trait GWAS, individual genetic effect sizes are known to be small [18] and it is expected that a number of real associations do not reach genome-wide significance. Therefore, as part of our analytic strategy, we first tested for association in the individual studies, and results observed across sam-ples were combined into a meta-analysis. We then focused on the consistency of associations across studies as our hypothesis was that real associations would more likely be consistently observed across studies given that each study samples were quite homogeneous with respect to the above-mentioned characteristics. Pre-viously reported associations were also investigated using the above strategy.
As genetic variants associated to plasma levels of FVIII and vWF could be risk factors for VT, our secondary goal was to test the identified SNPs with VT using an in
silico GWAS [19]. Analytic approaches and samples
characteristics of the FVIII and vWF GWAS are described below.
FVL-families sample
Five extended French-Canadian families were ascer-tained through single probands with idiopathic VT diag-nosed at the Thrombosis Clinic of the Ottawa Hospital, and carrying the FVL mutation. VT cases secondary to cancer as well as rare forms of inherited VT (protein S, protein C, AntiThrombin deficiencies) were excluded. A pedigree was drawn from interviews with each potential probands. The largest families were invited to participate
in the study - the family size and willingness to partici-pate being the only criteria for the selection of the families (see Additional File 1, File S1 for the used ques-tionnaire). The total number of family members was 255. Description of the extended families has been pub-lished elsewhere [9].
MARTHA samples
The MARseille THrombosis Association (MARTHA) project is composed of two independent samples of VT patients, named MARTHA08 (N = 1,006) and MARTHA10 (N = 586). MARTHA subjects are unre-lated caucasians consecutively recruited at the Throm-bophilia center of La Timone hospital (Marseille, France) between January 1994 and October 2005. All patients had a documented history of VT and free of well characterized genetic risk factors including AT, PC, or PS deficiency, homozygosity for FV Leiden or FII 20210A, and lupus anticoagulant. They were interviewed by a physician on their medical history, which empha-sized manifestations of deep vein thrombosis and pul-monary embolism using a standardized questionnaire (see Additional file 2, File S2). The thrombotic events were confirmed by venography, Doppler ultrasound, spiral computed tomographic scanning angiography, and/or ventilation/perfusion lung scan. All the subjects were of European origin, with the majority being of French descent.
The main characteristics of the three samples are shown in Table 1.
In silico GWAS study on VT
In a previously published GWAS on VT [19], 419 early age of onset and the idiopathic character of VT (ie with-out environemental risk factors) (< 50 years) VT cases were compared to 1,228 healthy controls at 291,872
Table 1 Main Characteristics of the Studied Samples
FVL Families N = 253 MARTHA08 N = 972 MARTHA10 N = 570 Age (SD) 40.4 (17.9) 45.7 (14.9) 49.2 (15.7) Sex (% female) 50.6% 70.8% 58.2% Smoking (%) 24.4% 24.9% 22.71% History of VT (%) 5.95% 100% 100% PT G20210A carriers 0.40% 15.9% 10.6% FV Leiden carriers 24.9% 26.6% 14.1% ABO blood group (%)
O 40.6% 22.9% 22.4% A 57.8% 61.8% 59.3% B 1.6% 10.3% 14.4% AB - 5% 3.9% FVIII (SD) IU/dL 118.6 (38.51) 138.70 (55.34) 130.2 (46.35) vWF (SD) IU/dL 130.3 (53.24) 152.33 (68.23) 152.9 (63.93)
SNPs. Cases were patients from four different French medical centers (Grenoble, Marseille, Montpellier, Paris) selected according to the same criteria as the MARTHA samples, except with the restriction on age of onset. Controls were French subjects selected from the SUVI-MAX population [20].
Measurements
In the French-Canadian (FVL) sample, plasma levels of FVIII activity were measured by a clotting assay on the BCS instrument (Siemens Diagnostics, Marburg Ger-many) and vWF antigen was measured with a commer-cially available ELISA kit from Diagnostica Stago. The interassay coefficients of variation for FVIII were ~ 1% and 6.1% for vWF.
In MARTHA subjects, plasma coagulant activity and vWF antigen were assayed in an automated coagul-ometer (STA-R; Diagnostica Stago, Asnières, France). The interassay coefficients of variation for FVIII and vWF were 6.96% and 2.27% respectively.
Genotyping
The French-Canadian sample was genotyped with the Illumina 660W-Quad Beadchip. The raw datafile con-tained data for 547,886 autosomal SNPs genotyped on 255 individuals. From these SNPs, 490,083 passed the quality control (QC) criteria of genotyping rate > 90% and more than 20 observations of the minor allele among all individuals. After removing the 88,390 SNPs that failed QC, the overall genotyping rate was 99.88%. The maximum missing rate per sample for all the 255 samples was 3.9%, with an average missing rate of 0.13%. The family structures had previously been checked using 1079 microsatellite markers and RELPAIR [9]. To further verify the correctness of the family structure, we used PREST [21] and computed IBD estimates for all the sample pairs, within and across pedigrees. PREST reported 14,949 Mendelian errors, which is equivalent to a very low Mendelian error rate of 0.012% among all genotypes. Genotypes showing Mendelian inconsistencies were excluded from the ana-lysis. Finally, phenotypic and genotypic data were avail-able on a total of 253 individuals.
The MARTHA08 study sample was typed in 2008 with the Illumina Human610-Quad Beadchip containing 567,589 autosomal SNPs while the MARTHA10 sample was recently typed (beginning of 2010) with the same Illumina Human660W-Quad Beadchip as in the FVL
study sample. SNPs showing significant (P < 10-5)
devia-tion from Hardy-Weinberg equilibrium, with minor allele frequency (MAF) less than 1% or genotyping call rate < 99%, in each study were filtered out. Individuals with genotyping success rates less than 95% were excluded from the analyses, as well as individuals
demonstrating close relatedness as detected by pairwise clustering of identity by state distances (IBS) and multi-dimensional scaling (MDS) implemented in PLINK soft-ware [22]. Non-European ancestry was also investigated using the Eigenstrat program [23] leading to the final selection of 972 and 570 patients left for analysis in MARTHA08 and MARTH10, respectively. Plasma vWF levels were available in 834 and 537 MARTHA08 and MARTHA10 patients, respectively; corresponding num-bers were 541 and 548 for plasma FVIII levels. A total of 442,728 SNPs were common to the three GWAS datasets (see Additional file 3, Figure S1).
Statistical analysis
In the FVL families, association of SNPs with vWF and FVIII levels was tested by means of measured genotype linear association analysis as implemented in the SOLAR (version 4.0, http://solar.txbiomedgenetics.org/ download.html) program. In MARTHA subjects, asso-ciation was tested using linear model as implemented in the PLINK program [22].
In order to handle differences in phenotype distribu-tions across studies (Figure 1), and any possible devia-tion from normality, plasma levels of vWF and FVIII were first normalized before any statistical analysis using the normal quantile transformation [24], separately in
the French-Canadian sample, MARTHA08 and
MARTHA10. This transformation assigns to each observed measurement the quantile value of the stan-dard normal distribution that corresponds to the rank of this measurement in the original untransformed distri-bution. Transformed variables are then normally distrib-uted making linear models applicable, and linear regression coefficients comparable across studies. Asso-ciation analyses were then carried out on the trans-formed variables assuming additive allele effects (0,1, 2 coding according to the number of minor alleles), and adjusting for age, sex and ABO blood group as tagged by the ABO rs8176746, rs8176704 and rs505922 [19].
0 03 0 04 0 05 0 0 F V III ( IU /d L ) 0 03 0 04 0 05 0 0 vW F ( IU /d L ) FVL-Families N=253 MARTHA08 N=541 MARTHA10 N=548 01 0 0 2 0 FVL-Families N=252 MARTHA08 N=834 MARTHA10 N=537 01 0 0 2 0
Figure 1 Box Plot Distribution of FVIII (left) and vWF (right) Plasma Levels in the Three GWAS Datasets.
When appropriate, haplotype association analyses were carried out in MARTHA samples using THESIAS soft-ware [25] to handle the correlation between SNPs, that is linkage disequilibrium (LD). This widely used software implements a stochastic-EM algorithm that simulta-neously estimates the frequencies and the effect on the studied phenotype of each inferred haplotype. Haplotype - phenotype associations are then assessed by means of likelihood ratio tests.
Results obtained in each GWAS datasets were com-bined in a meta-analysis using the GWAMA program [26]http://www.sph.umich.edu/csg/abecasis/metal. Both fixed-effect and random-effect models- based analyses were conducted. Regression coefficients characterizing the minor allele effect of each SNP were then combined (after having checked that the minor allele was the same in the different populations) using the inverse-variance method to provide an overall allelic estimate. All reported P values were 2-sided.
Results
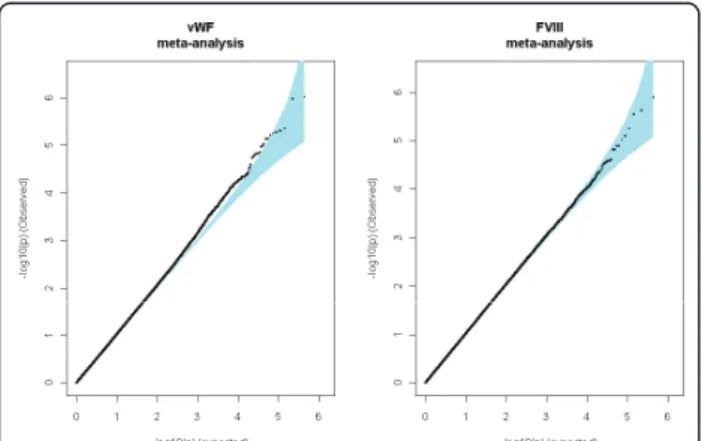
A total of 442,728 QC-validated SNPs were common to the three GWAS and were tested through a meta-analy-sis for association with vWF and FVIII plasma levels. Quantile-quantile plots did not reveal any inflation from what was expected under the null hypothesis of no asso-ciation (Figure 2), and no SNP reached the study-wide
significance level of 1.12 × 10⁻⁷that corresponds to the
Bonferroni correction for the number of tested SNPs. Applying the less stringent Sidak correction
correspond-ing to a significant threshold of p = 1.16 × 10⁻⁷would
not have modified this conclusion. We then further focused on genetic effects that were consistent across
studies and with combined p-value of less than 10-5. As
fixed-effect and random-effect analyses provided similar results for most of the main associations (Tables 2 &3),
the following discussion is based on results obtained from the fixed-effect model analysis.
Ten SNPs covering seven different genes (Figure 3 -Table 2) were associated with plasma vWF levels at p <
10-5with no strong evidence for heterogeneity across
GWAS as the lowest Mantel-Haenszel observed p-value, p = 0.036, for the ANKDR6 rs645764 would not pass multiple testing correction for testing ten SNPs. The strongest association was observed for rs379440 (P =
9.82 10-6) mapping the EPB41L4A gene (Table 2).
Another SNP at this locus was also associated with
vWF, rs13361927 (P = 4.51 10-6), but its association was
due to its complete LD with rs379440, with pairwise r2
of 0.78, 0.69 and 0.62 in FVL, MARTHA08 and MARTHA10, respectively. Other vWF-associated SNPs
included the SAFB2 rs732505 (P = 9.38 10-6), VPS8
rs4686760 (P = 1.08 10-6) and the KRT18P24 rs1757948
(P = 7.37 10-6). The last three SNPs, rs1438993,
rs10745527, rs2579103 (with P~ 6 10-6), were located at
the 12q21.33 locus with no known mapped gene and were in nearly complete association. Altogether, the independent signals derived from the rs4686760, rs379440, rs1757948, rs10745527 and rs732505 explained up to 5.7% and 3.8% of the variability of plasma vWF levels in MARTHA08 and MARTHA10, respectively, and 5.3% in the pooled MARTHA samples.
None of the ten vWF-associated SNPs were associated with plasma FVIII levels (all p > 0.05). However, six additional SNPs were specifically associated to FVIII levels with homogeneous effects (Mantel-Haenszel p-value > 0.05) across studies (Figure 4 - Table 3). The
strongest effect (P = 2.95 10-6) was observed for
rs7306642, a non synonymous Pro2039Thr variant within the STAB2 gene, which was one of the recently identified genes by the CHARGE consortium. However, our hit rs7306642 was not in LD with any of the two
STAB2 SNPs recently identified, rs4981022 (r2 < 0.01 in
the three studies) and rs4981021 that served as a proxy
for rs12229292 (r2 < 0.07 in the three studies). Other
FVIII-associated SNPs included the rs6708166 (P = 1.30
10-6) in the proximity of LBH, the rs1321761 ~ 300 kb
apart from FAM46A (P = 9.54 10-6 ) and the intronic
VAV2rs12344583 (P = 7.92 10-6) (Table 3). Lastly, two
SNPs within the ACCN1 gene, rs1354492 and rs12941510, were found modulating FVIII plasma levels, the A allele of the former being associated with
increased FVIII levels (b = +0.16, P = 2.42 10-6) and the
A allele of the latter being associated with decreased
levels (b = -0.17, P = 5.67 10-6). These two SNPs were
in complete negative LD generating three haplotypes, the sole carrying the rs1354492-A allele being associated with highest levels (see Additional file 4, Table S1). Altogether, these five SNPs (i.e. rs6708166, rs1321761, rs12344583, rs7306642, rs1354492) explained 8.2% and
Figure 2 Quantile-Quantile Plots of the Association Results from the Meta-Analysis of the Three GWAS Datasets.
4.6% of the variability of FVIII levels in MARTHA08 and MARTHA10, respectively, and 6.3% in the com-bined MARTHA samples.
We then used our GWAS datasets to investigate SNPs that had previously been reported associated with vWF and/or FVIII [4,5,9,16]. As shown in Supplementary Table two, marginal associations (P < 0.05) with vWF levels at STXBP5, VWF, STX2, TC2N and CLEC4M were also observed in our study, the strongest (P = 1.3
10-4) being for SNP rs216335 at the structural VWF
gene. All these associations were consistent (i.e the same allele was associated with a genetic effect in the same direction on the studied phenotype) with those previously reported. Together, these associations explained an additional 1.4% and 3.2% of the variance of
plasma levels of vWF in MARTHA08 and MARTHA10, respectively. We did not observe any evidence for an effect of STAB2 rs4981022 or BAI3 rs9363864, while the effect of SCARA5 rs2726953 was heterogeneous across the studies. For FVIII levels, we observed marginal asso-ciations of SCARA5 rs9644133 (P = 0.009) and VWF rs1063856 (P = 0.020) that were consistent with those previously reported (Table 4), these two SNPs explaining 0.7% and 0.2% of FVIII variability in MARTHA08 and MARTHA10, respectively. No trend for association was observed for the previously reported associations with
STXBP5, STAB2 nor LDLR SNPs (Table 5).
We have recently observed that, among the newly identi-fied vWF and/or FVIII genes by the CHARGE consortium,
TC2Ncould also be associated with VT risk [27]. Therefore
Table 2 Ten SNPs Showing Association with vWF levels Across the Three GWAS Datasets With Combined Significance P-value < 10-5
Gene SNP Alleles* MAF+ b (SE) p I2 phet Random Effect Fixed Effect
b (SE) p b (SE) p FVL 0.47 -0.16 (0.08) 0.044 VPS8 rs4686760 A/G Martha08 0.46 -0.18 (0.04) 4.11 10-5 0 0.549 0.15 (0.03) 1.10 10-6 -0.15 (0.03) 1.08 10-6 Martha10 0.45 -0.11 (0.05) 0.047 FVL 0.15 0.44 (0.11) 3.08 10-4 rs13361927 G/A Martha08 0.06 0.28 (0.09) 0.003 0.53 0.119 -0.28 (0.09) 0.002 0.28 (0.06) 4.51 10-6 EPB41L4A Martha10 0.05 0.11 (0.11) 0.316 FVL 0.12 0.46 (0.12) 8.35 10-4 rs379440 A/G Martha08 0.04 0.31 (0.11) 0.004 0 0.502 -0.34 (0.07) 9.99 10-7 0.34 (0.07) 9.82 10-7 Martha10 0.03 0.25 (0.14) 0.071 FVL 0.04 -0.01 (0.21) 0.977 ANKRD6 rs6454764 C/T Martha08 0.06 0.24 (0.09) 0.007 0.70 0.036 -0.29 (0.14) 0.035 0.31 (0.07) 5.12 10-6 Martha10 0.05 0.54 (0.12) 8.97 10-6 FVL 0.27 0.34 (0.09) 2.82 10-4 KRT18P24 rs1757948 T/G Martha08 0.27 0.1 (0.05) 0.030 0.62 0.071 -0.18 (0.06) 0.003 0.15 (0.03) 7.37 10-6 Martha10 0.30 0.15 (0.06) 0.009 FVL 0.19 0.15 (0.1) 0.127 rs1438993 G/A Martha08 0.28 0.18 (0.05) 1.11 10-4 0 0.666 -0.16 (0.03) 6.34 10-6 0.16 (0.03) 6.25 10-6 Martha10 0.27 0.12 (0.06) 0.052 FVL 0.20 0.19 (0.1) 0.062 desert rs10745527 T/G Martha08 0.28 0.18 (0.05) 1.63 10-4 0 0.663 -0.16 (0.03) 5.51 10-6 0.16 (0.03) 5.43 10-6 Martha10 0.27 0.11 (0.06) 0.056 FVL 0.18 0.17 (0.11) 0.098 rs2579103 T/G Martha08 0.26 0.19 (0.05) 8.24 10-5 0 0.533 -0.16 (0.04) 7.72 10-6 0.16 (0.04) 7.61 10-6 Martha10 0.25 0.1 (0.06) 0.090 FVL 0.04 -0.02 (0.19) 0.905 CDH2 rs2298574 A/G Martha08 0.08 -0.34 (0.08) 2.77 10-5 0.19 0.290 0.26 (0.07) 1.81 10-4 -0.27 (0.06) 5.67 10-6 Martha10 0.07 -0.24 (0.1) 0.022 FVL 0.05 0.32 (0.18) 0.080
SAFB2 rs732505 G/A Martha08 0.09 0.24 (0.08) 0.001 0 0.929 -0.25 (0.06) 9.50 10-6 0.25 (0.06) 9.38 10-6
Martha10 0.08 0.25 (0.1) 0.013
*Common/rare alleles
we investigated the effect of the SNPs identified in our meta-analysis on the risk of VT. Our working hypothesis was that SNPs associated with increased (decreased, resp.) plasma levels of these two molecules could be associated with increased (decreased, resp.) risk of disease. For this, we used the results of our previously published GWAS based on 419 VT patients and 1228 healthy subjects (in silico association) [19]. As indicated in Table 6, only two SNPs,
VPS8rs4686760 and ACCN1 rs12941510, showed some
trend of association consistent with our hypothesis. The rs4686760-G allele found associated with decreased vWF levels was slightly less frequent in VT patients than in con-trols (0.441 vs 0.475, P = 0.101) and the rs12941510-A allele, associated with decreased FVIII levels, was also less frequent in cases than in controls (0.310 vs 0.350, P = 0.046). These associations can only be considered as sugges-tive as they would not pass correction for multiple testing. Nevertheless, the observed homogeneity of the allele fre-quencies of these two SNPs across all genotyped patients is noteworthy. Combining all the VT patients (n = 1946), and comparing to the healthy controls of the in silico GWAS, the association of rs4686760 with VT remained (0.454 vs 0.475, P = 0.108), and that of rs12941510 was strengthened (0.314 vs 0.348, P = 0.0056) (Table 7).
Discussion
Theoretically, a sample size of 1,624 unrelated indivi-duals should have a power of 95% to detect, at the
significant level of 1.12 10-7, the additive allele effect of
a SNP explaining at least 3% if the variability of a quan-titative trait [28]. This power would decrease to 86% and 66% for a SNP explaining 2.5% and 2%, respectively. Our meta-analysis of 1,624 carefully selected samples did not reveal any genome-wide significant association suggesting that the additional common SNPs tagged by current GWAS array and influencing vWF and FVIII plasma levels left to be identified would, if any, individu-ally explain less than 2% of the variability of these two traits.
By lowering the statistical stringency to p < 10-5but
focusing on the homogeneity of the effects observed in three independent samples, we identified several novel candidate genes that could contribute to modulate the variability of vWF and FVIII, and that deserve to be further studied. The novel candidate genes for vWF are
VPS8, EBP41L4A, KRT18P24, SAFB2 and a region on
12q21.3 where no known gene maps. Unfortunately, lit-tle is known about the biology of the associated proteins and their role in cardiovascular diseases. Among these,
VPS8stands out. The rs4686760-G allele of the VPS8
gene, which was associated with decreased vWF levels, was also observed less frequently in VT cases than in healthy controls (0.45 vs 0.48) in the in silico GWAS, although this observation did not reach significance (P = 0.10). The vacuolar protein sorting 8 homolog gene (VPS8) is involved in protein traffic between the golgic Table 3 Six SNPs Showing Association with FVIII Activity Across the Three GWAS Datasets With Combined Significance P-value < 10-5
Gene SNP Alleles* MAF+ b (SE) p I2 phet Random Effect Fixed Effect
b (SE) p b (SE) p FVL 0.41 -0.12 (0.09) 0.156
LBH rs6708166 G/A Martha08 0.40 -0.23 (0.06) 8.98e-05 0 0.478 -0.17 (0.04) 1.32 10-6 -0.17 (0.04) 1.30 10-6 Martha10 0.42 -0.15 (0.05) 0.007
FVL 0.42 -0.20 (0.08) 0.014
FAM46A rs1321761 T/C Martha08 0.45 -0.10 (0.06) 0.074 0 0.451 -0.15 (0.04) 9.67 10-6 -0.15 (0.04) 9.54 10-6
Martha10 0.47 -0.19 (0.05) 5.93e-04 FVL 0.17 0.28 (0.11) 0.012
VAV2 rs12344583 A/G Martha08 0.20 0.19 (0.07) 0.006 0 0.716 0.20 (0.04) 8.03 10-6 0.20 (0.04) 7.92 10-6 Martha10 0.18 0.17 (0.07) 0.012
FVL 0.16 0.52 (0.12) 1.36e-05
STAB2 rs7306642 C/A Martha08 0.07 0.22 (0.11) 0.057 0.59 0.086 0.31 (0.10) 0.002 0.30 (0.06) 2.95 10-6
Martha10 0.07 0.20 (0.1) 0.052 FVL 0.53 0.09 (0.08) 0.293
rs1354492 G/A Martha08 0.49 0.23 (0.05) 1.20e-05 0.39 0.192 0.16 (0.04) 5.47 10-6 0.16 (0.03) 2.41 10-6
ACCN1 Martha10 0.47 0.12 (0.05) 0.027 FVL 0.22 -0.29 (0.1) 0.004
rs12941510 G/A Martha08 0.31 -0.17 (0.06) 0.002 0.12 0.321 -0.17 (0.04) 2.18 10-5 -0.17 (0.04) 5.67 10-6 Martha10 0.33 -0.12 (0.06) 0.029
*Common/rare alleles
appartus and the vacuaole [29] and could participate to the regulation of urokinase-type plasminogen activator [30], the latter known to be involved in thrombosis.
For FVIII levels, the candidate genes identified in our study were LBH, FAM46A, VAV2, STAB2 and ACCN1. Both LBH and VAV2 genes are thought to be involved in angiogenesis. The transcriptional cofactor limb-bud-and-heart (Lbh) was discovered as a small acidic nuclear protein highly conserved among species [31]. It has been demonstrated a dramatic suppression of VEGF mRNAs in cells that overexpress Lbh [32]. Vav2 is a guanine nucleotide exchange factor for Rho family pro-teins. The expression of a dominant negative form of Vav2 suppress the Vascular Endothelial-Protein Tyro-sine Phosphatise (VE-PTP)-induced changes in endothe-lial cell morphology, such changes being implicated in regulation of angiogenesis [33].
Interestingly, we had previously shown that STAB2 was located within a linkage peak for vWF levels in
our FVL extended families [9] while almost
concomitantly STAB2 SNPs were found associated with both FVIII and vWF in the CHARGE consortium GWAS [16]. However, the non-synonymous rs7306642 (Pro2039Thr) found associated here with FVIII levels did not show a homogeneous effect on vWF levels across the three GWAS datasets (data not shown), and was in very low LD with others STAB2 SNPs found associated with these plasma levels. The substitution of a Proline by a Threonine at position 2039 is predicted to be damaging according to web resources http:// genetics.bwh.harvard.edu/pph/index.html; http://www. rostlab.org/services/SNAP. Investigating the effect of this substitution on VT risk would have been relevant but the corresponding SNP did not pass quality con-trol in our in silico GWAS. These observations never-theless suggest that an in-depth haplotype analysis of the STAB2 gene are required to gain better insight into which SNPs more likely influence plasma levels of FVIII and/or vWF.
ACCN1, encoding an amiloride-sensitive cation
chan-nel implicated in cell growth and migration [34], is another gene that deserves greater attention as its genetic variability was found here associated with both FVIII levels and VT risk. However, the SNP that seemed to modulate FVIII levels the most, rs1354492, was not the one that showed association with the disease. This could suggest that either different SNPs distinctly influ-ence plasma levels and VT risk, or that the identified SNPs are in LD with unmeasured variant(s) that could simultaneously influence both phenotypes.
Cnngng Ghhgev
/206"""""/204"""""""""2""""""""204""""""""206""""""208""""""20:
Figure 3 Forest plot representation of the ten SNPs that associated the most with vWF levels in the Three GWAS Datasets. Results observed in the FVL families, MARTHA08 and MARTHA10 studies are depicted by square, circle and triangle, respectively.
Cnngng Ghhgev
/206"""""/204"""""""2""""""""204"""""""206""""""208""""""20:
Figure 4 Forest plot representation of the six SNPs that associated the most with FVIII levels in the Three GWAS Datasets. Results observed in the FVL families, MARTHA08 and MARTHA10 studies are depicted by square, circle and triangle, respectively.
Our meta-analysis was also able to replicate several of the previously reported associations between SNPs and vWF/FVIII levels. Replicated associations include vWF-associated SNPs at STXBP5, VWF, STX2, TC2N and
CLEC4M genes, and FVIII-associated SNPs within
SCARA5 and VWF genes. Other previously reported
associations were not replicated, such as those involving
LDLR, BAI3, and STAB2 SNPs [5,9,16]. In addition to a
lack of power, as previously discussed, this could be due to differential effects of SNP in normal range of plasma levels compared to the higher levels observed in VT patients. This could apply to the association of BAI3 with vWF levels observed in healthy nuclear families [9] where plasma levels were lower than those observed in
our VT samples. Conversely, this explanation does not completely hold for the LDLR SNPs that were found associated with FVIII activity in a population [5] where FVIII activity in healthy individuals were at higher levels than those observed in our VT patients. Besides, in these two studies, different methods from those we have used here were employed to measure vWF and FVIII activity, and this could also contribute to the discrepan-cies observed in our study.
Conclusions
In conclusion, a carefully planned meta-analysis of three independent samples gathering 1,624 individuals geno-typed for more than 400,000 SNPs all over the genome Table 4 Association of Previously Identified SNPs with vWF Levels in the three GWAS Datasets
Gene SNP Alleles* MAF+
b (SE) p I2 p
het Random Effect Fixed Effect
b (SE) p b (SE) p FVL 0.42 0.04 (0.08) 0.618
BAI3 rs9363864 A/G Martha08 0.52 0.03 (0.04) 0.421 0 0.838 0.02 (0.03) 0.461 0.02 (0.03) 0.461 Martha10 0.49 -0.002 (0.05) 0.973
FVL 0.43 -0.08 (0.08) 0.366
STXBP5 rs9390459 G/A Martha08 0.42 -0.06 (0.04) 0.197 0 0.545 -0.09 (0.03) 0.005 -0.09 (0.03) 0.005 Martha10 0.43 -0.13 (0.05) 0.011
FVL 0.20 -0.08 (0.10) 0.446
SCARA5 rs10866867(1) G/T Martha08 0.25 0.17 (0.05) 4.88e-04 0.71 0.03 0.05 (0.07) 0.466 0.09 (0.04) 0.015
Martha10 0.25 0.01 (0.06) 0.830 FVL 0.06 -0.28 (0.19) 0.141 rs216335(2) G/A Martha08 0.08 -0.23 (0.08) 0.003 0 0.945 -0.23 (0.06) 1.31 10-4 -0.23 (0.06) 1.30 10-4 Martha10 0.06 -0.21 (0.11) 0.059 FVL 0.45 0.07 (0.08) 0.371 VWF rs1063856(3) A/G Martha08 0.37 0.08 (0.05) 0.094 0 0.889 0.09 (0.03) 0.006 0.09 (0.03) 0.006 Martha10 0.38 0.11 (0.05) 0.041 FVL 0.48 -0.04 (0.08) 0.612 rs7306706 A/G Martha08 0.45 0.02 (0.04) 0.634 0 0.754 0.01 (0.03) 0.664 0.01 (0.03) 0.664 Martha10 0.46 0.03 (0.05) 0.604 FVL 0.30 -0.05 (0.09) 0.601 STAB2 rs4981022 T/C Martha08 0.30 0.02 (0.05) 0.652 0 0.541 -0.01 (0.03) 0.664 -0.01 (0.03) 0.664 Martha10 0.28 -0.06 (0.06) 0.333 FVL 0.33 0.01 (0.09) 0.863 STX2 rs4334059(4) C/T Martha08 0.37 0.08 (0.04) 0.067 0.01 0.363 0.1 (0.03) 0.004 0.1 (0.03) 0.003 Martha10 0.36 0.15 (0.06) 0.008 FVL 0.52 0.05 (0.08) 0.548 TC2N rs2402074(5) G/A Martha08 0.48 0.04 (0.04) 0.382 0 0.509 0.07 (0.03) 0.033 0.07 (0.03) 0.033 Martha10 0.47 0.12 (0.05) 0.030 FVL 0.22 -0.07 (0.1) 0.515
CLEC4M rs868875 A/G Martha08 0.32 -0.10 (0.05) 0.036 0 0.762 -0.08 (0.03) 0.026 -0.08 (0.03) 0.026 Martha10 0.35 -0.05 (0.06) 0.424
* Common/rare alleles
+
Allele frequency of the minor allele
(1)
rs10866867 serves as proxy for rs2726953 (r2= 0.92);(2)rs216335 serves as proxy for rs216318 (r2= 1)
(3)rs1063856 serves as proxy for Rs1063857 (r2= 1);(4)rs4334059 serves as proxy for rs7978987 (r2= 1.0
Table 5 Association of Previously Identified SNPs with FVIII Activity in the three GWAS Datasets
Gene SNP Alleles* MAF+
b (SE) p I2 p
het Random Effect Fixed Effect
b (SE) p b (SE) p FVL 0.43 0.15 (0.08) 0.083 STXBP5 rs9390459 G/A Martha08 0.42 -0.08 (0.06) 0.158 0.65 0.059 -0.02 (0.06) 0.795 -0.04 (0.03) 0.310 Martha10 0.43 -0.07 (0.05) 0.199 FVL 0.24 -0.08 (0.1) 0.433 SCARA5 rs9644133 C/T Martha08 0.17 -0.16 (0.07) 0.029 0 0.753 -0.12 (0.05) 0.009 -0.12 (0.05) 0.009 Martha10 0.18 -0.10 (0.07) 0.152 FVL 0.45 0.11 (0.08) 0.170 VWF rs1063856 A/G Martha08 0.37 0.09 (0.06) 0.114 0 0.843 0.08 (0.03) 0.020 0.08 (0.03) 0.020 Martha10 0.38 0.06 (0.05) 0.249 FVL 0.27 -0.13 (0.09) 0.146
STAB2 rs4981021(1) G/A Martha08 0.32 -0.02 (0.06) 0.737 0 0.389 -0.02 (0.04) 0.521 -0.02 (0.04) 0.521
Martha10 0.29 0.02 (0.06) 0.782 FVL 0.14 -0.03 (0.11) 0.816 rs2228671 C/T Martha08 0.11 0.11 (0.09) 0.193 0.46 0.157 -0.01 (0.07) 0.890 -0.01 (0.05) 0.894 LDLR Martha10 0.10 -0.13 (0.09) 0.161 FVL 0.38 -0.25 (0.09) 0.005 rs688 C/T Martha08 0.45 0.06 (0.05) 0.235 0.79 0.010 -0.05 (0.08) 0.531 -0.02 (0.03) 0.652 Martha10 0.45 -0.007 (0.05) 0.901 * Common/rare alleles
+Allele frequency of the minor allele
(1)rs4981021 serves as proxy for rs12229292 (r2= 0.88)
Table 6 In Silico Association With Venous Thrombosis of the Identified vWF- and FVIII Associated SNPs
Alleles* Minor Allele Frequency Cochran Armitage P-value Cases Controls vWF associated SNPs VPS8 rs4686760 A/G 0.441 0.475 P = 0.101 EPB41L4A rs13361927 G/A 0.065 0.062 P = 0.797 KRT18P24 rs1634352† G/A 0.284 0.318 P = 0.055 12q21.33 rs1438933 G/A 0.256 0.294 P = 0.051 CDH2 rs2298574 A/G 0.084 0.093 P = 0.444 SAFB2 rs732505 G/A 0.061 0.064 P = 0.713 FVIII associated SNPs VAV2 rs12344583 A/G 0.217 0.193 P = 0.133 ACCN1 rs1354492 G/A 0.476 0.469 P = 0.740 ACCN1 rs12941510 G/A 0.310 0.350 P = 0.046 *Common/minor alleles
†serves as proxy for rs1757948 (r2= 1).
replicated very recent findings but did not reveal any new genetic factors that could individually explain at least 2% of the plasma variability of vWF and FVIII levels.
Additional material
Additional file 1: FVL Family Questionnaire.
Additional file 2: MARTHA questionnaire. Excel file illustrating the questionnaire used for selecting MARTHA VT patients.
Additional file 3: Figure S1. Genotype filtering strategy applied to the three GWAS datasets.(1)A genotype calling rate of > 0.90 was
used in the FVL families and a threshold of 0.99 was used for the MARTHA patients.(2)SNPs with minor allele frequency less than 0.04 and
0.01 in FVL families and MARTHA patients, respectively, were excluded from the analysis.(3)SNPs demonstrating deviation from Hardy-Weinberg
equilibrium at p < 10-5were excluded. 217 SNPs failed the genotype calling criterion simultaneously in the three study samples and this number was 19,111 for the minor allele frequency criterion. 19 SNPs failed the Hardy-Weinberg criterion in MARTHA08 and MARTHA10. Additional file 4: Table S1. Haplotype Association Analysis of ACCN1 rs1354492 and rs12941510 With Plasma FVIII levels in MARTHA08 and MARTHA10 Studies.(1)Haplotypic effect associated with each
haplotype by comparison to the most frequent AG haplotype under the assumption of haplotype additive effects. Analyses were adjusted for age, sex and ABO blood group.
Acknowledgements
The French-Canadian FVL family study was supported by grants from the Canadian Institutes of Health Research (MOP86466) and by the Heart and Stroke Foundation of Canada (T6484). The MARTHA studies were supported by a grant from the Program Hospitalier de la Recherche Clinique. G.A hold an “INSERM Poste d’accueil” position and T.O.M was supported by a grant from the Fondation pour la Recherche Médicale. F.G and P.W. hold Canada
Research Chairs. A France-Canada Research Fund 2008 provided opportunities for face-to-face meetings of lead collaborators. Author details
1
UMR_S 937, INSERM, Boulevard de l’Hopital, Paris, 75013, France.2UMR_S 937, ICAN Institute, Université Pierre et Marie Curie, Boulevard de l’Hopital, 75013, Paris, France.3Dalla Lana School of Public Health, University of
Toronto, College Street, Toronto, M5T 3M7, Ontario, Canada.4UMR_S 626,
INSERM, rue Saint-Pierre, Marseille, 13385, France.5UMR_S 626, Université de
la Méditerranée, rue Saint-Pierre, Marseille, 13385 France.6Department of
Medicine, Ottawa Hopital Research Institute, Carling Avenue, Ottawa, K1Y 4E9, Ontario, Canada.7Institut de Génomique, Centre National de Génotypage, Commissariat à l’Energie Atomique, rue Gaston Crémieux, Evry, 91057, France.
Authors’ contributions
PEM, ML, FG and DAT designed the study and directed its implementation. GA, TOM and AD carried out statistical analyses. MG and WC were responsible for data collection and database management. GA drafted the article that was further reviewed by PEM, FG and DAT.
All authors read and approved the final manuscript. Competing interests
The authors declare that they have no competing interests. Received: 7 May 2011 Accepted: 2 August 2011 Published: 2 August 2011
References
1. Koster T, Blann AD, Briet E, Vandenbroucke JP, Rosendaal FR: Role of clotting factor VIII in effect of von Willebrand factor on occurrence of deep-vein thrombosis. Lancet 1995, 345:152-155.
2. Kraaijenhagen RA, in’t Anker PS, Koopman MM, Reitsma PH, Prins MH, van den Ende A, et al: High plasma concentration of factor VIIIc is a major risk factor for venous thromboembolism. Thromb Haemost 2000, 83:5-9. 3. Tsai AW, Cushman M, Rosamond WD, Heckbert SR, Tracy RP, Aleksic N,
et al: Coagulation factors, inflammation markers, and venous thromboembolism: the longitudinal investigation of thromboembolism etiology (LITE). Am J Med 2002, 113:636-642.
4. van Schie MC, de Maat MP, Isaacs A, van Duin CM, Deckers JW, Dippel DW, et al: Variation in the von Willebrand Factor gene is associated with VWF levels and with the risk of cardiovascular disease. Blood 2011, 117:1393-1399. 5. Martinelli N, Girelli D, Lunghi B, Pinotti M, Marchetti G, Malerba G, et al:
Polymorphisms at LDLR locus may be associated with coronary artery disease through modulation of coagulation factor VIII activity and independently from lipid profile. Blood 2010, 116:5688-5697.
6. Whincup PH, Danesh J, Walker M, Lennon L, Thomson A, Appleby P, et al: von Willebrand factor and coronary heart disease: prospective study and meta-analysis. Eur Heart J 2002, 23:1764-1770.
7. Folsom AR, Rosamond WD, Shahar E, Cooper LS, Aleksic N, Nieto FJ, et al: Prospective study of markers of hemostatic function with risk of ischemic stroke. The Atherosclerosis Risk in Communities (ARIC) Study Investigators. Circulation 1999, 100:736-742.
8. Cambronero F, Vilchez JA, Garcia-Honrubia A, Ruiz-Espejo F, Moreno V, Hernandez-Romero D, et al: Plasma levels of von Willebrand factor are increased in patients with hypertrophic cardiomyopathy. Thromb Res 2010, 126:e46-50.
9. Antoni G, Morange PE, Luo Y, Saut N, Burgos G, Heath S, et al: A multi-stage multi-design strategy provides strong evidence that the BAI3 locus is associated with early-onset venous thromboembolism. J Thromb Haemost 2010, 8:2671-2679.
10. Vormittag R, Bencur P, Ay C, Tengler T, Vukovich T, Quehenberger P, et al: Low-density lipoprotein receptor-related protein 1 polymorphism 663 C > T affects clotting factor VIII activity and increases the risk of venous thromboembolism. J Thromb Haemost 2007, 5:497-4502.
11. Carpeggiani C, Coceani M, Landi P, Michelassi C, L’Abbate A: ABO blood group alleles: A risk factor for coronary artery disease. An angiographic study. Atherosclerosis 2010, 211:461-466.
12. Teupser D, Baber R, Ceglarek U, Scholz M, Illig T, Gieger C, et al: Genetic regulation of serum phytosterol levels and risk of coronary artery disease. Circ Cardiovasc Genet 2010, 3:331-339.
Table 7 Genotype Distributions of rs4686760 and rs12941510 Across VT Samples rs4686760 AA AG GG MAF(2) MARTHA08 271 502 198 0.462 MARTHA10 173 281 115 0.449 GWAS patients 129 196 81 0.441 All VT patients 573 979 394 0.454 GWAS controls 354 581 292 0.475 Test of association P = 0.108(1) rs12941510 AA AG GG MAF MARTHA08 93 409 469 0.306 MARTHA10 67 243 259 0.331 GWAS patients 45 161 199 0.310 All VT patients 205 813 927 0.314 GWAS controls 139 576 512 0.348 Test of association P = 0.0056
(1)Cochran Armitage trend test (2)Minor Allele Frequency
13. Barbalic M, Dupuis J, Dehghan A, Bis JC, Hoogeveen RC, Schnabel RB, et al: Large-scale genomic studies reveal central role of ABO in sP-selectin and sICAM-1 levels. Hum Mol Genet 2010, 19:1863-1872.
14. Souto JC, Almasy L, Borrell M, Gari M, Martinez E, et al: Genetic determinants of hemostasis phenotypes in Spanish families. Circulation 2000, 101:1546-1551.
15. Morange PE, Tregouet DA, Frere C, Saut N, Pellegrina L, Alessi MC, et al: Biological and genetic factors influencing plasma factor VIII levels in a healthy family population: results from the Stanislas cohort. Br J Haematol 2005, 128:91-99.
16. Smith NL, Chen M-H, Dehghan A, Strachan DP, Basu S, Soranzo N, et al: Novel associations of multiple genetic loci with plasma levels of Factor VII, Factor VIII and von Willebrand Factor. The CHARGE (Cohorts for Heart and Aging Research in Genome Epidemiology) Consortium. Circulation 2010, 121:1392-1392.
17. Abecasis GR, Cookson WO, Cardon LR: The power to detect linkage disequilibrium with quantitative traits in selected samples. Am J Hum Genet 2001, 68:1463-1474.
18. Teslovich TM, Musunuru K, Smith AV, Edmondson AC, Stylianou IM, Koseki M, et al: Biological, clinical and population relevance of 95 loci for blood lipids. Nature 2010, 466:707-713.
19. Tregouet DA, Heath S, Saut N, Biron-Andreani C, Scheved JF, Pernod G, et al: Common susceptibility alleles are unlikely to contribute as strongly as the FV and ABO loci to VTE risk: results from a GWAS approach. Blood 2009, 113:5298-5303.
20. Hercberg S, Galan P, Preziosi P, Bertrais S, Mennen L, et al: The SU.VI.MAX Study: a randomized, placebo-controlled trial of the health effects of antioxidant vitamins and minerals. Arch Intern Med 2004, 164:2335-2342. 21. Sun L, Wilder K, McPeek MS: Enhanced pedigree error detection. Hum
Hered 2002, 54:99-110.
22. Purcell S, Neale B, Todd-Brown K, Thomas L, Ferreira MA, Bender D, et al: PLINK: a tool set for whole-genome association and population-based linkage analyses. Am J Hum Genet 2007, 81:559-575.
23. Price AL, Patterson NJ, Plenge RM, Weinblatt ME, Shadick NA, Reich D: Principal components analysis corrects for stratification in genome-wide association studies. Nat Genet 2006, 38:904-909.
24. Peng B, Yu RK, Dehoff KL, Amos CI: Normalizing a large number of quantitative traits using empirical normal quantile transformation. BMC Proc 2007, 1(Suppl 1):S156.
25. Tregouet DA, Garelle V: A new JAVA interface implementation of THESIAS: testing haplotype effects in association studies. Bioinformatics 2007, 23:1038-1039.
26. Magi R, Morris AP: GWAMA: software for genome-wide association meta-analysis. BMC Bioinformatics 2010, 11:288.
27. Morange PE, Saut N, Antoni G, Emmerich J, Tregouet DA: Impact on venous thrombosis risk of newly discovered gene variants associated with FVIII and VWF plasma levels. J Thromb Haemost 2011, 9:229-231. 28. Gauderman WJ, Morrison JM: Quanto 1.1: a computer program for power
and sample sizee calculations for genetic-epidemiology studies. 2006 [http://hydra.usc.edu/gxe].
29. Chen YJ, Stevens TH: The VPS8 gene is required for localization and trafficking of the CPY sorting receptor in Saccharomyces cerevisiae. Eur J Cell Biol 1996, 70:289-297.
30. Agaphonov M, Romanova N, Sokolov S, Iline A, Kalebina T, et al: Defect of vacuolar protein sorting stimulates proteolytic processing of human urokinase-type plasminogen activator in the yeast Hansenula polymorpha. FEMS Yeast Res 2005, 5:1029-1035.
31. Briegel KJ, Baldwin HS, Epstein JA, Joyner AL: Congenital heart disease reminiscent of partial trisomy 2p syndrome in mice transgenic for the transcription factor Lbh. Development 2005, 132:3305-3316.
32. Conen KL, Nishimori S, Provot S, Kronenberg HM: The transcriptional cofactor Lbh regulates angiogenesis and endochondral bone formation during fetal bone development. Dev Biol 2009, 333:348-358.
33. Mori M, Murata Y, Kotani T, Kusakari S, Ohnishi H, Saito Y: Promotion of cell spreading and migration by vascular endothelial-protein tyrosine phosphatase (VE-PTP) in cooperation with integrins. J Cell Physiol 2010, 224:195-204.
34. Vila-Carriles WH, Kovacs GG, Jovov B, Zhou ZH, Pahwa AK, Colby G, et al: Surface expression of ASIC2 inhibits the amiloride-sensitive current and migration of glioma cells. J Biol Chem 2006, 281:19220-19232.
Pre-publication history
The pre-publication history for this paper can be accessed here: http://www.biomedcentral.com/1471-2350/12/102/prepub
doi:10.1186/1471-2350-12-102
Cite this article as: Antoni et al.: Combined analysis of three genome-wide association studies on vWF and FVIII plasma levels. BMC Medical Genetics 2011 12:102.
Submit your next manuscript to BioMed Central and take full advantage of:
• Convenient online submission • Thorough peer review
• No space constraints or color figure charges • Immediate publication on acceptance
• Inclusion in PubMed, CAS, Scopus and Google Scholar • Research which is freely available for redistribution
Submit your manuscript at www.biomedcentral.com/submit