A Gas Chromatograph-Pedestal Olfactometer (GC-PO)
for the Study of Odor Mixtures
Robert C. Williams&Emeline Sartre&Fanny Parisot& Anne J. Kurtz&Terry E. Acree
Received: 17 July 2008 / Accepted: 16 September 2009 / Published online: 7 October 2009
# 2009 Springer Science + Business Media, LLC
Abstract Gas chromatography – Olfactometry (GC-O) purifies odorants and delivers them as 1 to 2 second doses to an olfactometer where their odor properties (quale and intensity) can be studied independent of other odors. Adding an odor to the olfactometer air before combining it with the GC effluent creates an odor pedestal upon which an odorant eluting from the GC can be studied to provide insight into mixture perception. This paper describes the development and testing of a gas chromatography - pedestal olfactometer (GC-PO) that produces a Gaussian shaped distribution of one odorant in a background of constant odor composition (the pedestal).
A constant pedestal composition was generated by a dynamic headspace released from poly(ethylene) glycol (PEG) solutions into the humidified air of a gas chromato-graph-olfactometer (GCO). A magnetic stirrer kept the solvent at the interface in equilibrium with the remainder of the solution producing a constant (+ 10%) pedestal concentration. The resulting pedestal was then combined with a GC effluent and sent to the sniff port of the GC-O. Hexanal, octanal and decanal were analyzed by gas chromatography-mass spectrometry to test the performance and stability of the pedestal. Volatile concentrations of compounds released in the pedestal of GC-PO were linear, constant and could be turned on and off without any detectable background or residual odor.
Keywords Gas Chromatography . Olfactometry . Pedestal Experiment . Mixture Perception
Introduction
The perception of odor mixtures begins with the simulta-neous activation of multiple odor receptors in the olfactory epithelium. In rodent models, it is clear that several different odor receptors are activated concurrently by the same odorant and that different odorants can activate the same receptor. This is especially true of the I-7 receptor (Araneda et al. 2000). How the resulting pattern of neural activity is encoded is not known, nor is it possible to predict the odor images produced by a mixture from the smell of component odorants (Livermore and Laing1998); (Wilson
1998). This paper describes a hyphenated analytical procedure called gas chromatography-pedestal olfactometry (GC-PO), following the principle of pedestal experiments used in the study of visual and auditory image processing (Graham 1989), (Tanner 1961). In pedestal experiments, a brief stimulus pulse (called the“figure” or the “stimulus”) is added without interruption to a steady-state stimulus (called the“ground” or the “pedestal”).
In 1992, Cain and Polak studied binary mixtures using a two-channel dilution olfactometer (Dravnieks 1975) in which subjects moved their nose from one channel delivering a steady-state mixture of odorants to another channel delivering a different steady-state mixture of odorants. In their discussion of the limitations posed by two-channel olfactometry, they outlined a new procedure that would eliminate this disruption in which one channel is superimposed dynamically on a steady-state channel (a pedestal). “A potential procedure could entail steady-state adaptation to one odorant and superposition of a second of different quality during test trials. Participants would need to detect the superposed stimulus. Similarity of odor quality, loss of sensitivity to the test odorant via cross-adaptation, and masking of the test stimulus could all come into play to make it more difficult to detect against the background” (Cain and Polak1992). In 2003, Hattori et al.
R. C. Williams
:
A. J. Kurtz:
T. E. Acree (*) Food Science & Technology, Cornell University, Geneva, NY 14456, USAe-mail: [email protected] E. Sartre
:
F. ParisotUniversity of Burgundy, ENSBANA, Dijon, France
(2003) described such a pedestal olfactometer in which the pedestal is the headspace of green tea and the stimulants were GC effluents of other chemicals, in effect a GC-PO. A similar system using orange juice headspace as a pedestal was described by de Jong (Burseg and de Jong 2008) to study masking of taints. Both of these systems were based on purging aqueous solutions to produce pedestals. In order to have quantitative control of the humidity and the composition of the olfactometry air, we developed a GC-PO based on the dynamic release of odorants from a non-volatile solvent. The GC-PO described here is based on a GC-olfactometry (GC-O) design previously published (Acree et al. 1976) and built by modifying the GC-O produced by DATU Inc., Geneva, NY, USA.
Hexanal (C6) and octanal (C8) were chosen to test the viability of the GC-PO design because of chemical similarity and their perceptual differences, for example, principal component analysis of the straight-chain aldehydes ranging in length from six to 12 carbons described C6 as “grassy-green” in character, while aldehydes C7–C12 had a similar “citrus” character (Kittel et al.2008). Odor perceptions of binary mixtures of C6 and C8 are elemental, exhibiting no emergent qualities (Cain and Drexler 1971; Laing and Wilcox1983): just“green” and “citrus”. It is expected that the GC-PO could demonstrate objectively the existence of emergent qualities in mixtures if such a mixture could be created. There is no evidence that C6 and C8 mixtures are anything but elemental. Furthermore, the rodent homologue of the hI-7 olfactory receptor (OR), rI-7, is not responsive to C6, while C8 is the primary agonist of rI-7 (Zhao and Ivic
1998). Although very few human ORs have been de-orphanized, the homology between hI-7 and rI-7 might indicate a similar receptive behavior. Thus, C6 and C8 differ in both odor quality and in their binding behavior with the I7, while C8 and C10 have similar odor quality and OR-I7-binding behavior profiles. Therefore, C6 and C8 should show simple elemental behavior in the GC-PO in which a subject experiences only two qualities:“green” and “citrus”. For the purposes of this paper, an odor percept comprises two elements: odor quality and odor intensity.
Materials and Methods Test Odorants
The odorants used for testing the pedestal were the straight-chain aldehydes hexanal (“C6”, Sigma-Aldrich, St. Louis, MO, USA, 98% purity), octanal (“C8”, Sigma-Aldrich, 99%), and decanal (“C10”, SAFC, St. Louis, MO, USA, 95+%). For testing the stability and linearity of the pedestal, all three odorants were tested at three concen-tration values: 0.01%, 0.05%, and 0.15%, (v/v), dissolved
in poly(ethylene glycol) (PEG, typicalMn= 300, Sigma-Aldrich). For testing the olfactory properties of the pedestal, C6 was dissolved in Freon 113 (duPont, Wilmington, DE, USA) at three concentrations: 0.004%, 0.04%, and 0.25% (v/v), as well as a Freon blank; C8 was dissolved in PEG at three concentrations: 0.01%, 0.04%, and 0.16% (v/v). C10 was not used to test the olfactory properties of the pedestal. This created 12 different permutations of an octanal pedestal and a hexanal stimulus. Pentane would be an alternative solvent to Freon.
GC-PO Design
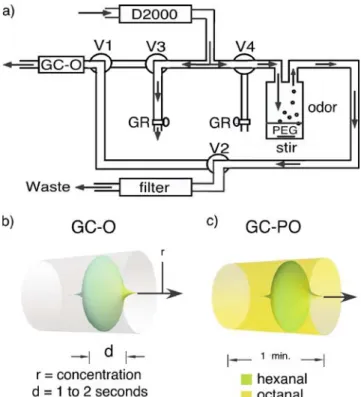
Figure1ashows a diagram of the GC-PO described in this paper. It used a pedestal generator that released odorants dissolved in 50 mL of PEG, contained within a 400-mL cylindrical glass jar (8 cm in diameter, 9 cm in height). Mixing the PEG solution with a magnetically driven stir bar (7 cm long and 1 cm in diameter) at about 100 rpm and sweeping it with humidified and purified olfactometry air (10 L/min) yielded predictable and stable pedestal compo-sitions. The pedestal was a blend of the odorant from the generator and the olfactometry air, pulsed for 1 to 5 min in
Fig. 1 a) GC-PO diagram, showing the air supply (D2000), software controlled valves (V1-4), pressure balancing needle valves (GR), pedestal generator with PEG, waste filter and GC-O, b) a graphic of a GC-O humidified air stream containing an idealized gaussian hexanal GC peak (green color) 1 or 2 seconds duration and c) olfactometry background air colored yellow to indicate a uniform octanal concentration in the background air (pedestal) surrounding a hexanal peak
an otherwise odorless olfactometer air stream by program-ming the four valves shown in Fig.1a. These pulses were software controlled to occur anytime during the GC run in order to coincide with a volatile eluting from the GC. Figure1bshows an idealized graphic of a GC-O humidified air stream containing a Gaussian-shaped hexanal GC peak (green color, 1 or 2 s duration). Figure1cshows the same graphic containing the idealized hexanal GC peak with the surrounding olfactometry background air colored yellow to indicate a uniform octanal concentration (the pedestal).
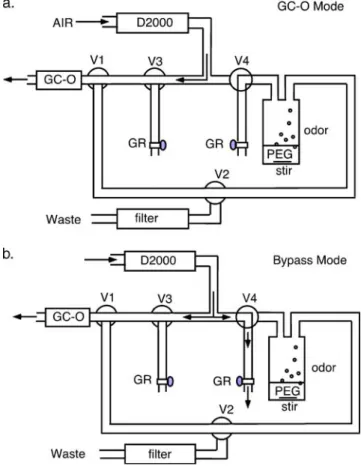
In order to produce a pedestal with a uniform compo-sition, the valves shown in the diagram can be programmed to put the GC-PO into one of four states. First is an inactive mode (GC-O mode, Fig. 2a) in which the system can be used as standard GC-O system. To initiate a pedestal run, the system is switched to a second state (static bypass mode, Fig.2b), in which the air supply is split between a balancing valve and the GC-O. In this state, the magnetic stirrer is turned on, and the headspace above the PEG solution will tend toward a static equilibrium, resulting in an elevated odorant concentration in the PEG container
headspace. The balancing valves are used to obtain equal airflow in both directions.
To insert a pedestal into the olfactometry air stream, the valves are changed to the configuration shown in Fig. 3a
(dynamic bypass mode), during which, the headspace is brought to a dynamic equilibrium by passing an identical flow of olfactometry air to the PEG container and to the pressure-balancing needle valve GR. The air from the PEG container is discarded through a charcoal filter before it reaches the GC-O sniff block and receives only humidified and purified air. In this state, the mixing of the PEG solution eliminates gradients in the liquid phase that could reduce the stability and duration of the pedestal.
Finally, in order to initiate the full pedestal mode, the valves are changed to the configuration shown in Fig. 3b
(pedestal mode), where airflow from the D2000 is balanced between the PEG container and a needle valve (V3). The
Fig. 2 a) GC-PO diagram in GC-O mode in which the humidified purified air from the D2000 is shunted directly to the GC-O sniff block where it combines with the GC effluent and exits a 1cm diameter sniff tube. b) shows the system in Bypass Mode in which air supply is split between a balancing valve and the GC-O in preparation for pedestal generation
Fig. 3 a) GC-PO diagram in Dynamic Bypass Mode in which the humidified pruified air from the D2000 is sent to the pedestal generator and then to a carbon filter to remove any odorants before exiting. This allows the pedestal to stabilize at a constant composition before adding the pedestal to the GC-O air stream. b) shows the system in GC-PO Mode in which the air supply now contains constant concentration of odorants to yield a pedestal to combine with a GC effluent in the sniff block
airflow passes through the PEG container, carrying with it the pedestal odorant, and then passes to the GC-O sniff block, where it combines the pedestal or “ground” odor with the GC effluent. It is in this mode that “stimulus” odorants elute from the gas chromatograph and are smelled by the subject in concert with the pedestal odorant.
The valves (V) are stainless-steel Swagelok (Rochester, NY, USA) ball valves controlled by Hanbay (Beaconsfield, QC, Canada) quarter-turn actuators, using an Arduino controller, driver, and C program (www.arduino.cc, version 0011 Alpha) to operate the actuators. The system operates in GC-PO mode for the time it takes an odorant to elute from the GC. Figure-ground experiments can be designed using mixtures in the pedestal generator as a ground, but only one odorant at a time can be tested as a figure. GC-MS Conditions
All quantitative analyses were done by injecting 1 mL gas samples from a headspace sample collected with a Tedlar bag (0.5 L, CEL Scientific, Santa Fe Springs, CA, USA) attached to the output of the pedestal generator into an Agilent 6890 GC attached to an Agilent 5973 Mass Selective Detector ionizing at 70 eV. The injector was set at 225°C, while the oven was held isothermal at 35°C for 3 min, and then programmed at 6°C/min for 20 min and held at 235°C for 5 min. The column was a 30 m × 0.25 mm ID DB-5 5% phenyl methyl silicone (0.5 µm thick) wall coated open tubular column with an He flow of 1 mL/min (linear velocity of 26 cm/s). Normal paraffin standards (C6 to C20, prepared from standards from Sigma-Aldrich) were analyzed using the same program and used to calculate retention indices. Authentic standards of C6, C8, and C10 (Sigma-Aldrich) were used to calibrate the gas chromatography-mass spectrometry (GC-MS) responses for quantification.
GC-PO Conditions
The pedestal was generated by passing 10 L/min of humidified purified air over a 50-mL odorant-PEG solution mixing at 100 rpm. The valve sequence (see Figs.2and3) was started with the GC program and run 6.5 min. When hexanal was injected, it eluted at 5.7 min from the GC. The GC injector was operated splitless with a 30-s purge at 225°C, and the oven was held isothermal at 35°C for 3 min and then programmed at 6°C/min to 60°C. The rate was then increased to 30°C/min to 100°C and held for 2 min. The GC-O input was held at 250°C, and the GC effluent was incased in 60 mL/min He before it was cooled with 450 mL/min air and then combined with 10 L/min purified humidified olfactometer air. The GC column was the same as in the GC-MS conditions above, using the same gas and flow rate.
Tests of Pedestal Stability and Linearity
Quantitative measurements were made of the pedestal headspace composition in order to examine the stability of the pedestal over a 15-min time period. Also, the kinetics of the transfer of odorant in the PEG solution to the headspace was investigated.
The pedestal’s stability was tested using 0.5 L Tedlar bags attached to the output of the pedestal machine while in pedestal mode and filled to 80% of their capacity within 2.4 s at 0 s, 30 s, 1 min, 2 min, 5 min, 10 min, and 15 min after switching to pedestal mode from GC-O mode and skipping the bypass mode (Figs. 2 and 3). Linearity was tested using the full valve sequence shown in Figs.2and3, equilibrating for 5 min, and then taking a 1-mL sample from the Tedlar bag to quantify by GC-MS (Fig. 4). The mean of the four headspace concentration values as measured at 2, 5, 10, and 15 min was compared with the
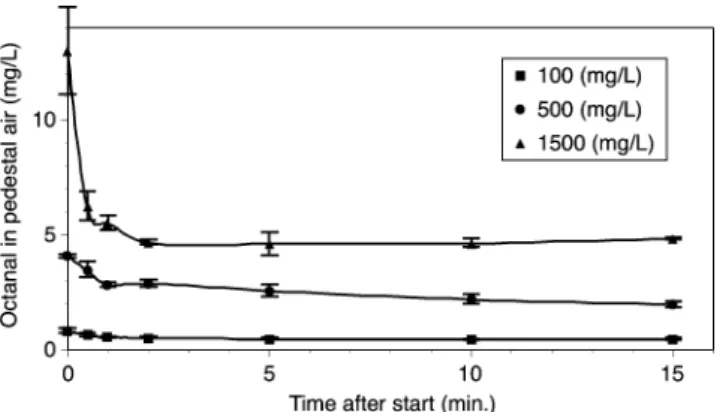
Fig. 4 A plot of the octanal concentration in the pedestal air for octanal was less than the standard error in the concentration of the odorant measured by GCMS using Tedlag bag sampling between 1 and 15 min. The same results were obtained for both hexanal and decanal
Fig. 5 A plot of the pedestal concentration vs the concentration of hexanal, octanal, and decanal in the PEG is linear over the concentration ranges these compounds produce odor in the GCPO
odorant concentration in the PEG solution in order to examine the transfer kinetics of the odorant solution (Fig.5).
Tests of Olfactory Performance of Pedestal
Preliminary studies tested the olfactory character of the ped-estal. As schematized in Fig.6, panelists (n = 4, one male,
three females, mean age = 23) were presented with a C8 pedestal and a C6 stimulus. Data was collected at several points during the pedestal run (Fig.6): at point t0, calculated to be 1 min prior to the C6 elution, panelists were told to briefly sniff the pedestal air and rate its odor quality. At point t1, calculated to be 10 s prior to the beginning of the C6 elution, panelists were told to begin sniffing, to rate the intensity of the pedestal, and to continue sniffing for 30 s. They were also instructed to register any change in the quality of the air coming from the GC-PO by clicking and holding down a mouse button for the duration of that change, and then selecting a description for the new odor quality. At point t2, where C6 eluted from the chromato-graph, no visual or auditory cue was given for the precise timing of the elution. At point t3, 30 s after point t1, panelists
were asked to rate the odor intensity and odor quality of the pedestal air, and then to stop sniffing. Each panelist was tested on all 12 permutations of an octanal pedestal and a hexanal stimulus, and each panelist repeated each permuta-tion three times.
For odor quality ratings, panelists were able to select from a short list of descriptors: “hexanal”, “octanal”, “floral”, “nutty”, “rancid”, and “vegetal”. All panelists had previously been trained to recognize C6 and C8 by smelling 1% solutions (v/v) of the chemicals, dissolved in PEG. The odor quality descriptions other than “hexanal” and “octanal” were taken from Kittel et al. (2008) and represent qualities of odorants chemically similar to C6 and C8. Intensity ratings were done on a 1–5 category scale similar to that used by (Liang and Wilcox1983a,b), where a rating of 1 indicated“no odor” and a rating of 5 indicated “very strong odor”. Panelists were told to sniff about 1.5 times per second, a comfortable rate that allows constant
Fig. 7 The frequency each descriptor was chosen when the pedestal was first sniffed (t1 Figure6) showing a single octanal quality (n=108)
Fig. 8 The frequency each descriptor was chosen at the time hexanal eluted on an octanal pedestal (t2 in Figure 6) showing no emergent odors due to the presence of the pedestal (n=108)
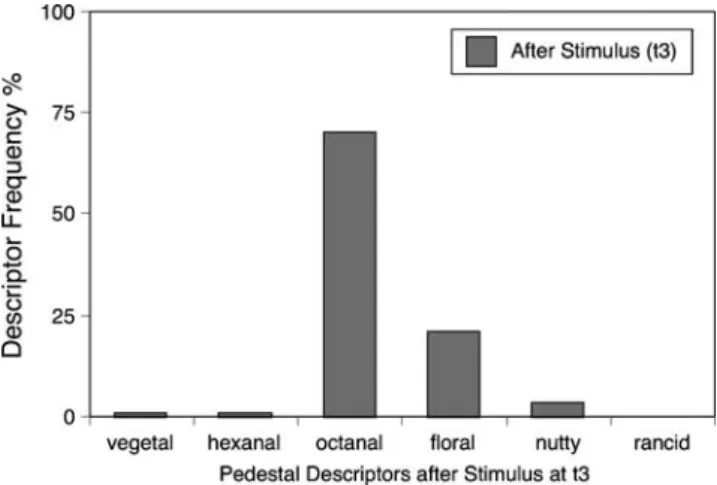
Fig. 9 The frequency each descriptor was chosen at a time after the hexanal eluted when only octanal pedestal was present (t3 in Figure6). The octanal descriptor was chosen less frequently after the hexanal was experienced even though only octanal was present
Fig. 6 Cartoon showing the times when subjects were asked to assess odor intensity and odor quality at the GC-PO sniff port. A 0.25 molar octanal pedestal was started at 2.5 minutes before hexanal eluted and run for 30 sec after hexanal eluted. Subjects were asked to assess qualia and intensity before, t1, during, t2, and after, t3, hexanal eluted
sampling and minimizes adaptation, and were experienced with work using GC-O and category scaling of odor perceptions. Data Analysis
The volatile measurements in Figs.4and 5were means of several experiments (n = 3 to 5), where the bars represent standard deviations. The lines in Fig. 5 are linear regressions (Microsoft Excel, Version 12.2 for Macintosh) of the MS total ion current responses for each volatile in the pedestal vs their concentration in the PEG. The data in Figs. 7, 8, and 9 are the frequencies each descriptor was chosen expressed in percent. The data in Figure 10 was calculated mean intensity scores, and the I-bars are their 95% confidence intervals (using Mathematica). The con-centrations of the stimulant used in Fig.10were coded as 1, 2, 3, 4, and the intensities at t1and t3fitted to these coded concentrations (linear regression).
Results
After a 1–2-min period of instability, during which the pedestal is likely attaining a dynamic equilibrium, head-space concentration values for C8 were stable over a 15-min time period for each solution concentration tested (Fig.4), with the variation in the interval between minutes 2–15 being less than the standard error. Similar results were obtained for C6 and C10 (data not shown), suggesting that
the GC-PO is capable of delivering a stream of olfactom-etry air at a defined and stable concentration for at least 15 min after an initial unstable period of 1–2 min, during which the pedestal is likely re-attaining a dynamic equilibrium. When the odorant concentrations in the PEG solution were compared to the results obtained for odorant concentrations in the pedestal gas, a clear linear relationship was observed (Fig. 5), indicating that the machine design does not inhibit a steady and linear release of the odorant from the PEG solution during the period between 2 and 15 min. While the rate of release was different for each odorant, corresponding to differences in volatility of the odorants, each odorant produced a precise linear regression of the concentration of the pedestal air delivered to the GC-PO. When the GC-PO was programmed to produce a pedestal of C8 with a C6 stimulus and panelists were asked to rate its odor quality at point t0 (1 min prior to the C6 elution), panelists reported, as expected, a clear and stable “octanal” quality (Fig. 7b), which indicates that the panelists were clearly perceiving the octanal coming out of the GC-PO. After rating the pedestal odor intensity at point t1, panelists consistently (86.1% of non-blank runs) recorded a change in odor quality at a time that coincided with the elution of C6 at point t2, and consistently (76.9% of non-blank runs) recorded that odor quality as“hexanal” (Fig. 7b); this despite the fact that both C6 and C8 were eluting at point t2. No response was recorded in any of the blank runs. On 13.9% of non-blank runs, panelists failed to record a change in odor quality corresponding to the elution of C6 at point t2; as one would expect, these failures were primarily (68.8% of the time) the result of a high (0.16% v/v) pedestal concentration and low or medium (0.004% or 0.01%v/v) stimulus concentration.
When asked to rate the odor quality of the pedestal at point t3, some panelists unexpectedly rated the odor quality with a descriptor other than“octanal” (Fig.8a), despite the fact that no odor was ever detected at t3when no pedestal was present. However, further tests are needed to understand this result.
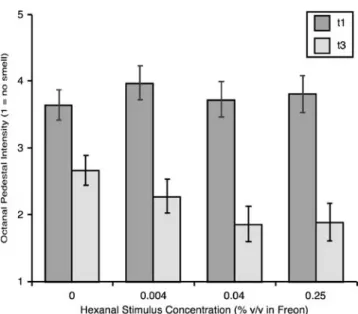
As was expected, the odor intensity of the pedestal declined significantly (Fig.10) during the interval between point t1, when panelists began sniffing, and point t3, when panelists stopped sniffing. While the odor intensity ratings of the pedestal for point t3 exhibited a slight downwards trend as the stimulus concentration increased, none of these ratings was significantly different than the other odor intensity ratings for point t3; thus, the decline in intensity from point t1to point t3could simply be due to the effects of adaptation. For t1, there was clearly no trend (beta = 0.025, standard error 0.076,P = 0.773). For t3, the trend was not significant at alpha = 0.05 (beta = 0.275, standard error 0.074,P = 0.065). Thus, the adaptation to the pedestal is not significantly affected by the presence of the stimulant.
Fig. 10 Shows the perceived intensity of the pedestal at t1 (see Figure6) before the hexanal eluted from the GC and the perceived intensity of the pedestal at t3 after the hexanal eluted (n=108). As expected self-adaptation causes a decreased in perceived intensity of the pedestal but sniffing hexanal does not increase the adaptation. It appears that smelling hexanal eluting from the GC does not significant affect the intensity of the pedestal but it does change its quality
Discussion
The GC-PO prototype described here was designed to study empirical questions about the adaptation, masking, and perception of specific components in mixtures; it is expected that investigating these questions will provide answers to more theoretical questions regarding the nature of odorant mixture processing, e.g., whether that process is elemental or configural (Laing and Wilcox1983; Goyert et al.2007), (Zou and Buck 2006),(Gottfried et al. 2006), at the level of the olfactory cortex, and whether it is combinatorial or compet-itive (Jinks et al.1998),(Kay et al.2005) at the level of the ORs. The design of the GC-PO allows the creation of a stable pedestal on to which can be placed a precise odor event (the stimulus) as it elutes from a gas chromatograph. In addition, the preliminary studies undertaken here indicate that a subject can accurately identify the odor quality of the pedestal prior to the elution of the stimulus, and that he or she can usually identify the superimposed stimulus as a distinct odor event. These elements are the crucial elements needed for continued study using this GC-PO design. Studies can be performed by either allowing a subject to completely adapt to the pedestal before he or she smells the stimulus, or by only allowing the subject to begin smelling the pedestal a few seconds before the stimulus elutes. This second scenario allows the study of sudden and sequential odor events in a precise manner.
Issues surrounding these preliminary results demonstrate the need for developing appropriate standards for quality and intensity, so that the effects of adaptation and mixture suppression can be accurately quantified (Cell 2005). Additionally, appropriate protocols must be developed to quantify the phenomena revealed by the GC-PO, including the development of specialized GC-PO software. Beyond the obvious dilution analysis of the eluted odorants with and without a pedestal, the isolation of the elemental and configural behavior of the eluting compounds needs to be achieved with appropriate experimental designs. Using pedestals composed of multiple odorants would also provide insights into the perception of real food odors and the processing of complex mixtures, which could have behavioral and ecological significance.
References
Acree TE, Butts RM, Nelson RR, Lee CY (1976) Sniffer to determine the odor of gas chromatographic effluents. Anal Chem 48:1821–1822 Araneda RC, Kini AD, Firestein S (2000) The molecular receptive
range of an odorant receptor. Nat Neurosci 3:1248–1255 Burseg K, de Jong C (2008) The Olfactoscan®: in-vivo screening for
off-flavour solutions. Weurman, Interlaken
Cain WS, Drexler M (1971) Scope and evaluation of odor counteraction. Ann N Y Acad Sci 237:427–439
Cain WS, Polak EH (1992) Olfactory adapation as an aspect of odor similarity. Chem Senses 17:481–491
Cell C (2005) Scent through the looking glass. In: Kraft P, Swift KAD (eds) Perspectives in flavor and fragrance research. Wiley, Hoboken, pp 67–88
Dravnieks A (1975) Instrumental aspects of olfactometry. In: Moulton DG, Turk A, Johnston JWJ (eds) Methods in olfactory research. Academic, New York, pp 1–61
Gottfried JA, Winston JS, Dolan RJ (2006) Dissociable codes of odor quality and odorant structure in human piriform cortex. Neuron 49:467–479
Goyert HF, Frank ME, Gent JF, Hettinger TP (2007) Characteristique component odors emerge from mixtures after selective adapta-tion. Brain Res Bull 72:1–9
Graham NVS (1989) Visual pattern analyzers. Oxford University Press, New York
Hattori S, Takagaki H, Fujimori T (2003) Evaluation of Japanese green tea extract using GC/O with original aroma simultaneously input to the sniffng port method (OASIS). Food Sci Technol Res 9:350–352 Jinks A, Laing DG, Hutchinson IAN, Oram N (1998) Temporal processing of odor mixtures reveals that identification of components takes precedence over temporal information in olfactory memory. Ann N Y Acad Sci 855:834–836
Kay LM, Crk T, Thorngate J (2005) A redefinition of odor mixture quality. Behav Neurosci 119:726–733
Kittel KM, Kurtz AJ, Barnard J, Acree TE (2008) Free-choice profiling of OR-I7 agonists and homologues using GCO. Chemosens Percept 1:235–241
Laing DG, Wilcox ME (1983) Perception of components in binary odor mixtures. Chem Senses 7:249–264
Livermore A, Laing DG (1998) The influence of odor type on the discrimination and identification of odorants in multicomponent odor mixtures. Physiol Behav 65:311–320
Tanner WP (1961) Psychological implications of psychophysical data. Ann N Y Acad Sci 89:752–765
Wilson DA (1998) Synaptic correlates of odor habituation in the rata anterior piriform cortex. J Neurophysiol (Bethesda) 80:998–1001 Zhao H, Ivic L (1998) Functional expression of a mammalian odorant
receptor. Science 279:237–242
Zou Z, Buck LB (2006) Combinatorial effects of odorant mixes in olfactory cortex. Science 311:1477–1481