Characterization of the Extracellular Matrix of
Normal and Diseased Tissues Using Proteomics
The MIT Faculty has made this article openly available. Please sharehow this access benefits you. Your story matters.
Citation Naba, Alexandra et al. “Characterization of the Extracellular Matrix of Normal and Diseased Tissues Using Proteomics.” Journal of Proteome Research 16, 8 (July 2017): 3083–3091 © 2017 American Chemical Society
As Published https://doi.org/10.1021/acs.jproteome.7b00191
Publisher American Chemical Society (ACS)
Version Author's final manuscript
Citable link http://hdl.handle.net/1721.1/117215
Terms of Use Article is made available in accordance with the publisher's policy and may be subject to US copyright law. Please refer to the publisher's site for terms of use.
CHARACTERIZATION OF THE EXTRACELLULAR MATRIX OF NORMAL AND DISEASED TISSUES USING PROTEOMICS
Alexandra Naba1¶#*
, Oliver M. T. Pearce2#*
, Amanda Del Rosario3
, Duanduan Ma4 , Huiming Ding4 , Vinothini Rajeeve2 , Pedro R. Cutillas2 , Frances R. Balkwill2+ , Richard O. Hynes1, 5+ 1
Koch Institute for Integrative Cancer Research, Massachusetts Institute of Technology; Cambridge, MA, U.S.A
2
Barts Cancer Institute, Queen Mary University of London, London, UK 3
Proteomics Core Facility, Koch Institute for Integrative Cancer Research, Massachusetts Institute of Technology; Cambridge, MA, U.S.A
4 Bioinformatics and Computing Facility, Koch Institute for Integrative Cancer Research, Massachusetts Institute of Technology; Cambridge, MA, U.S.A
5
Howard Hughes Medical Institute, Massachusetts Institute of Technology; Cambridge, MA, U.S.A 
Present address: Department of Physiology and Biophysics, University of Illinois at Chicago, Chicago, IL, U.S.A
#
These authors contributed equally to this work. +
These authors share senior authorship of the paper.
* Corresponding authors: Alexandra Naba [email protected] Phone: +1 312-355-5417 Oliver Pearce [email protected] Phone: +44 (0) 207882 3591
ABSTRACT
The extracellular matrix (ECM) is a complex meshwork of insoluble fibrillar proteins and signaling factors interacting together to provide architectural and instructional cues to the surrounding cells. Alterations in ECM organization or composition and excessive ECM deposition have been observed in diseases such as fibrosis, cardio-vascular diseases, and cancer. We provide here optimized protocols to solubilize ECM proteins from normal or tumor tissues, digest the proteins into peptides, analyze ECM peptides by mass spectrometry, and interpret the mass spectrometric data. In addition, we present here two novel R-script-based web tools allowing rapid annotation and relative quantification of ECM proteins, peptides, and intensity/abundance in mass spectrometric data output files. We illustrate this protocol with ECMs obtained from two pairs of tissues which differ in ECM content and cellularity; triple-negative breast cancer and adjacent mammary tissue, and omental metastasis from high-grade serous ovarian cancer and normal omentum. The complete proteomics dataset generated in this study has been deposited to the public repository ProteomeXchange with the dataset identifier: PXD005554.
KEYWORDS: Extracellular Matrix, Matrisome, Collagens, Microenvironment, Hydroxylation,
INTRODUCTION
The extracellular matrix (ECM), a complex and dynamic meshwork of cross-linked proteins, is a fundamental component of multicellular organisms 1
. The ECM provides architectural, mechanical, and biochemical signals interpreted by cell-surface receptors, and orchestrates cellular processes such as adhesion, migration, proliferation, survival, and differentiation 2,3
. Alterations in the composition and organization of the ECM cause or accompany the development of diseases including fibroses, cardio-vascular diseases, and cancers 4–6.
Because of its complexity and insolubility, the ECM has been difficult to analyze biochemically and, until recently, it was not possible to obtain a detailed understanding of its composition 7
. We have previously developed a proteomic pipeline to characterize the composition of in vivo ECMs and have shown that any given tissue or tumor includes well over 100 ECM and ECM-associated proteins and that characteristic differences can be detected between different tissues or tumors 8–10
. One critical step in this proteomic approach was the development of a method to enrich ECM proteins from tissues and tumors. To do so, we and others devised decellularization methods that deplete intracellular proteins and permit the enrichment of ECM proteins 8,11–20
. A second critical step of the approach was the identification and annotation of the ECM components, or ‘matrisome’, in large proteomic datasets. To this end, we devised a computational approach and defined the in silico matrisome as the ensemble of genes encoding core ECM proteins (ECM glycoproteins, collagens, and proteoglycans) and ECM-associated proteins (these are proteins structurally resembling ECM proteins, ECM remodeling enzymes and secreted factors including growth factors) 8,21
.
As the details of the methods applied in the various analyses of ECM proteins using mass-spectrometry-based proteomics in our laboratories and others vary somewhat, we have now explored the impact of variations in the protocols. We provide here updated protocols for 1) digestion of ECM proteins into peptides, 2) analysis of ECM peptides by mass spectrometry, and 3) interpretation of mass spectrometric data. We illustrate the protocols with results obtained on the ECM from two sets of tissues that differ significantly in their ECM content and cellularity: human triple-negative breast cancer samples and adjacent breast tissue, and omental metastases from high-grade serous ovarian cancer (HGSOC) and normal omentum (Figure 1A). The optimized protocols presented here make the
comprehensive characterization of the composition of the ECM accessible to a broad range of scientists and should help enhance the identification of disease biomarkers and novel therapeutic targets.
MATERIALS AND METHODS
Samples
Patient samples were kindly donated by women with high-grade serous ovarian cancer (HGSOC; n=2) or triple-negative breast cancer (TNBC; n=2) undergoing surgery at Barts Health NHS Trust between 2010 and 2014. Tissues deemed by a pathologist to be surplus to diagnostic and therapeutic requirements were collected together with associated clinical data under the terms of the Barts Gynae Tissue Bank (HTA licence number 12199. REC no: 10/H0304/14), and Barts Breast Cancer Tissue Bank (HTA license number 12199. REC no:15/EE/0192). In both cases TNBC and HGSOC samples are described as containing tumor cells and desmoplasia, whilst normal or adjacent samples are described as having no obvious tumor cell infiltration or desmoplasia (Supplementary Table S1A). Masson's trichrome staining was performed according to standard procedures to evaluate the ECM content and cellularity of all four tissue types.
Enrichment for ECM components
ECM proteins were enriched from frozen whole tissue or tumor sections (20 x 30 μm sections, approximately 40-50 mg of tissue) as previously described 15
. In brief, tissue sections were resuspended in the cytosolic ("C") buffer of the CNMCS compartmental protein extraction kit (Millipore) and disrupted by vortexing. The samples were then incubated in a series of buffers to remove sequentially nuclear proteins (buffer "N"), membrane proteins (buffer "M"), and cytoskeletal proteins (buffer "CS"), according to the manufacturer's instructions and our previous protocol 15
. The remaining insoluble pellet is enriched for ECM proteins. Note that the subsequent steps can also be conducted on ECM-enriched samples prepared according to other methods 11-20
.
ECM protein solubilization
ECM-enriched samples were solubilised in 8M urea, 20mM HEPES containing Na3VO4 (100mM), NaF (0.5M), β-Glycerol Phosphate (1M), Na2H2P2O7 (0.25M). Samples were vortexed for 30 seconds and held on ice prior to sonication at 50 % intensity, 3 times for 15 seconds, on ice. These resuspended and partially solubilized ECM-enriched samples were either directly digested into peptides as described below ("crude" ECM samples), or were centrifuged at 20,000 g for 10 min at 5o
C, and the supernatant recovered to protein low-bind tubes. This fraction will further be referred to as the urea-soluble
fraction. Protein concentration of the urea-soluble fraction was estimated using BCA assay and 80 μg of protein was digested into peptides as described below. The post-centrifugation urea-insoluble pellet was resuspended in 2M urea and proteins were digested as described below.
ECM protein digestion into peptides
Disulphide bonds were reduced by adding 5mM dithiothreitol to the samples for a 1-hour incubation under agitation at room temperature. Free cysteines were alkylated by adding iodoacetamide at a final concentration of 8.3mM to the samples for a 1-hour incubation under agitation at room temperature in the dark. After diluting to 2M urea, 20mM HEPES, samples were deglycosylated with 1500 units of PNGaseF (New England BioLabs, Ipswich, MA) by incubation at 37°
C for 2 hours under agitation. Samples were pre-digested with 1.6 μg of Lys-C (Pierce) and incubated at 37°
C for 2 hours under agitation, and digested with bead-immobilized trypsin (40 μL of beads per 250 μg of protein; Pierce) for 16 h at 37o
C under agitation. Samples were acidified with trifluoroacetic acid (TFA, 1% v/v), centrifuged at 2,000 g for 5 minutes at 5o
C. Supernatants were transferred to clean microcentrifuge tubes on ice. Glygen TopTips were equilibrated with 100 % LC-MS-grade acetonitrile (ACN) and then washed with 99 % H2O (+ 1 % ACN, 0.1 % TFA) prior to loading the peptide samples. Samples were washed with 99% H2O (+ 1 % ACN, 0.1 % TFA), and desalted peptides eluted with 70/30 ACN/H2O + 0.1 % TFA. Desalted peptides were dried and stored at -20o
C.
Liquid Chromatography-Tandem Mass Spectrometry (LC-MS/MS)
Equal volumes of each sample, corresponding to approximately 100ng of material, were initially analyzed via LC-MS/MS, and the total numbers of peptides identified and the sum of the intensities of the precursor ions was used as a normalization metric to determine equivalent peptide amounts. Peptides were separated by reversed-phase HPLC using an EASY-nLC1000 (Thermo Scientific) using a pre-column (made in house, 6 cm of 10 µm C18) and a self-pack 5 µm tip analytical column (12 cm of 5 µm C18, New Objective) over a 140-minute gradient before nanoelectrospray using a QExactive mass spectrometer (Thermo). Solvent A was 0.1% formic acid and solvent B was 80% MeCN/0.1% formic acid. The gradient conditions were 0-10% B (0-5 min), 10-30% B (5-105 min), 30-40% B (105-119 min), 40-60% B ((105-119-124 min), 60-100% B (124-126 min), 100% B (126-136 min), 100-0% B (136-138 min), 0% B (138-140 min). The mass spectrometer was operated in a data-dependent mode. The parameters for the full MS scan were: resolution of 70,000 across 350-2000 m/z, AGC 3e6
maximum IT 50 ms. The full MS scan was followed by MS/MS for the top 10 precursor ions in each cycle with a normal collision energy of 28 and dynamic exclusion of 30 seconds.
Off-line fractionation of peptides by reversed-phase chromatography at high pH
Equivalent peptide amounts were fractionated via high-pH reversed-phase HPLC. Peptides were resuspended in 50uL buffer A (10mM NH4HCO3, pH8) and separated on a 4.6mm x 250 mm 300Extend-C18, 5um column (Agilent) using an 80-minute gradient from 1% to 100% buffer B (90% MeCN, 10mM NH4HCO3, pH8) at a flow rate of 1ml/min. Fractions were collected over 75 minutes at 1-minute intervals beginning at 5 minutes after the start of the gradient. The fractions were concatenated into 15 fractions non-contiguously (1+16+31+46+61, 2+17+32+47+62, etc.) 22
. The fractions were brought to near dryness in a speed-vac (Thermo Scientific). Each fraction was resuspended in 80uL 0.1% formic acid and 4uL was analyzed via LC-MS/MS as described above using the same 140-minute gradient.
Protein identification
Raw mass spectral data files (.raw) were searched using Proteome Discoverer (Thermo Scientific) and Mascot version 2.4.1 (Matrix Science) using the SwissProt Homo sapiens database containing 20199 entries. Mascot search parameters were: 10 ppm mass tolerance for precursor ions; 15 mmu for fragment-ion mass tolerance; 2 missed cleavages of trypsin; fixed modification was carbamidomethylation of cysteine; variable modifications were oxidized methionine, deamidation of asparagine, pyro-glutamic acid modification at N-terminal glutamine and hydroxylation of lysine and proline (see Results section). Only peptides with a Mascot score greater than or equal to 25 and an isolation interference less than or equal to 30 were included in the data analysis. The average false discovery rate was 0.0074 (ranging from 0.0032 - 0.0144). For each protein, total precursor ion intensity (further referred to as "peptide intensity") was calculated as the sum of MS1-precursor-ion-peak areas for all identified peptides of the given protein. Confidently identified proteins were further annotated as being part of the extracellular matrix as previously defined 8,21
and using the novel tool Matrisome Annotator presented in this publication (see Results section).
The raw mass spectrometry data have been deposited to the ProteomeXchange23
via the PRIDE partner repository 24
[Note to the editor and reviewers: The raw mass spectrometry data will become publicly available upon acceptance of the paper. During the evaluation of the manuscript, the reviewers can access the raw mass spectrometry by login to the PRIDE website using the following credentials: username: [email protected] and password: nOivfFjG.].
RESULTS
Optimization of methods to solubilize and digest ECM proteins
We initially devised a method that consisted of enrichment of tissue samples for ECM proteins, partial solubilization in 8M urea and digestion of this "crude" ECM extract into peptides. Using this protocol, the most abundant proteins identified were fibrillar collagens 8
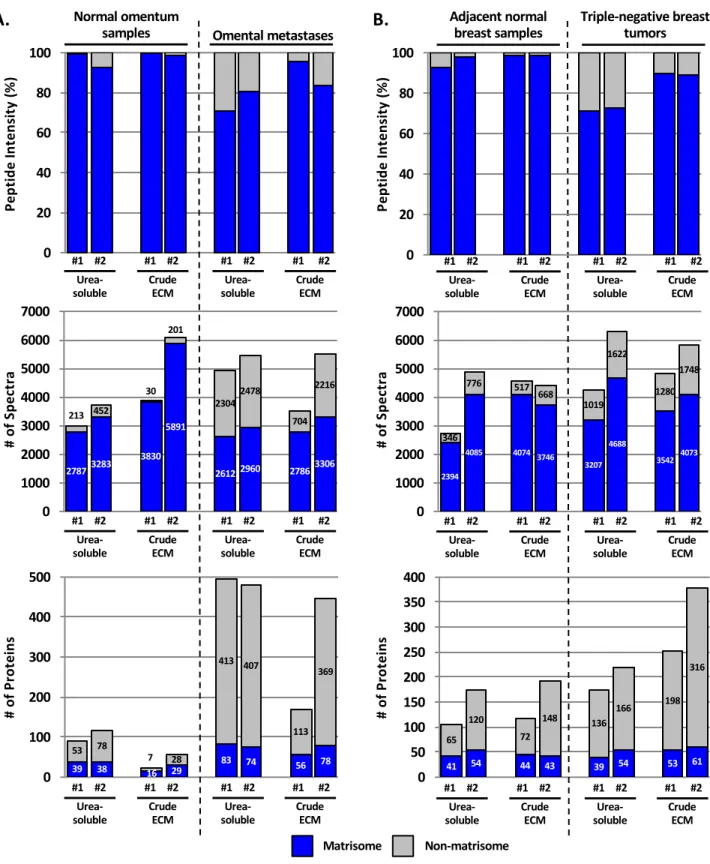
. We hypothesized that the abundance of fibrillar collagens could prevent the identification of other ECM or ECM-associated proteins present in lower abundance. To test this, we compared the original method with a method consisting of digesting only the urea-soluble fraction of ECM-enriched samples (Figure 1B). We observed that for the four tissues analyzed (breast cancer and adjacent breast tissue samples, and omentum and ovarian-cancer-derived omental metastasis samples; n=2 for each sample type), the abundance of ECM peptides (Figures 2A and B, upper panels) and the numbers of identified spectra (Figures 2A and B, middle panels) were somewhat greater in most of the crude ECM preparations as compared with the corresponding urea-soluble extracts (Supplementary Table S1B and 1C). However, the numbers of ECM proteins confidently identified were mostly similar (Figures 2A and B, lower panels, and Supplementary Table S1B and 1C), although urea-soluble preparations of normal and diseased omentum generally gave a higher number of ECM proteins compared with crude ECM preparations. This might be explained by the low content of fibrillar ECM in this tissue (Figure 1A).
We next sought to analyze the composition of the urea-insoluble protein fraction (Supplementary Figure S1A and Supplementary Table S1B) and observed that only four proteins were detected solely in the pellet and not in either urea-soluble or crude ECM preparations (namely, AMBP and LMAN1L, which is in fact a transmembrane protein, in TNBC-adjacent breast tissue and COL6A5 and MFAP2 in TNBC samples) (Supplementary Figure S1B and Supplementary Table S1B). However, the total number of matrisome proteins detected in the pellet was less than either the crude or urea-soluble preparations. It is possible that with more extensive analysis, including peptide-fractionation (see below), these proteins would also be detected in the urea-soluble and/or crude ECM preparations. Therefore, in general, both crude and urea- soluble extractions result in similar numbers of ECM proteins detected, although one method may be superior to the other depending on the tissue and in particular, depending on the collagen content of the tissue.
Optimization of methods to fractionate ECM-protein-derived peptides
We have previously reported that off-line fractionation of peptide mixtures by off-gel electrophoresis increased by a factor of 3 the number of matrisome peptides confidently identified, which resulted in the identification of twice as many core ECM components and over 10 times the number of matrisome-associated proteins 8
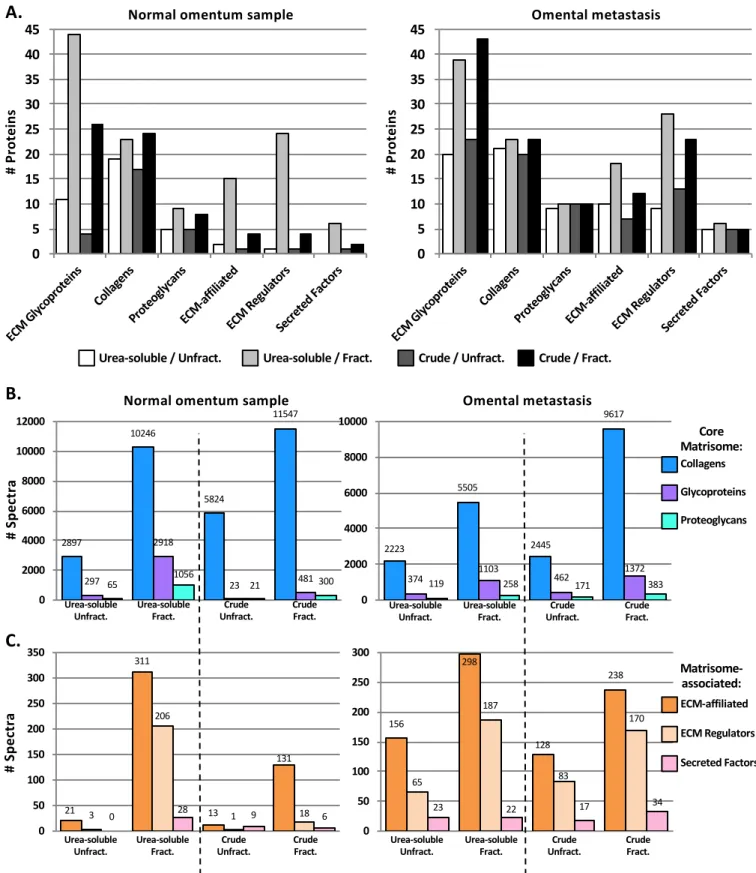
. Off-gel electrophoresis is a lengthy process, and is now being replaced in proteomic pipelines by fractionation using high-pH liquid chromatography (also termed basic-reversed-phase or bRP-LC), orthogonal to the LC separation in-line with the tandem mass spectrometry. We sought to determine whether fractionation by bRP-LC was beneficial to identify otherwise undetected ECM proteins from both urea-soluble and crude ECM preparations. Independent of the tissue type or the method employed to digest ECM-enriched samples into peptides, fractionation prior to LC-MS/MS resulted in the identification of a greater number of spectra and proteins (Figure 3 and Supplementary Table S1D). In the case of omental samples, the urea-soluble preparation, when coupled with bRP-LC fractionation, consistently resulted in higher numbers of ECM proteins detected when compared to fractionated crude preparations (Figure 3A). This is presumably a consequence of the reduced amount of collagens in the urea-soluble fraction (Supplementary Table S1D). Furthermore, peptide fractionation was particularly beneficial to identify lower-abundance matrisome-associated proteins such as ECM-affiliated proteins and ECM regulators (including ECM cross-linking enzymes or proteases) (Figure 3B and 3C and Supplementary Table S1D).
Importance of allowing for proline hydoxylations for in silico protein identification
Peptide and subsequent protein identification from tandem mass spectrometry data rely on the comparison of experimental spectral mass values with databases containing theoretical spectral data. It is important that search algorithms include post-translational modifications (PTMs) that alter the mass of amino acids. Hydroxylation of prolines and lysines are obligate PTMs of triple-helical collagens (prolines represent 17% of amino acids in collagen I) and other ECM proteins 25–27
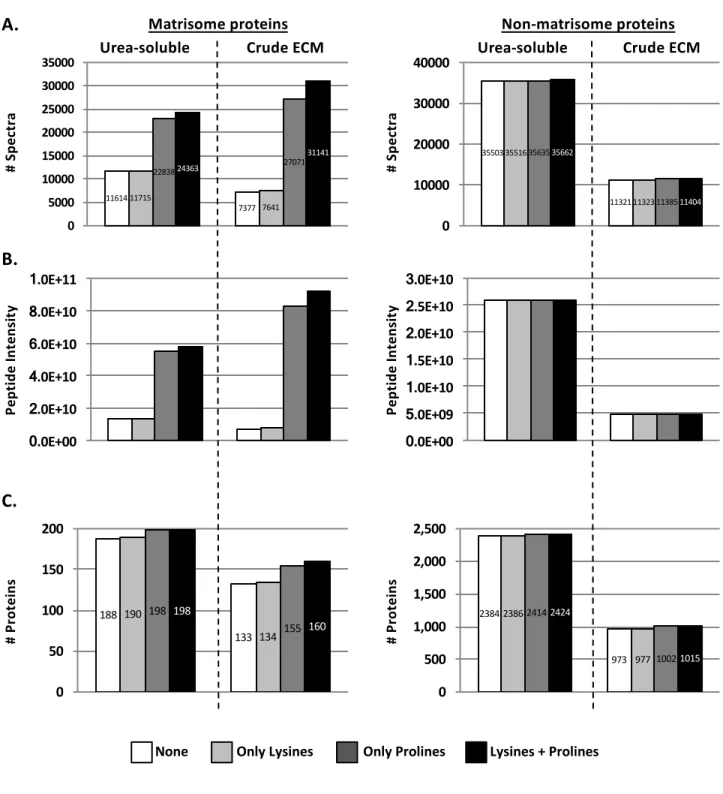
. However, these PTMs are not routinely included when interrogating databases for protein identification because they increase the search time. To examine the significance of including the dynamic modifications of lysine and proline hydoxylation, we selected a dataset and conducted a database search in four different ways: without allowing for lysine or proline hydroxylation; allowing only lysine hydroxylation; allowing only proline hydroxylation, or allowing both lysine and proline hydroxylation. Allowing for proline hydroxylations (and to a lesser extent for lysine hydroxylations) led to a significant increase of
the number of identified spectra of matrisome proteins by factor of 2 (Figure 4A, left panels), as also previously reported by Barallobre-Barreiro and collaborators28
, and thus to a more accurate estimation of the abundance of matrisome proteins (Figure 4B, left panel). Allowing these PTMs also allowed the identification of several additional ECM proteins (Figure 4C, left panel, and Supplementary Table S1E and 1F). Importantly, allowing for these two PTMs was equally beneficial to the analysis of urea-soluble and crude ECM extracts. Of note, these two PTMs, did not increase significantly the number of spectra or unique peptides of non-matrisome proteins (Figure 4A-C, right panels). Therefore, allowing for proline and lysine hydroxlations is beneficial specifically for the detection of ECM proteins and we recommend they be included.
Scripts to annotate matrisome proteins and calculate mass-spectrometric metrics
In order to facilitate the annotations of matrisome proteins in large datasets, we developed a script called "Matrisome Annotator". Providing that a dataset contains Entrez or HUGO gene symbols for each entry, the script will return an output file in which each entry will be annotated as being part of the matrisome or not, and will be tagged with matrisome division (core matrisome vs. matrisome-associated) and category (ECM glycoproteins, collagens, proteoglycans, ECM-affiliated proteins, ECM regulators or secreted factors). "Matrisome Annotator" can be used to annotate not only proteomic data but any kind of list of genes/proteins. We also developed a second script, called "Matrisome Analyzer", that calculates the proportion of ECM content in terms of number of spectra, number of unique peptides, number of proteins and peptide intensity (i.e. protein abundance) in proteomics dataset. This script allows rapid evaluation of the abundance of matrisome vs. non-matrisome proteins in any given dataset input as a delimited text file, and exports the calculation in tables and graphs. Both scripts are available as webtools and to download under the Analytical Tools section of the Matrisome Project website (http://matrisome.org/).
[Note to the editor and reviewers: the "Analytical Tools" section of the website is password protected during the evaluation of the manuscript and will be made publicly available upon acceptance of the manuscript. To access the pages, log in to the website using the login button located on the upper right corner of the website with the following credentials: login: reviewer; password: matrisome. The Analytical tools" section will appear on the left menu with two sub-pages "Matrisome Annotator" and "Matrisome Analyzer". We have provided detailed description of the scripts and user manual on the dedicated web pages].
DISCUSSION
We provide here a detailed description of mass-spectrometry-based methods allowing in-depth and comprehensive characterization of the composition of ECM of normal and diseased tissues. The major advantage of these methods is that each step, from the solubilization of ECM proteins to the interpretation of mass spectrometric data, has been optimized to take into account biochemical characteristics of ECM and ECM-associated proteins. For example, we recommend allowing for proline and lysine hydroxylation when searching databases, as this significantly increases ECM protein detection and identification. The preferred method to solubilize ECM-enriched protein samples for digestion to peptides depends on the tissue and its ECM content and, in some cases, restricting the analysis to urea-soluble ECM proteins, permits detection of additional proteins. This is because significant proportions of the collagens remain insoluble. Few proteins are missed by ignoring the urea-insoluble fraction, although of course, the relative amounts of proteins detected are altered, which compromises semi-quantitative conclusions. Furthermore, inclusion of a pre-fractionation step by bRP-LC chromatography provides an alternative means, allowing detection of additional proteins. It is worth noting that high pH reversed-phase peptide fractionation can be achieved using commercially available spin columns requiring only a bench centrifuge. In addition, any number of fractions can be generated depending on the complexity of the samples and the desired coverage.
Although not discussed in the manuscript, these methods can be coupled to label-based quantitative proteomics 29
, which allows quantification of the abundance of proteins and peptides in different samples, and also allows multiplexing, thus reducing mass-spectrometer time.
CONCLUSION
Alterations in the composition and organization of the ECM cause or accompany the development of diseases such as fibrosis, cardio-vascular diseases, musculo-skeletal diseases, and cancers.
The application of the proposed methods to profile the composition of the ECM of, for example, pairs of normal vs. diseased tissues, treated vs. untreated tissues, or poorly vs. highly metastatic tumors, or cell or organoid cultures can lead to the identification of novel ECM proteins that could serve as prognostic or diagnostic biomarkers or novel therapeutic targets.
ACKNOWLEDGMENTS
This work was supported by the National Cancer Institute – Tumor Microenvironment Network (U54 CA126515/CA163109), DoD BRCP Innovator Award (BC131410) to ROH, the Howard Hughes Medical Institute of which ROH is investigator, and in part by the Cancer Center Support (Core) Grant P30-CA14051 from the National Cancer Institute. OP and FB were funded by the European Research Council (ERC322566) and Cancer Research UK (A16354).
The authors would like to thank Prof. Louise Jones and Dr. Sally Dreger (Center for Tumor Biology, Barts Cancer Institute) for providing triple-negative breast cancer tissues and Dr. Michelle Lockley (Center for Molecular Oncology, Barts Cancer Institute) for providing HGSOC samples used in the study, Dr. Sam Nichols (Center for Cancer & Inflammation, Barts Cancer Institute), and Karl Clauser (Proteomic Platform, Broad Institute) for helpful discussions and suggestions.
COMPETING FINANCIAL INTERESTS
The authors declare that they have no competing financial interests.
AUTHOR CONTRIBUTIONS
Conception and design: AN, OP, AdR, FB, ROH Acquisition of data: AN, OP, AdR, PRC
Analysis and interpretation of data: AN, OP, AdR Development of analytical tools: AN, DM, HD
Contributed unpublished, essential data, or reagents: VR Writing and revising the manuscript: AN, OP, AdR, FB, ROH
REFERENCES
(1) Hynes, R. O.; Yamada, K. M. Extracellular Matrix Biology., Cold Spring Harbor Perspectives in Biology.; Cold Spring Harbor Laboratory Press: Cold Spring Harbor, NY, 2012.
(2) Rozario, T.; DeSimone, D. W. The extracellular matrix In development and morphogenesis: a dynamic view. Dev. Biol. 2010, 341 (1), 126–140.
(3) Bonnans, C.; Chou, J.; Werb, Z. Remodelling the extracellular matrix in development and disease. Nat. Rev. Mol. Cell Biol. 2014, 15 (12), 786–801.
(4) Pickup, M. W.; Mouw, J. K.; Weaver, V. M. The extracellular matrix modulates the hallmarks of cancer. EMBO Rep. 2014, 15 (12), 1243–1253.
(5) Cox, T. R.; Erler, J. T. Remodeling and homeostasis of the extracellular matrix: implications for fibrotic diseases and cancer. Dis. Model. Mech. 2011, 4 (2), 165–178.
(6) Bergmeier, W.; Hynes, R. O. Extracellular Matrix Proteins in Hemostasis and Thrombosis. Cold Spring Harb. Perspect. Biol. 2012, 4 (2), a005132–a005132.
(7) Wilson, R. The extracellular matrix: an underexplored but important proteome. Expert Rev. Proteomics 2010, 7 (6), 803–806.
(8) Naba, A.; Clauser, K. R.; Hoersch, S.; Liu, H.; Carr, S. A.; Hynes, R. O. The matrisome: in silico definition and in vivo characterization by proteomics of normal and tumor extracellular matrices. Mol. Cell. Proteomics 2012, 11 (4), M111.014647.
(9) Naba, A.; Clauser, K. R.; Lamar, J. M.; Carr, S. A.; Hynes, R. O. Extracellular matrix signatures of human mammary carcinoma identify novel metastasis promoters. eLife 2014, 3:e01308.
(10) Naba, A.; Clauser, K. R.; Whittaker, C. A.; Carr, S. A.; Tanabe, K. K.; Hynes, R. O. Extracellular matrix signatures of human primary metastatic colon cancers and their metastases to liver. BMC Cancer 2014, 14 (1), 518.
(11) Barallobre-Barreiro, J.; Didangelos, A.; Yin, X.; Doménech, N.; Mayr, M. A Sequential Extraction Methodology for Cardiac Extracellular Matrix Prior to Proteomics Analysis. In Heart Proteomics; Vivanco, F., Ed.; Humana Press: Totowa, NJ, 2013; Vol. 1005, pp 215–223.
(12) Byron, A.; Humphries, J. D.; Humphries, M. J. Defining the extracellular matrix using proteomics. Int. J. Exp. Pathol. 2013, 94 (2), 75–92.
(13) Crapo, P. M.; Gilbert, T. W.; Badylak, S. F. An overview of tissue and whole organ decellularization processes. Biomaterials 2011, 32 (12), 3233–3243.
(14) Krasny, L.; Paul, A.; Wai, P.; Howard, B. A.; Natrajan, R. C.; Huang, P. H. Comparative proteomic assessment of matrisome enrichment methodologies. Biochem. J. 2016, 473 (21), 3979–3995.
(15) Naba, A.; Clauser, K. R.; Hynes, R. O. Enrichment of extracellular matrix proteins from tissues and digestion into peptides for mass spectrometry analysis. J. Vis. Exp. 2015, 101, e53057. (16) Schiller, H. B.; Fernandez, I. E.; Burgstaller, G.; Schaab, C.; Scheltema, R. A.; Schwarzmayr, T.;
Strom, T. M.; Eickelberg, O.; Mann, M. Time- and compartment-resolved proteome profiling of the extracellular niche in lung injury and repair. Mol. Syst. Biol. 2015, 11 (7), 819.
(17) Sato, N.; Taniguchi, T.; Goda, Y.; Kosaka, H.; Higashino, K.; Sakai, T.; Katoh, S.; Yasui, N.; Sairyo, K.; Taniguchi, H. Proteomic Analysis of Human Tendon and Ligament: Solubilization and Analysis of Insoluble Extracellular Matrix in Connective Tissues. J. Proteome Res. 2016, 15 (12), 4709–4721.
(18) Randles, M. J.; Humphries, M. J.; Lennon, R. Proteomic definitions of basement membrane composition in health and disease. Matrix Biol. 2017, 57–58, 12–28.
(19) de Castro Brás, L. E.; Ramirez, T. A.; DeLeon-Pennell, K. Y.; Chiao, Y. A.; Ma, Y.; Dai, Q.; Halade, G. V.; Hakala, K.; Weintraub, S. T.; Lindsey, M. L. Texas 3-Step decellularization protocol: Looking at the cardiac extracellular matrix. J. Proteomics 2013, 86.
(20) Hellewell, A. L.; Rosini, S.; Adams, J. C. A Rapid, Scalable Method for the Isolation, Functional Study, and Analysis of Cell-derived Extracellular Matrix. JoVE J. Vis. Exp. 2017, No. 119, e55051–e55051.
(21) Naba, A.; Clauser, K. R.; Ding, H.; Whittaker, C. A.; Carr, S. A.; Hynes, R. O. The extracellular matrix: Tools and insights for the “omics” era. Matrix Biol. 2016, 49, 10–24.
(22) Yang, F.; Shen, Y.; Camp, D. G.; Smith, R. D. High pH reversed-phase chromatography with fraction concatenation as an alternative to strong-cation exchange chromatography for two-dimensional proteomic analysis. Expert Rev. Proteomics 2012, 9 (2), 129–134.
(23) Vizcaíno, J. A.; Deutsch, E. W.; Wang, R.; Csordas, A.; Reisinger, F.; Ríos, D.; Dianes, J. A.; Sun, Z.; Farrah, T.; Bandeira, N.; et al. ProteomeXchange provides globally co-ordinated proteomics data submission and dissemination. Nat. Biotechnol. 2014, 32 (3), 223–226.
(24) Vizcaíno, J. A.; Csordas, A.; del-Toro, N.; Dianes, J. A.; Griss, J.; Lavidas, I.; Mayer, G.; Perez-Riverol, Y.; Reisinger, F.; Ternent, T.; et al. 2016 update of the PRIDE database and its related tools. Nucleic Acids Res. 2016, 44 (Database issue), D447–D456.
(25) Gjaltema, R. A. F.; Bank, R. A. Molecular insights into prolyl and lysyl hydroxylation of fibrillar collagens in health and disease. Crit. Rev. Biochem. Mol. Biol. 2016, 1–22.
(26) Myllyharju, J. Intracellular Post-Translational Modifications of Collagens. In Collagen; Brinckmann, J., Notbohm, H., Müller, P. K., Eds.; Topics in Current Chemistry; Springer Berlin Heidelberg, 2005; pp 115–147.
(27) Yamauchi, M.; Sricholpech, M. Lysine post-translational modifications of collagen. Essays Biochem. 2012, 52, 113–133.
(28) Barallobre-Barreiro, J.; Oklu, R.; Lynch, M.; Fava, M.; Baig, F.; Yin, X.; Barwari, T.; Potier, D. N.; Albadawi, H.; Jahangiri, M.; et al. Extracellular matrix remodelling in response to venous hypertension: proteomics of human varicose veins. Cardiovasc. Res. 2016, 110 (3), 419–430. (29) Naba, A.; Clauser, K. R.; Mani, D. R.; Carr, S. A.; Hynes, R. O. Quantitative proteomic profiling
of the extracellular matrix of pancreatic islets during the angiogenic switch and insulinoma progression. Sci. Rep. 2017, 7, 40495.
SUPPORTING INFORMATION
• Supplementary Table S1: Complete mass spectrometry dataset.
A. Masson’s Trichrome staining of omental and breast tissues profiled Fresh, flash-frozen or OCT-embedded tissue Tissue decellularization / Enrichment of ECM proteins ECM-enriched protein samples Pellet: urea-insoluble proteins Crude ECM: urea-soluble + insoluble proteins Partial solubilization in 8M urea Disulphide-bond reduction and alkylation Deglycosylation Digestion (Lys-C, Trypsin) Peptide fractionation Reversed-phase chromatography at high pH LC-MS/MS Protein identification Database search, post-translational modifications Supernatant: urea-soluble proteins Centrifugation B. Experimental pipeline 1mm Omental metastasis
from HGS ovarian cancer adjacent to TNBCBreast tissue Triple-negative breast cancer Normal omentum
0 20 40 60 80 100 Pe pt id e In te ns it y (% ) Normal omentum
samples Omental metastases
#1 #2 #1 #2 #1 #2 #1 #2
Urea-soluble Crude ECM solubleUrea- Crude ECM
39 38 16 29 83 74 56 78 53 78 7 28 413 407 113 369 0 100 200 300 400 500 27873283 3830 5891 2612 2960 27863306 213 452 30 201 23042478 704 2216 0 1000 2000 3000 4000 5000 6000 7000 #1 #2 #1 #2 #1 #2 #1 #2
Urea-soluble Crude ECM solubleUrea- Crude ECM
#1 #2 #1 #2 #1 #2 #1 #2
Urea-soluble Crude ECM solubleUrea- Crude ECM
# of S pe ct ra # of P ro te in s Matrisome Non-matrisome 41 54 44 43 39 54 53 61 65 120 72 148 136 166 198 316 0 50 100 150 200 250 300 350 400 2394 4085 4074 3746 3207 4688 3542 4073 346 776 517 668 1019 1622 1280 1748 0 1000 2000 3000 4000 5000 6000 7000 Pe pt id e In te ns it y (% ) Adjacent normal
breast samples Triple-negative breast tumors
#1 #2 #1 #2 #1 #2 #1 #2
Urea-soluble Crude ECM solubleUrea- Crude ECM
#1 #2 #1 #2 #1 #2 #1 #2
Urea-soluble Crude ECM solubleUrea- Crude ECM
#1 #2 #1 #2 #1 #2 #1 #2
Urea-soluble Crude ECM solubleUrea- Crude ECM
# of S pe ct ra # of P ro te in s 0 20 40 60 80 100
Figure 2. Comparison of matrisome and non-matrisome proteins identified in urea-soluble vs. crude ECM samples. Bar charts represent the distribution of matrisome (blue) vs. non-matrisome (grey) proteins in terms of peptide abundance (upper panels), number of spectra (middle panels), and number of proteins (lower panels) in urea-soluble
A.
Figure 3. Peptide fractionation increases the number of ECM and ECM-associated proteins identified by mass spectrometry in both urea-soluble and crude ECM samples.
A. Bar charts represent the number of matrisome proteins identified proteins in urea-soluble or ECM samples from normal omentum (left) or omental metastasis from ovarian cancer (right) fractionated or not by basic-reverse phase
0 5 10 15 20 25 30 35 40 45 0 5 10 15 20 25 30 35 40 45
Urea-soluble / Unfract. Urea-soluble / Fract. Crude / Unfract. Crude / Fract.
Normal omentum sample Omental metastasis
B. # Pr ot ei ns # Pr ot ei ns
Normal omentum sample Omental metastasis
2897 10246 5824 11547 297 2918 23 481 65 1056 21 300 0 2000 4000 6000 8000 10000 12000 21 311 13 131 3 206 1 18 0 28 9 6 0 50 100 150 200 250 300 350 # Sp ec tr a # Sp ec tr a Urea-soluble
Unfract. Urea-solubleFract. Unfract.Crude CrudeFract.
Urea-soluble
Unfract. Urea-solubleFract. Unfract.Crude CrudeFract.
2223 5505 2445 9617 374 119 1103258 462 1372 171 383 0 2000 4000 6000 8000 10000 156 298 128 238 65 187 83 170 23 22 17 34 0 50 100 150 200 250 300 Urea-soluble
Unfract. Urea-solubleFract. Unfract.Crude CrudeFract.
Urea-soluble
Unfract. Urea-solubleFract. Unfract.Crude CrudeFract.
Glycoproteins Collagens Proteoglycans ECM Regulators ECM-affiliated Secreted Factors Core Matrisome: Matrisome-associated: C.
Matrisome proteins Non-matrisome proteins 188 133 190 134 198 155 198 160 0 50 100 150 200 # Pr ot ei ns # Pr ot ei ns 2384 973 2386 977 2414 1002 2424 1015 0 500 1,000 1,500 2,000 2,500 11614 7377 11715 7641 2283824363 27071 31141 0 5000 10000 15000 20000 25000 30000 35000 # Sp ec tr a # Sp ec tr a 35503 11321 35516 11323 35635 11385 35662 11404 0 10000 20000 30000 40000 0.0E+00 2.0E+10 4.0E+10 6.0E+10 8.0E+10 1.0E+11 Pe pt id e In te ns it y Pe pt id e In te ns it y 0.0E+00 5.0E+09 1.0E+10 1.5E+10 2.0E+10 2.5E+10 3.0E+10
Urea-soluble Crude ECM Urea-soluble Crude ECM
None Only Lysines Only Prolines Lysines + Prolines
Figure 4. Importance of allowing hydroxylation of prolines when searching databases to identify and quantify ECM proteins
Bar charts represent the number of spectra (A), peptide abundance (B), and number of proteins (C) for matrisome (left) and non-matrisome (right) proteins identified by searching the data allowing or not for prolines and/or lysines hydroxylations as dynamic modifications. Post-fractionation data to conduct this comparative analysis were acquired
A.
B.
CHARACTERIZATION OF THE EXTRACELLULAR MATRIX OF NORMAL AND DISEASED TISSUES USING PROTEOMICS
Alexandra Naba1¶#*
, Oliver M. T. Pearce2#*
, Amanda Del Rosario3
, Duanduan Ma4 , Huiming Ding4 , Vinothini Rajeeve2 , Pedro R. Cutillas2 , Frances R. Balkwill2+ , Richard O. Hynes1, 5+ 1
Koch Institute for Integrative Cancer Research, Massachusetts Institute of Technology; Cambridge, MA, U.S.A
2
Barts Cancer Institute, Queen Mary University of London, London, UK 3
Proteomics Core Facility, Koch Institute for Integrative Cancer Research, Massachusetts Institute of Technology; Cambridge, MA, U.S.A
4
Bioinformatics and Computing Facility, Koch Institute for Integrative Cancer Research, Massachusetts Institute of Technology; Cambridge, MA, U.S.A
5
Howard Hughes Medical Institute, Massachusetts Institute of Technology; Cambridge, MA, U.S.A
Present address: Department of Physiology and Biophysics, University of Illinois at Chicago, Chicago, IL, U.S.A
# These authors contributed equally to this work. + These authors share senior authorship of the paper. * Corresponding authors: Alexandra Naba [email protected] Phone: +1 312-355-5417 Oliver Pearce [email protected] Phone: +44 (0) 207882 3591
Supplementary Information - Table of content:
- Supplementary Table S1 Legend - Supplementary Figure S1
Supplementary Table 1: Complete mass spectrometry dataset
A. Samples analyzed, methods employed, and associated raw spectrum file names.
B. Complete dataset of the analysis of unfractionated peptides from crude ECM, urea-soluble ECM, and
urea-insoluble ECM enriched from triple-negative breast tumors or adjacent breast tissue from two patients. Data are sorted by samples and then matrisome categories.
C. Complete dataset of the analysis of unfractionated peptides from crude ECM, urea-soluble ECM, and
urea-insoluble ECM enriched from omental metastases from high-grade-serous-ovarian-cancer patients or normal omental tissue from low-grade ovarian cancer patients. Data are sorted by samples and then matrisome categories.
D. Complete dataset of the analysis of fractionated peptides from crude ECM and urea-soluble ECM
enriched from high-grade-serous-ovarian-cancer omental metastases high-grade-serous-ovarian-cancer patients or normal omental tissue from low-grade ovarian cancer patients. Data are sorted by samples and then matrisome categories.
E. Table summarizes mass spectrometric metrics (peptide intensity reflecting protein abundance, number
of spectra, number of unique peptides and number of proteins) calculated for ECM and non-ECM proteins identified in urea-soluble or crude ECM-enriched sample from one ovarian omental metastasis when allowing or not for proline and/or lysine hydroxylations when conducting database search (related to Figure 4D).
F. List of proteins identified in urea-soluble or crude ECM-enriched sample from one ovarian omental
metastasis when allowing or not for proline and/or lysine hydroxylations when conducting database search. * indicates that at least two isoforms were detected for this gene.
Supplementary Figure S1: Composition of urea-insoluble protein samples A. B. 37 36 38 40 29 35 55 83 0 20 40 60 80 100 120 140 #1 #2 #1 #2 Adjacent normal
breast samples Triple-negative breast tumors
# of P ro te in s Matrisome Non-matrisome Crude ECM Pellet Urea-soluble 33 5 2 14 8 2 1 Tumor-adjacent normal breast samples Triple-negative breast tumors Crude ECM Pellet Urea-soluble 35 12 2 5 11 3 A. Bar chart represents the distribution of matrisome (blue) vs. non-matrisome (grey) proteins in urea-insoluble ECM samples from from ovarian tumors (left) and normal breast tissues and triple-negative breast tumors. Two 2 independent samples were compared for each tissue and methodology (#1 and #2). B. Venn diagrams represent the overlap of ECM proteins detected by mass spectrometry when processing the samples according to one of the three methods described in the manuscript. See Supplementary Table S1B.