Publisher’s version / Version de l'éditeur:
Cement and Concrete Research, 34, April 4, pp. 641-649, 2004-04-01
READ THESE TERMS AND CONDITIONS CAREFULLY BEFORE USING THIS WEBSITE.
https://nrc-publications.canada.ca/eng/copyright
Vous avez des questions? Nous pouvons vous aider. Pour communiquer directement avec un auteur, consultez la Questions? Contact the NRC Publications Archive team at
PublicationsArchive-ArchivesPublications@nrc-cnrc.gc.ca. If you wish to email the authors directly, please see the first page of the publication for their contact information.
NRC Publications Archive
Archives des publications du CNRC
This publication could be one of several versions: author’s original, accepted manuscript or the publisher’s version. / La version de cette publication peut être l’une des suivantes : la version prépublication de l’auteur, la version acceptée du manuscrit ou la version de l’éditeur.
For the publisher’s version, please access the DOI link below./ Pour consulter la version de l’éditeur, utilisez le lien DOI ci-dessous.
https://doi.org/10.1016/j.cemconres.2003.10.011
Access and use of this website and the material on it are subject to the Terms and Conditions set forth at The Effects of lithium hydroxide solution on alkali silica reaction gels created with opal
Mitchell, L. D.; Beaudoin, J. J.; Grattan-Bellew, P. E.
https://publications-cnrc.canada.ca/fra/droits
L’accès à ce site Web et l’utilisation de son contenu sont assujettis aux conditions présentées dans le site LISEZ CES CONDITIONS ATTENTIVEMENT AVANT D’UTILISER CE SITE WEB.
NRC Publications Record / Notice d'Archives des publications de CNRC: https://nrc-publications.canada.ca/eng/view/object/?id=d1ab2556-665c-46fc-b916-cd2f90729303 https://publications-cnrc.canada.ca/fra/voir/objet/?id=d1ab2556-665c-46fc-b916-cd2f90729303
The Effects of lithium hydroxide solution on alkali silica reaction gels created with opal
Mitchell, L.D.; Beaudoin, J.J.; Grattan-Bellew, P.
NRCC-45385
A version of this document is published in / Une version de ce document se trouve dans : Cement and Concrete Research, v. 34, no. 4, April 2004, pp. 641-649
The Effects of Lithium Hydroxide Solution on Alkali Silica
Reaction Gels Created with Opal
Lyndon D. Mitchell, James J. Beaudoin, & Patrick Grattan-Bellew
Institute For Research in Construction, National Research Council Canada, Montreal Road, Ottawa, Ontario K1A 0R6
Keywords:
Category (from guide to authors) Keyword
C Alkali Aggregate Reaction
D Lithium Compounds
Abstract
The reaction of Nevada opal with calcium hydroxide, potassium and lithium hydroxide solutions was investigated. In addition opal was exposed to a combined solution of these three hydroxides. The progress of the three reactions was followed using X-ray Diffraction (XRD), 29Si Nuclear Magnetic Resonance (NMR) and Scanning Electron Microscopy (SEM). The XRD results indicated the presence of a low angle peak exclusive to the lithium-based reactions. The NMR results suggested a change in the silicate structure in the presence of lithium. These techniques indicated that the reaction of the alkali with the opal starting material is inhibited, and perhaps stopped in the presence of lithium hydroxides. SEM revealed that the morphology of the reaction products on the surface of the reacted opal grains is markedly different in all cases. It was concluded that evidence to support the theory of a protective layer exists and that the nature of the layer varies with ion type.
1. Introduction
Portland cement consists mainly of anhydrous calcium silicates, which react with water. As this reaction progresses the pore solution very quickly becomes saturated with aqueous calcium hydroxide. Thus, concretes made from Portland Cement are naturally alkaline with a pH of >12.5. Portland cement analysis also shows the presence of small and variable percentages of sodium and potassium [1]. The alkalis are present in the cement either as solid solutions in the clinker minerals, or as alkali sulphates.
Silica is a naturally abundant compound found in many forms, amorphous, crystalline and semi-crystalline. Silica in varying quantities is present in the majority of aggregates used for concretes. The reaction between the sodium, potassium and calcium hydroxides with reactive silica gives rise to a gel. The gel is able to absorb water, depending on its composition, and swell. Hence pressure can build within the brittle concrete matrix and cracking may result.
There are four essential ingredients for damage to concrete by Alkali Silica Reaction (ASR) [2]. These are moisture, a critical level of hydroxyl concentration, a pessimum amount of reactive silica in the aggregate and the presence of calcium hydroxide. Measures to minimise the risk of ASR are usually based on eliminating one or more of these four factors.
Maintaining a sufficiently low concentration of alkalis in the concrete is frequently the preferred option and standards are now in place restricting the alkali levels in cement [3]. Controlling the alkali content in the cement may not always be effective, especially when there is an external supply, for example from de-icing salts or when alkalis are derived from the aggregates themselves [4]. Many mixture designers recommend the use of supplementary cementing material (SCM’s) admixtures such as ground granulated blast furnace slag (ggbfs), pulverised fly ash (pfa), Silica fume or metakaolin, as an alternative to or in combination with, the use of low alkali cement. The calcium silicate formed by the hydration of these SCM’s binds alkalis from the pore solution, thereby reducing the amount of alkalis available for reaction [5]. The SCM's will preferentially react with the calcium hydroxide thus restricting the supply of calcium ions available for gel formation. However it must be noted that many SCM's contain substantial quantities of alkalis themselves.
1.1. Lithium Salts and ASR
A more recent approach to the mitigation of ASR is the use of soluble lithium salts. Although a precise mechanism has eluded the scientific community, there is ample empirical evidence to suggest that this approach could be a viable option [6]. Without an explanatory mechanism, the long-term effects of lithium treatment cannot be predicted.
The first reported use of lithium salts to control ASR was by McCoy and Caldwell [7]. More than 40 years passed before lithium salts were again used to arrest ASR. The inhibiting mechanism is far from clear. Some authors have speculated that the effect is due to the
preferential formation of non-expansive lithium bearing silicates [8,9]. This is in contrast to the expansive calcium-alkali-silicate complex that forms in the absence of lithium [2].
1.2 Lithium and Silica
The lithium ion is very different from sodium or potassium in its behaviour in silica systems [10]. In the 1950’s during the development of concentrated silica sols stabilised with NaOH, it was realised that the smaller the silica particle size, the more alkali and the lower the SiO2:Na2O ratio was required for stabilisation. However in the ratio range of 4:1 to 25:1 the concentrated compositions were generally found to be unstable and eventually gelled.
In 1954 it was discovered by Iler [11] that concentrated stable solutions containing SiO2:Li2O molar ratios from 4:1 to 25:1 could be obtained by adding LiOH to a solution of polysilicic acid, to a suspension of silica gel, or to a silica sol free from alkali metal or other cations. Since the mixture thickened or immediately set to a gel, this approach appeared useless until it was found that after a few hours or a day at ordinary temperature, the mass
spontaneously liquefied. When heated the silicate came out of solution and the lithium ions assumed some of the precipitation characteristics of a calcium ion at higher temperatures. The effect was reversible. Iler found the solidifying of the solution when hot and the subsequent re-liquefying to a clear homogenous state after being cooled to 25°C for a few hours remarkable [11].
In the context of the effects of lithium hydroxide on alkali silica reaction (ASR) this work would appear to be relevant. The spontaneous liquefaction of lithium silicates could lead to small amounts of lithium silicate gel forming only to liquefy hours later. The liquefaction process would release both lithium and silicate ions back into the pore solutions. The silicate ions would quickly be taken up by free calcium to form C-S-H, and the lithium ions would then be free to form more lithium silicate gel. There is presently no supporting evidence for this hypothesis. Indeed it is unlikely that a cement system will behave in the same manner as a pure lithium silicate system.
2. Objectives
The aim of this work was to investigate the interaction of reactive silica (Nevada opal) with calcium hydroxide in the presence of potassium and lithium hydroxide. Calcium hydroxide was used to simulate the calcium rich environment to be found in the pore waters of hydrating cement [12]. The batch designs follows Cong and Kirkpatrick [13], and hence were designed to simulate the proportions of the materials that might be found in a standard ASTM C-227 mortar design.
The techniques used were all solid state techniques namely X-ray Diffraction (XRD), 29Si Magic Angle Spinning Nuclear Magnetic Resonance (MAS-NMR), and Scanning Electron Microscopy (SEM).
3. Experimental
The starting materials were: powdered Nevada opal (natural reactive silica); Ca(OH)2 (BDH technical grade); lithium & potassium hydroxides (BDH Technical grade); and de-ionised water. Three mixes were made (see table 1).
The mixes were sealed and maintained at room temperature. Samples were periodically removed, filtered with a Buckner funnel and washed first with de-ionised water and then with acetone. In this way it was hoped that all reactions would be stopped at the time of sampling.
XRD measurements were carried out with a Scintag XDS-2000 diffractometer, using CuKα radiation and a graphite diffracted-beam monochromator. Samples were mounted onto a low background substrate. Scans were run from 5 to 65° 2 theta at a step of 0.04° and a count time of 5 seconds.
Scanning Electron Microscopy specimens were prepared with carbon adhesives on aluminium stubs. Samples were then sputter coated for 3 mins with gold. A Cambridge
Sterioscan 250 equipped with an Oxford Links 5354 Energy Dispersive Spectrometer was used to view the samples.
MAS-NMR measurements were carried out using a 4.7T wide-bore magnet, and a console supplied by Tecmag. The 29Si resonance frequency was 39.7 MHz. Samples were packed into a 7mm diameter zirconia rotor and spun at 4.5 kHz, in a magic angle spinning probe made by Doty Scientific. The sweep width used was 20 kHz, and the 90° length was 10 µs. A simple pulse and acquire pulse sequence was used, with a relaxation delay of 10s. For the starting Nevada opal sample, and a sample where the opal was in contact with Ca(OH)2 and KOH for 3 days, it was verified that doubling the relaxation delay to 20s gave no evidence of saturation of the spectrum. Also, for these two samples, it was verified that the application of proton decoupling did not change the appearance of the spectra. Acquisition of the spectra was normally carried out over night, but some samples were run over a weekend. This means that the number of scans accumulated for some samples are different. This limits the level of
interpretation possible.
4. Results
4.1 XRD
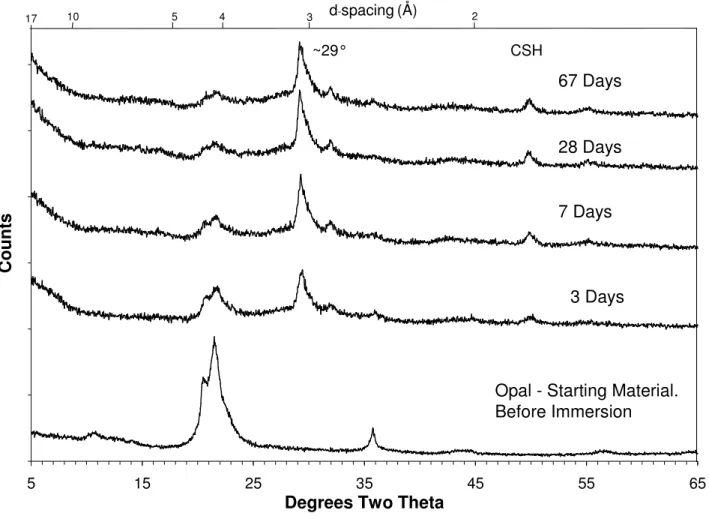
Figure 1 shows both the XRD pattern of the opal (SiO2) used in all experiments and the data collected on mix CK (see table 1). The main feature of the opal pattern is a peak at about 21.5° 2θ which has been assigned to cristobalite.
Figure 1 shows that in the mix with 1M KOH and Ca(OH)2 or CH (mix CK in table 1), all the CH was consumed before the first time measurement at 3 days. The most intense peak for CH can be found at 34.1° 2θ. The consumption of the silica (the broad peak at about 21.5° 2θ) is extremely rapid. Between the angles of ~5 and 10° 2θ, a shallow slope can be observed at about a 120° angle to the base line. This slope is indicative of the presence of reasonable amounts of amorphous materials. The large peak at ~29° 2θ, has been assigned to a mixture of
semi-crystalline calcium carbonate and C-S-H gel. Other C-S-H gel peaks are assigned to the smaller peaks at 32° & 50° 2θ.
Figure 1 XRD of opal reacted with Ca(OH)2 (s) 1M KOH(aq) (mix CK) over time
5 15 25 35 45 55 65
Degrees Two Theta
C o u n ts 3 Days 28 Days 67 Days 7 Days
Opal - Starting Material. Before Immersion CSH ~29° 2 3 4 5 10 17 d-spacing(Å)
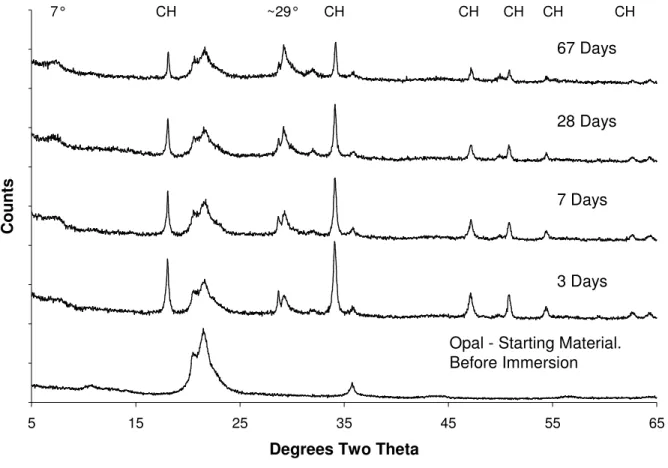
XRD patterns of opal reacted with Ca(OH)2 and a blend of 1M mixed hydroxides (KOH & LiOH) are presented in figure 2. The results show that the consumption of Ca(OH)2 is much slower; there is considerable Ca(OH)2 present even at 67 days. It is difficult to say whether the consumption has stopped or is just very slow. The consumption of the SiO2 has also slowed dramatically or perhaps stopped. The shallow slope between the angles of ~5-10° 2θ has flattened out considerably. In addition to the change in slope a small low angle peak has
developed in this region, indicating a move away from the amorphous material observed in Fig 1, and a move towards a more crystalline substance. The C-S-H peaks are still present. They are less prominent in figure 2 mainly due to the intensity/scale changes of the Y axis, but are
Figure 2 XRD of opal reacted with Ca(OH)2 (s) and a blend of 1M KOH(aq) & LiOH(aq) (mix CKL) over time
5 15 25 35 45 55 65
Degrees Two Theta
C o u n ts 3 Days 7 Days 28 Days 67 Days
Opal - Starting Material. Before Immersion
7° CH ~29° CH CH CH CH CH
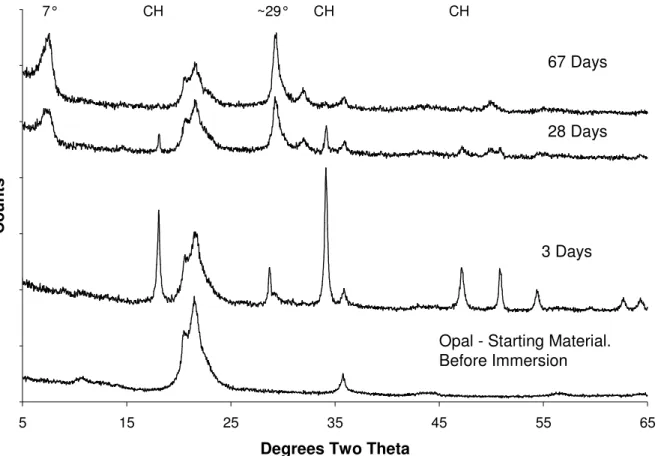
Figure 3 shows the opal reacted with CH and 1M LiOH. The results show that the
consumption of Ca(OH)2 has again changed. The consumption is slower than when KOH only is used and faster than the blended hydroxide solution. In contrast to the Ca(OH)2 the behaviour of the SiO2 in mix CL is very similar to that of mix CKL. The small low angle peak observed in figure 2 (at about 12.6Å) has increased in intensity and is now a prominent feature of the pattern at both 28 & 67 days. This indicates a further move towards crystallinity. C-S-H peaks are still present.
Figure 3 XRD of opal reacted with Ca(OH)2 (s) and 1M LiOH(aq) (mix CL) over time
5 15 25 35 45 55 65
Degrees Two Theta
C o u n ts 7° CH ~29° CH CH 3 Days 28 Days 67 Days
Opal - Starting Material. Before Immersion
4.2 NMR
Peak assignments are made using the standard Qn nomenclature. The letter Q represents a given silicate tetrahedron and the exponent the number of associated bridging oxygens. The non-bridging oxygens may be bonded to a low-charge cation, different from Si or to a proton as in an OH group. 29Si NMR chemical shifts are sensitive only to nearest neighbour (NN) and next nearest neighbour (NNN). Hence they cannot be used to interpret the extended molecular
structure.
There seems to be a range of chemical shifts within the available literature [13-19] regarding 29Si chemical shifts for Al-free silicates, Q4 (a tetrahedron with 4 bridging oxygens) peaks arise in the range –103 to –115 ppm. For a tetrahedra with 3 bridging oxygens, Q3, peaks occur at –91 to –98ppm. A tetrahedron with two bridging oxygens and two non-bridging
oxygens (Q2) peaks is detected within the –79 to –92ppm range and Q1 sites span the area –62 to –85.3ppm.
The Opal starting material largely consisted of a broad Q4 peak at about –112ppm. This agrees well with the spectra of the same materials published by Cong et al [13].
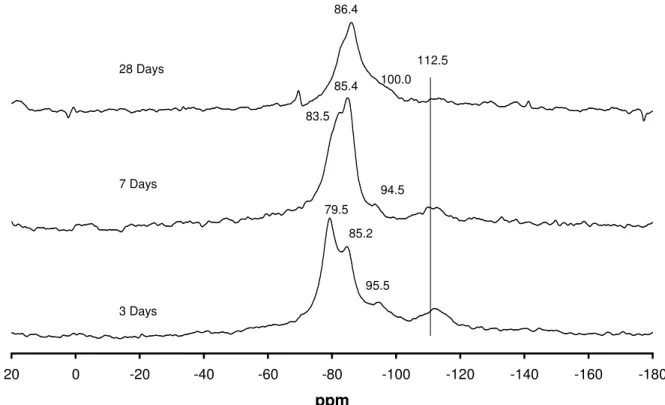
Figure 4 shows the NMR spectra of opal reacted with 1M KOH (mix CK). At three days it is very easy to define the Qn nomenclature for this system, Q4 at about –112ppm, the starting material, Q3 at –95.5ppm, Q2 at 85.2ppm and Q1 at 79.5ppm. At later ages a mixture of Q2 and Q3 tetrahedra are predominant at the expense of the Q1. A similar scenario has previously been reported [13]. In general agreement with the XRD results presented, the opal starting material very quickly diminishes.
Figure 4. NMR spectra of opal reacted with CH and 1M KOH (mix CK) for different times
-180 -160 -140 -120 -100 -80 -60 -40 -20 0 20 ppm 3 Days 7 Days 28 Days 95.5 85.2 79.5 85.4 94.5 86.4 100.0 83.5 112.5
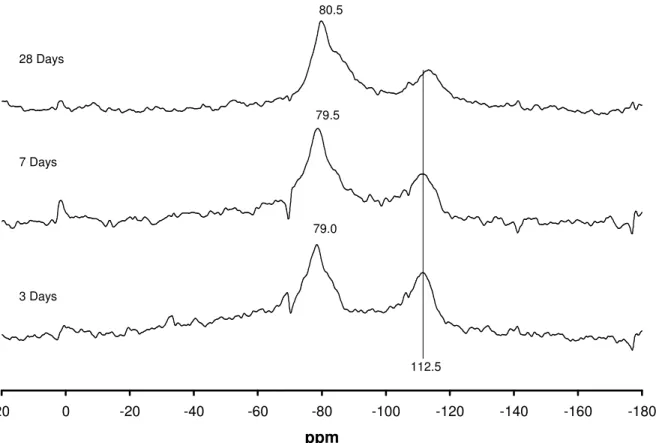
The changes caused by the influence of lithium hydroxide are immediately noticeable in figure 5. As in the XRD, the opal starting material is present in significantly larger quantities than is present at the same time period in mix CK.
Figure 5 NMR spectra of opal reacted with CH, 1M KOH & LiOH (mix CKL) for different times -180 -160 -140 -120 -100 -80 -60 -40 -20 0 20 ppm 3 Days 7 Days 28 Days 79.0 79.5 80.5 112.5
The main peak has changed position from ~86ppm with a shoulder at ~98ppm in mix CK to ~80ppm with a shoulder at 85ppm in mix CL. Hence the presence of lithium ions has changed the predominant silicate type from Q2 and Q3 to either Q1 and Q2, or Q2 only, depending on how the spectra is interpreted.
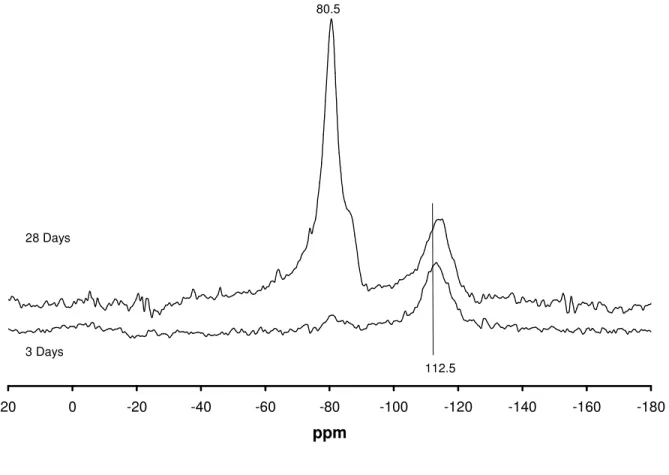
Figure 6 shows the NMR spectra of opal reacted with CH and 1M LiOH (mix CL) over time. The 28 days spectrum is very similar to that of the 28 day spectrum of mix CKL. That is a main peak at ~80ppm with a shoulder at 85ppm. However the 3 day spectrum is considerably
different, showing only a small peak at ~80ppm. At early ages, the presence of very little solid silicates other than that of the starting material is puzzling. Again the NMR Spectrum is in broad agreement with the XRD patterns. Both XRD and NMR data sets from mixes containing lithium show an abnormally slow start to the reaction, and that the opal starting material remains in the mix for the duration of the experiment.
Figure 6. NMR of opal reacted with CH and 1M LiOH (mix CL) over time -180 -160 -140 -120 -100 -80 -60 -40 -20 0 20 ppm 80.5 3 Days 28 Days 112.5 4.3 SEM
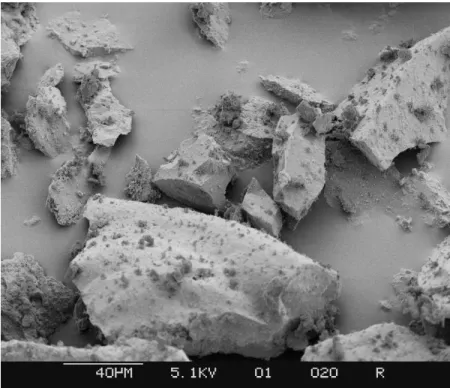
The raw crushed opal used in the experiments is shown in Figure 7. The particle size is about 40 microns and above. The angularity of the particles indicates the crushed origin of the material.
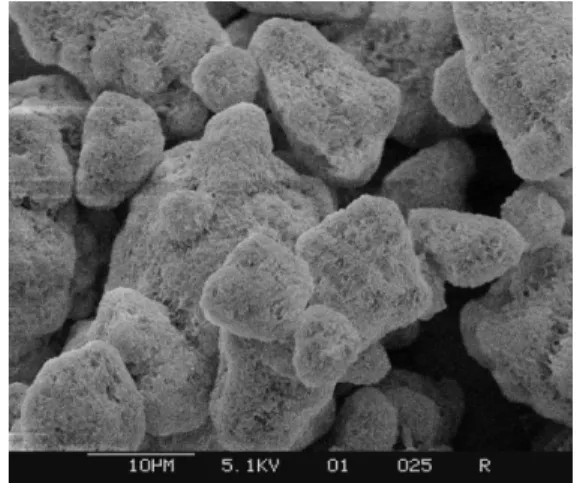
Figure 8 shows Mix CK (Table 1) after 28 days. The solids were filtered and gold coated. Immediately noticeable is the loss of angularity and loss of surface relief indicating a dissolution or erosion of the constituent grains. In addition to this there is a reduction in the particle size and a tendency for several particles to be fused together. Figure 9 shows the fused nature of the particles and the lack of surface relief in more detail. This is strong evidence of grain dissolution.
Figure 7. The Opal starting material at 500 x
Figure 8. Mix CK after 28 days. at 500 x Figure 9. Mix CK after 28 days. at 2000 x Figure 10 shows Mix CKL (See table 1) after 28 days. The particles seem more angular than in figures 8 & 9, with less evidence of aggregation. In addition a somewhat rougher surface texture can be observed. The increase in angularity can be interpreted as lower levels of
grain/opal dissolution. This can also be seen from the XRD and NMR data. Figure 11 shows Mix CKL at a higher magnification. The nature of the surface texture is much more apparent and is in stark contrast to the smoothness seen in figure 9. Again the angularity of the particles has increased, as has the surface relief.
Figure 10. Mix CKL after 28 days. at 500 x Figure 11. Gold coated Mix CKL after 28 days. at 2000 x
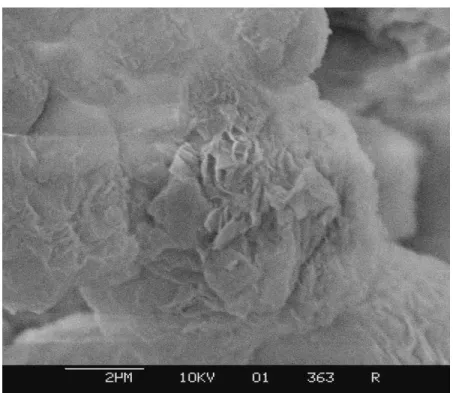
Figure 12 & 13 shows mix CL after 28 days. The angularity of the grains has increased over and above that of figure 10 indicating even lower levels of dissolution. The surface appears different again to either figure 11 or 9. A more layered nature seems to prevail.
Figures 14 shows mix CL after 28 days at very high magnification. The figures clearly show layered foils on the surface of the grains.
Figure 12. Mix CL after 28 days. at 500 x Figure 13. Mix CL after 28 days. at 2000 x
Figure 14. Gold coated Mix CL after 28 days. at 10000 x
5. Discussion
It is commonly reported that ASR gels in concrete tend to change composition with time, usually incorporating calcium from the surrounding paste [20]. It is well known that calcium to silica ratio is not only an important characteristic of ASR gels, it is also an important factor in defining the type of C-S-H gel produced on the hydration of Ordinary Portland Cement (OPC) [12]. The differences in the rates of calcium hydroxide uptake found when lithium ions are present, could be a key piece of evidence when considering the ASR arresting properties of lithium ions. Incorporation of calcium can possibly be controlled by the formation of a
protective layer around reactive elements. This layer could possibly be lithium silicate, but there is no evidence to substantiate this. Saturation with respect to calcium hydroxide within the pore solution will then limit the dissolution of the solid. It seems unlikely that a protective layer around the calcium hydroxide is present as there seems to be continuous reduction of the calcium levels in mix CK. Hence it seems more likely that the calcium hydroxide levels are controlled by equilibrium and solubility constants.
When CH and KOH solution only was used (mix CK) the rate of Ca(OH)2 dissolution was very fast, indicating the excessive and speedy creation of calcium rich ASR gel takes place. In the case of mix CKL after the primary uptake (3 days) the calcium hydroxide levels remain fairly constant. The levels may not be stable, but XRD is not a sensitive enough technique to determine this. The roughly stable Ca(OH)2 level indicates that the amount of calcium rich ASR gel does not change appreciably after 7 days. This data is interpreted to indicate the formation of a hydrolysis barrier around the opal.
reduction in Ca(OH)2 seems to coincide with the increased intensity of the low angle peak at about 7.5° 2 theta. The low angle peak (~7.5° 2 theta) observed in figures 2 and 3 corresponds to a basal plane spacing of 11.79 Å. Peaks similar to this have been previously observed [21].
Cole et. al. (1981) extracted and analysed the alkali aggregate reaction product from a 30 year old Australian dam. It did not correspond to any known compound, but they likened it to zeolite A [22], and later to rhodesite [21], because of the characteristic 12 Å peak. It should be noted that the shape of the peak observed by Cole et al (1981,1983) was narrow and sharp indicating a high degree of crystallinity - the peak observed in Fig 3 is broad and blunt. Cole et al also observed associated peaks that are not observed in Fig 3. Higher levels of crystallinity would be expected in a 30 year old material - as opposed to a 28 day old material. Reflection broadening could be accounted for by strain, induced by substitution, or by lower particle size. Cole et al concluded that their 12 Å phase irreversibly transformed into okenite
(CaO.2SiO2.2H2O) with K and Na substituting for Ca, on drying [21]. The replacement of monovalent cations by calcium is an interesting observation that raises the question of whether cation exchange is possible within the systems studied in this work?
The NMR data (figures 4-6) indicate a significant change in the neighbours of the silicon atoms when lithium is present in the formulation. When K was used Q2 and Q3 were the primary species detected. When lithium was present Q1 and/or Q2 are the main species. This difference in the level of silicate polymerisation would appear to be significant, as other workers have discussed the possibility that lithium salts may beneficially affect the levels of silica
polymerisation [23].
Gels created when C3S is hydrated are considered to be non-expansive and representative of the C-S-H gel found in concrete [12]. When pure C3S was hydrated under autoclave
conditions [24] and subsequently analysed by NMR, no Q3 was found in the gel. Q3 and Q4 were never found in the autoclaved gels. One might speculate that the expansive nature of ASR gel could be related to the presence of Q3 in the gel. The presence of Q3 represents a higher level of polymerisation with probable branching. However when lithium is present the high levels of polymerisation (Q3) are not observed. Instead Q1 and/or Q2 are the main species observed; this corresponds to the non-expansive gel found in the autoclaved C3S. Perhaps the hydrolysis barrier’s composition is similar to that of the C-S-H created during the autoclaving of C3S. However this study does not show whether the lithium ions are immobilised by this C-S-H or not.
The SEM pictures depict an interesting body of evidence. All three mixes have different surface relief. The first a very smooth relief, the second an almost honeycomb pattern and the third a layered structure. It is proposed that the surface texture of the grains changes with the levels of crystallinity observed in the XRD. This is especially evident in mix CL. The XRD patterns show a low angle peak that corresponds to a layered material; a layered material can also be observed in figures 14. When the SEM probe is used to analyze this material a CaO/SiO2 ratio of about ~1 is found. Lithium is invisible to the probe because it is too light, so it is
impossible to know whether there is lithium incorporated within the layers.
6. Conclusions
Acknowledgements
The authors would like to thank Dr S. Lang for assistance with the 29Si NMR measurements, Mr. J. Margeson for assistance with the SEM and Dr P. Whitfield for discussions of the X-ray diffraction results.
References
[1] S. Diamond, M. Penko, Alkali Silica Reaction Processes: The Conversion of Cement Alkalies to Alkali Hydroxide, in: J. Holm, M. Geiker (Eds), Durability of Concrete,
Proceedings of G.M. Idorn International Symposium, Toronto, Canada, 1992, pp. 153-168. [2] Lea's Chemistry of Cement and Concrete, P. C. Hewlett (Ed), Arnold, 1998.
[3] CSA International. Standard Practice to Identify Degree of Alkali-Reactivity of
Aggregates and to Identify Measures to Avoid Deleterious Expansion in Concrete. A23.2-27A. 251-261. 2000.
[4] M.A. Bérubé, J. Duchesne, J.F. Dorion, M. Rivest, Laboratory assessment of alkali contribution by aggregates to concrete and application to concrete structures affected by alkalisilica reactivity, Cem Concr Res, 32 (2002) 1215-1227.
[5] M. H. Shehata, M. D. A. Thomas, The Effects of Silica Fume and Fly Ash Hydration Products on the Chemistry of the Pore Solution and Portlandite Consumption, in: M.A. Bérubé, B. Fournier, B. Durand (Eds), Proceedings of the 11th International Conference on Alkali Aggregate Reaction In Concrete, Quebec City, Canada, June 2000, pp. 753-762. [6] J.S. Lumley, ASR Suppression by Lithium Compounds, Cem Concr Res, 27 (1997)
235-244.
[7] W.J. McCoy, A.G. Cauldwell, New approach to inhibiting alkali aggregate expansion, Journal of The American Concrete Institute, 22 (1951) 693-706.
[8] B. Q. Blackwell, M. D. A. Thomas, A. Sutherland, Use of Lithium to Control Expansion Due to Alkali-Silica Reaction in Concrete Containing U. K. Aggregates, in: V.M. Malhotra (Ed), Proceedings 4th CANMET/ACI International Conference on the Durability of
Concrete, Detroit, Mich., 1997, pp. 649-663.
[9] D. C. Stark, Lithium Salt Admixtures - An Alternative Method to Prevent Expansive Alkali-Silica Reactivity, in: The 9th International conference on Alkali-Aggregate Reaction in Concrete, Westminster, London 1992
[12] H.F.W. Taylor, Cement Chemistry, Academic Press Ltd, London, 1990.
[13] X.-D. Cong, R.J. Kirkpatrick, S. Diamond, 29Si MAS NMR spectroscopic investigation of alkali silica reaction product gels, Cem Concr Res, 23 (1993) 811-823.
[14] S.J. Adams, G.E. Hawkes, E.H. Curzon, A solid state 29Si nuclear magnetic resonance study of opal and other hydrous silicas, American Mineralogist, 76 (1991) 1863-1871. [15] H. Viallis-Terrisse, A. Nonat, J.C. Petit, Zeta-Potential Study of Calcium Silicate Hydrates
Interacting with Alkaline Cations, Journal of Colloid and Interface Science, 244 (2001) 58-65.
[16] H. Zanni, L. Fernandez, R. Couty, P. Barret, A. Nonat, D. Bertrandie, NMR Study of Concrete Alkali Aggregates Reaction, in: P. Colombet, A.R. Grimmer (Eds) , Application of NMR Spectroscopy to Cement Science, Gordon and Breach Science Publishers, Reading, UK, 1994, pp. 263-276.
[17] R.J. Kirkpatrick, MAS NMR spectroscopy of minerals and glasses, Reviews in Mineralogy, 18 (1988) 341-403.
[18] A.R. Brough, C.M. Dobson, I.G. Richardson, G.W. Groves, Alkali activation of reactive silicas in cements: in situ 29Si MAS NMR studies of the kinetics of silicate polymerisation, J Mat Sci, 31 (1996) 3365-3373.
[19] A.R. Grimmer, Structural Investigation of Calcium Silicates from 29Si Chemical Shift Measurements, in: P. Colombet, A.R. Grimmer (Eds) , Application of NMR Spectroscopy to Cement Science, Gordon and Breach Science Publishers, Reading, UK, 1994, pp. 113-151.
[20] S. Diamond, Chemistry and Other Characteristics of ASR Gels, in: M.A. Bérubé, B. Fournier, B. Durand (Eds), Proceedings of the 11th International Conference on Alkali Aggregate Reaction In Concrete, Quebec City, Canada, June 2000, pp. 31-40.
[21] W.F. Cole, C.J. Lancucki, Products formed in an aged concrete. The occurrence of Okenite, Cem Concr Res, 13 (1983) 611-618.
[22] W.F. Cole, C.J. Lancucki, Products formed in an aged concrete, Cem Concr Res, 11 (1981) 443-454.
[23] K. E. Kurtis, P. J. M. Monteiro, W. Meyer-Ilse, Examination of the Effect of LiCl on ASR Gel Expansion, in: M.A. Bérubé, B. Fournier, B. Durand (Eds), Proceedings of the 11th International Conference on Alkali Aggregate Reaction In Concrete, 2000, pp. 51-60. [24] S. Masse, H. Zanni, J. Lecourtier, J.C. Roussel, A. Rivereau, 29Si Solid State NMR Study