Characterizing Cellular Biophysical Responses to
Stress by Relating Density, Deformability, and Size
The MIT Faculty has made this article openly available. Please share how this access benefits you. Your story matters.
Citation Byun, Sangwon, Vivian C. Hecht, and Scott R. Manalis. “Characterizing Cellular Biophysical Responses to Stress by
Relating Density, Deformability, and Size.” Biophysical Journal 109, no. 8 (October 2015): 1565–1573.
As Published http://dx.doi.org/10.1016/j.bpj.2015.08.038
Publisher Elsevier
Version Author's final manuscript
Citable link http://hdl.handle.net/1721.1/108726
Terms of Use Creative Commons Attribution-NonCommercial-NoDerivs License
Characterizing cellular biophysical responses to environmental stresses by relating 1 density, deformability and size 2 3 Running title: Cellular density, deformability and size 4 5 6
Sangwon Byun1,*, Vivian C. Hecht1,*, Scott R. Manalis1,2,
7 8 1Departments of Biological Engineering and 2Koch Institute for Integrative Cancer Research, 9 Massachusetts Institute of Technology, Cambridge, MA 02139 10 11 *These authors contributed equally to this work. 12 13 ¶To whom correspondence should be addressed. E-mail: [email protected]. 14 15 16 Abstract 17 18
Cellular physical properties are important indicators of specific cell states. Although 19
changes in individual biophysical parameters, such as cell size, density and deformability, 20
during cellular processes have been investigated in great detail, relatively little is known 21
about how they are related. Here, we use a suspended microchannel resonator (SMR) to 22
measure the single-cell density, volume, and passage time through a narrow constriction of 23
populations of cells subjected to a variety of environmental stresses. Osmotic stress 24
significantly affects density and volume, as previously shown. In contrast to density and 25
volume, the effect of an osmotic challenge on passage time is relatively small. Deformability, 26
determined by comparing passage times for cells with similar volume, exhibits a strong 27
dependence on osmolarity, indicating that passage time alone does not always provide a 28
meaningful proxy for deformability. Finally, we find that protein synthesis inhibition, cell 29
cycle arrest, protein kinase inhibition, and cytoskeletal disruption result in unexpected 30
relations between deformability, density, and volume. Taken together, our results suggest 31
that measuring multiple biophysical parameters can detect unique characteristics that 32
more specifically reflect cellular behaviors. 33
34
Keywords: suspended microchannel resonator, cell stiffness, cell density, deformability, 35 osmotic stress 36 37 38 39
Introduction 40 41 Cellular biophysical properties reflect aggregate effects of particular cellular activities, such 42 as malignant transformation, differentiation, cell cycle progression, disease response, and 43 apoptosis. Studying these properties can help provide insight into the underlying molecular 44
mechanisms governing cellular behavior. For example, increased metastatic potential of 45
cancer cells has been correlated with increased cell deformability (1–6). Studies on 46
differentiation have also reported that the deformability decreases as stem cells become 47 more differentiated (7, 8). Cell cycle stage is known to be associated with changes in cell 48 shape and deformability (9, 10). Red blood cells (RBCs) affected by malaria show decreased 49 deformability and density (11, 12). Finally, previous studies have reported that apoptosis is 50 related to volume shrinkage and changes in cell deformability (13, 14). 51 52
Another common physiological source for changes to cellular biophysical properties is 53
shifts in extracellular osmolarity. Certain tissues, such as the kidney, are regularly exposed 54
to dramatic osmolarity shifts, and adjust their membrane surface area to allow for 55
increases or decreases to cell volume to maintain a constant cortical tension (15). Articular 56
cartilage in the synovial joints, such as the knee and hip, is subjected to both static and 57
dynamic mechanical compression during articulation, resulting in changes in interstitial 58
osmolarity of the cartilage tissue (16). This, in turn, can affect the biosynthesis rate, 59
deformability, and volume of chondrocytes in the tissue (17–19). Moreover, the inability to 60
respond to an osmotic challenge can result in impaired function, as is the case with T 61
lymphocytes lacking the osmosensitive transcription factor NFAT5/TonEBP. Eliminating 62
NFAT5/TonEBP expression prevents normal cell proliferation and development of 63
adaptive immunity, likely due to an inability to adapt to the hyperosmolar conditions 64
present in many lymphoid tissues (20). 65
66
Although most studies focus on the measurement of individual biophysical parameters, 67
increasing evidence shows that combining information from measurements of multiple 68
parameters can improve prediction of cell state. RBCs from patients with thalassemia, a 69
genetic disorder which leads to a measurable but not significant decrease in RBC volume, 70
can be distinguished from healthy RBCs based on a simultaneous comparison of both mass 71
and density, but not from either parameter taken individually (12). The differentiation 72 potential of stem cells can be accurately predicted by measuring the deformability of stem 73 cells along with size, but not by measuring size alone (21, 22). Measuring deformability and 74 diameter also enables prediction of four types of malignant diseases from a pleural effusion, 75
whereas the identification based on a single parameter only provides an incomplete 76
prediction (8). Measuring deformability and friction of cancer cells reveals that reduced 77 friction may play a role in further facilitating the passage of more deformable metastatic 78 cancer cells through tight spaces (23). 79 80
Here we used a murine pro-B cell line as a model system and measured multiple 81
biophysical parameters of individual cells with a suspended microchannel resonator (SMR). 82
First, to fully understand how cells respond to osmotic stress, we measured volume, 83
density, and passage time through a narrow constriction. Increasing the media osmolarity 84
leads to increased density and decreased volume as expected. Interestingly, we found that 85
the density change following an osmotic challenge cannot be accounted for by water 86
exchange alone, suggesting that the dry mass must shift as well. In contrast to density and 87
volume, passage time is nearly independent of osmolarity even though deformability 88
changes considerably, indicating that passage time should be measured together with cell 89
volume. Finally, we compared relationships between deformability and density for cells 90 treated with various pharmacological perturbations, including latrunculin B, staurosporine, 91 cycloheximide, rapamycin, and Torin 1. 92 93 94 Materials and Methods 95 96 Cell culture and preparation 97 98 FL5.12 cells, a murine pro-B lymphoid cell line, were cultured as previously described (24). 99
Briefly, cells were cultured in RPMI media (Invitrogen, Grand Island, NY) supplemented 100
with 10% (v/v) FBS (Sigma-Aldrich, St. Louis, MO), 100 IU penicillin, 100 µg/mL 101
streptomycin (Gemini, West Sacramento, CA) and 0.02 µg/mL IL-3 (R&D Systems, 102
Minneapolis, MN) at 37°C. FL5.12 cells were exposed to an osmotic challenge or 103
biochemical agent before each measurement. To maintain each condition during the 104 experiment, the media used in the SMR were also supplemented with the same stimuli. For 105 the osmotic challenge, cells were collected from the culture flask, centrifuged at 150 g for 5 106 min, resuspended in hypertonic or hypotonic media, and incubated for 30 min before the 107
measurements. D-mannitol (182.17 g/mol, Sigma-Aldrich) and deionized H2O (dH2O) were
108 added to the media for the hyperosmotic and hypoosmotic conditions, respectively. For the 109 isoosmotic control group (300 mOsm/L), cells were resuspended in the untreated culture 110 medium. For chemical perturbations, cells were resuspended and incubated in the media 111 supplemented with 5 μg/mL latrunculin B for 30 min (Sigma-Aldrich), 2 µM staurosporine 112 for 2 h (Enzo Life Sciences, Farmingdale, NY), 1 µg/ml or 10 µg/ml cycloheximide for 3 h 113 (Sigma-Aldrich), 100 nM rapamycin (Santa Cruz Biotechnology, Dallas TX) for 24 h, or 250 114
nM Torin 1 for 24 h (generously provided by Prof. David M. Sabatini, Massachusetts 115 Institute of Technology). Control groups for these conditions were cells resuspended in the 116 culture media supplemented with DMSO as the vehicle. The SMR measurement data from 117 the start of the measurement was compared to the data at the end of the measurement to 118 ensure that the data showed no time dependence. 119 120 Experimental systems 121 122
SMRs were fabricated at Innovative Micro Technology (Santa Barbara, CA). Overall 123
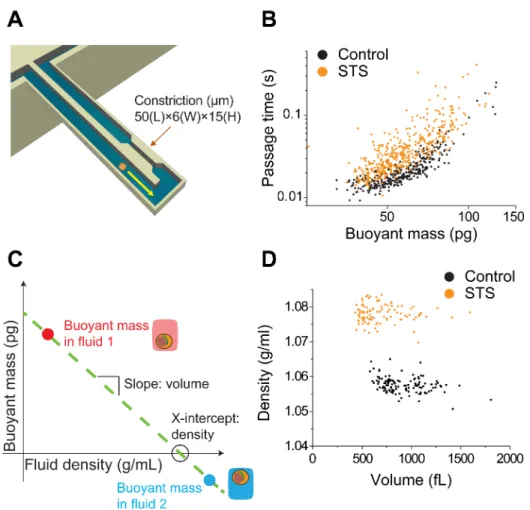
instrumentation for measurement and data acquisition have been previously reported in 124 detail (25). Schematics of experimental approaches are shown in Fig. 1. Density and volume 125 were measured by a separate SMR system from that measuring passage time. To measure 126 density and volume, each cell was weighed in the SMR in two fluids as previously described 127 (12) . Briefly, a cell immersed in a fluid of low density (Fluid 1, ~1.01 g/mL) is flowed from 128 a bypass channel through a channel embedded in a resonating cantilever, and trapped in an 129
opposite bypass filled with a fluid of high density (~1.1 g/mL). The direction of flow is 130 reversed, and the same cell is passed through the cantilever a second time, but now in Fluid 131 2 (~1.08 g/mL), which is a mixture of the high density fluid with a residual amount of Fluid 132 1. Each time the cell flows through the cantilever, a buoyant mass measurement is recorded, 133 along with a corresponding fluid density value. The two buoyant masses are plotted versus 134 their respective fluid densities to obtain a line with a slope corresponding to cell volume 135
and x-intercept corresponding to cell density (Fig. 1C). As the value of cell density 136 approaches that of the fluid density, the cell buoyant mass becomes progressively smaller, 137 and therefore more difficult to accurately determine. Thus, using our current system, we 138 were unable to quantify the density of cells exposed to very high osmotic stresses (> 500 139 mOsm/L), due to the value of cell density approaching that of the Fluid 2 density. For all 140
density measurements, a 7:3 mixture of cell media:iodixanol solution (OptiPrep Density 141
Gradient Medium, Sigma-Aldrich) was used as the high density fluid. In experiments 142 involving osmotic stress, the osmolarity of this solution was adjusted with either mannitol 143 or water to match that of Fluid 1. 144 145
To measure passage time, single cells were measured in an SMR with a constriction as 146 previously described (23). Briefly, a cell is flowed into the embedded microfluidic channel 147 of the SMR, and deformed as it flows into the constriction. The geometry of the constriction 148 is a rectangular channel 6 μm wide, 15 μm deep, and 50 μm long. The cross-sectional area 149 of the constriction is 90 μm2 (6 μm wide × 15 μm deep) and the average diameter of FL5.12 150
cells is approximately 12 μm (untreated control), indicating a maximum cross-sectional 151
area of approximately 113 μm2. The narrow width of the constriction ensures the
152
deformation of a cell as it squeezes into the constriction’s entrance (entry) and then passes 153
through the constriction channel (transit). The resonant frequency response of the SMR, 154 which depends on cell’s buoyant mass and position in the microfluidic channel, is tracked 155 in real time as the cell passes through the channel. The passage time includes the total time 156 required for the cell to slow down as it deforms to enter the constriction (entry time), and 157 speed up as it travels through and exits the constriction (transit time). Here we measured 158
the passage time as a metric for cell deformability, which is defined as the total time 159 required for the cell to deform into and then transit through the constriction. The relative 160 contribution of surface friction to the passage time can be estimated by comparing the cell’s 161 velocities during the entry (entry velocity) and the transit (transit velocity). Typically, the 162 passage time is dominated by the entry time since the transit velocity is significantly faster 163
than the entry velocity (23). Dominance of the entry time in the passage time was 164
consistently observed in our previous study, in which we measured seven adherent cell 165
lines, including mouse embryonic fibroblasts, mouse lung cancer cell lines, human lung 166
cancer cell lines, as well as a mouse lymphoblastic leukemia cell line that was grown in 167
suspension (23). We have also measured cells in various conditions, such as treating cells 168
with latrunculin B, and nocodazole, or coating the microchannel surface with positively 169
charged poly-L-lysine. In all of these cell lines and treatments, the passage time was 170
dominated by the entry time (23). Therefore, here we assume that the friction can affect 171
but does not dominate the differences in passage times. The fluidic channel is coated with 172
poly(ethylene glycol) [1 mg/mL; PLL(20)-g[3.5]-PEG(2); Surface Technology] to reduce 173
non-specific adhesion of cells to the walls of the constriction. All measurements were 174
acquired at room temperature under a constant applied pressure drop across the 175 microchannel (0.15 psi) established by pressure regulators. 176 177 178 179 180 181
Fig. 1. Schematic diagrams of the approaches for measuring deformability, density and 182
volume, and examples of the data extracted from the measurement. (A) A SMR with a 183
constriction measures the passage time and buoyant mass as a cell flows into an embedded 184
microfluidic channel and transits through the constriction. (B) Passage time versus 185
buoyant mass for the FL5.12 cell line shows the change in passage time induced by 186
staurosporine (STS). (C) Measuring the buoyant mass of a single cell in two fluids of 187
different densities allows the cell density and volume to be determined. (D) Cell density 188 versus volume of FL5.12 cells treated with STS. Treatment with STS leads to an increase in 189 density and a slight decrease in volume. 190 191 192 193 Data analysis 194 195
SMR frequency data was converted to buoyant mass, passage time, volume and density 196
using methods previously described (12, 23). Data plotted in Figs. 2C, 2E, 3A, and 3C 197
represent volume, water content, passage time, and buoyant mass, respectively. These 198 parameters are plotted with a logarithmic scale, which we considered to be the form that 199 most accurately represents the data. Cell size follows a log-normal distribution, as has been 200 previously reported (26). Passage time is expected to follow a log-normal distribution as 201 well, since passage time has a strong power-law dependence on buoyant mass, as shown in 202 Fig. 1B (23, 27). 203 204 As previously presented, the SMR can be used to measure biophysical properties with high 205 precision (12, 23, 25). The buoyant mass and the position of the center of mass of a particle 206 passing through a constriction in the SMR can be measured with a precision near 1 pg and 207 sub-micron, respectively (23). Additionally, the density and volume can be measured with a 208
resolution of 0.001 g/ml and 3 fL, respectively (12). We can therefore attribute the 209
variability observed in our measurement to inherent biological variations rather than 210 experimental artifacts. For example, one source of biological variation in size is related to a 211 distribution of cells across the cell cycle. Interestingly, in our measurements, cells of similar 212 buoyant mass showed a significant variation in passage time (Fig. 1B), suggesting that, in 213
addition to biological variation such as a cell cycle (10), the orientation of the cell upon 214 entry into the constriction can cause a wide distribution (23, 28). 215 216 The buoyant mass obtained during passage time measurements was converted to volume 217 using the following equation, 218 𝑉 = 𝑏% 𝜌'()) − 𝜌+),-.
where V is the cell volume, bm is the cell buoyant mass, ρcell is the average of the cell density
219
obtained from a corresponding SMR density measurement, and ρfluid is the fluid density.
220
The uncertainty contributed to the volume distribution resulting from converting the 221 buoyant mass using an average cell density was determined to be not significant based on a 222 Monte Carlo estimate (Fig. S1 in the Supporting Material). 223 224
Statistical significance between density measurements was determined using a non-225 parametric rank-sum analysis (Wilcoxon rank sum) implemented in MATLAB. Changes in 226 passage time were estimated and the statistical significance of those changes were tested 227 by fitting data sets to a linear model in R. For all statistical tests, a p-value less than or equal 228
to 0.05 was considered significant. In particular, since most statistical tests showed very 229 small p-values (10-50 - 10-5), we indicated those small p-values by “p < 0.0001”. 230 231 232 Results 233 234 Characterizing the density and volume of cells exposed to osmotic stress. 235 236
To characterize the biophysical effects of osmotic stress, we first measured the changes to 237
density and volume of FL5.12 cells exposed to a range of osmolarities (Fig. 2). We varied 238
the osmolarity of the cell media from 250 to 600 mOsm/L by diluting with dH2O or
239
concentrating with D-mannitol. Due to limitations described in Materials and Methods, we 240
were not able to measure the density and volume at 600 mOsm/L, though we did obtain 241
passage time measurements. Cell density increases following exposure to hyperosmotic 242
media and decreases following exposure to hypoosmotic media (Fig. 2A); the effect of 243
osmotic stress on cell volume follows an opposite trend (Fig. 2B). We expect that the 244
primary source of this trend is the change in cellular water content (29, 30). Water has a 245
lower density than most non-aqueous cellular components, particularly proteins, nucleic 246
acids, and certain lipid conjugates (31–33). Thus, when an osmotic challenge leads to a 247
change in volume, the ratio of water to non-aqueous components will change as well. If the 248
cellular water fraction increases, the density will decrease; this is the case with 249
hypoosmotic swelling, in which the influx of water is associated with both a larger volume 250
and a lower density. Similarly, the loss of water in the hyperosmotic case leads to both a 251
decreased volume and an increased density. We estimated the change to water content 252
using a previously described method (Supporting Material), and confirmed that 253 hypoosmotic stress leads to an increase in water content, while hyperosmotic stress leads 254 to a decrease in water content (Fig. 2E). 255 256 Interestingly, the variability in cell density appears to be much smaller than that of volume; 257 we found this to be true both among a population of cells from single measurement (Fig. 2A 258 and C) and when comparing the means of multiple measurements (Fig. 2B and D). For the 259 300 mOsm/L measurement shown in the box plot in Fig. 2A and C, the interquartile range 260
of density is approximately 0.005 g/mL, or approximately 0.5% of the mean, while the 261 interquartile range of volume is approximately 500 fL, or approximately 25% of the mean. 262 Similarly, the CV of density is approximately 0.3%, while that of volume is approximately 263 50%. We can attribute the wide volume range in part to differences in cell cycle stage in the 264
population; the much narrower range of density could suggest that density remains 265
relatively constant for a majority of the cell cycle. The variability for multiple experiments 266
is shown in Fig. 2B and D where each point represents the geometric mean of a single 267
measurement, and the green bar represents the mean across multiple measurements. In 268
this case, the CV of volume is approximately 10%, whereas that of density is 0.065%. This 269
outcome further reinforces the notion of a biological mechanism to maintain a narrow 270 density distribution. As a possible explanation, we can consider density to be a reflection of 271 the crowding of intracellular macromolecular components; previous work has shown that 272 the cytoplasm is extremely crowded, and that the level of crowding affects protein stability, 273
adsorption to surfaces, and reaction rates (34–36). Thus, we can hypothesize that tight 274
regulation of density results from a requirement to maintain a uniform level of crowding. 275
An important consequence of the tight distribution of density relative to volume is that 276
cells of similar densities will not always have the same volumes. Thus, simultaneous 277
measurement of both density and volume is necessary to more accurately describe cell 278
state. 279
280
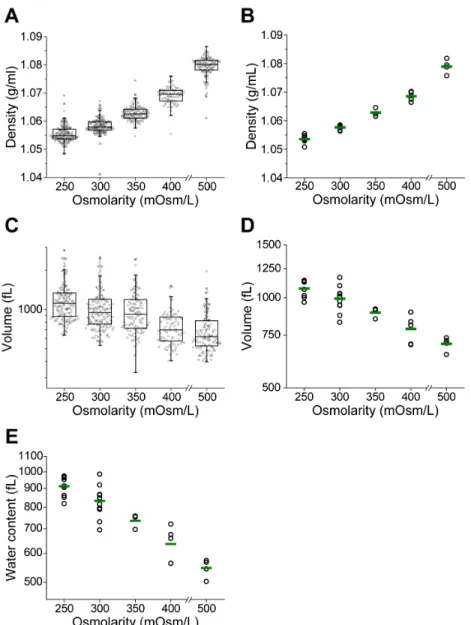
281 282 Fig. 2. Effect of osmotic stress on density and volume. FL5.12 cells are incubated in hypo- 283 and hyperosmolar media for 30 min before and during the measurement. (A) Box plots of 284
density from a representative experiment. Each data point represents the density of an 285
individual cell (n = 83-170). (B) Density changes resulting from osmotic stress across 286
multiple replicates. A single point represents the geometric mean of one replicate and the 287
green line indicates the mean from multiple replicates (3-8 for each condition). (C) Box 288
plots of volume from a representative experiment. Data shown was measured 289 simultaneously with density in A. Each data point represents the volume of an individual 290 cell. (D) Volume changes resulting from osmotic stress across multiple replicates. A single 291 point represents the geometric mean of one replicate and the green line indicates the mean 292 from all replicates (3-8 for each condition). 293 294 295 296
Characterizing the passage time and deformability of cells exposed to osmotic stress. 297
298
Next, we determined how osmotic stress affects the passage of a cell through a narrow 299
constriction by comparing the median passage times for osmotically-stressed cells to an 300
isoosmotic control. In contrast to cell density and volume, the effect of an osmotic challenge 301
on passage time is relatively small (Fig. 3). Changes in passage time following osmotic 302
challenges of 250, 350 and 400 mOsm/L are 0.68, 0.66, and 5.1%, respectively (Fig. 3B). 303
However, increasing the media osmolarity to 500 and 600 mOsm/L results in a ~ 30% 304
increase in passage time. Similarly, following exposure to osmotic stress, cellular buoyant 305
mass does not deviate significantly from its control (3.6, -0.79, and -3.6% changes, 306
respectively, for 250, 350 and 400 mOsm/L, Fig. 3D); exposure to 500 and 600 mOsm/L 307
media results in a further decrease in buoyant mass (-9.2%, and -16% respectively), 308
suggesting that buoyant mass decreases as osmolarity increases. 309
310
The relatively small changes to passage time and buoyant mass following osmotic stress 311 between 250 and 400 mOsm/L can be attributed to simultaneous, compensatory changes 312 in density and volume. For example, as a cell is compressed with an osmotic challenge, its 313 density increases while its volume decreases. As a cell becomes denser by water loss, cell 314
deformability decreases by molecular crowding within cytoplasm (30), which, in turn, 315
increases the passage time (23). Therefore, though a denser cell should exhibit a longer 316 passage time due to its decreased deformability (Fig. 4), its smaller volume concurrently 317 decreases the passage time (23, 27). As a result, the overall change in passage time caused 318 by osmotic stress is relatively small. These results demonstrate that passage time reported 319
independently of size may not always predict cell deformability, and that passage time 320
must be compared for cells of similar size to decouple effects of varying size and 321 deformability (23). 322 323 Buoyant mass is a convenient size metric since it is simultaneously measured with passage 324 time for individual cells (Fig. 1, and Data Analysis). However, buoyant mass depends on cell 325 volume and density, and, like passage time, is susceptible to compensatory changes in these 326
parameters. Buoyant mass is defined as the product of the volume and the difference 327
between the cell density and the density of the surrounding fluid; thus, the increase in 328 density following osmotic compression would lead to an increase in buoyant mass, while 329 the decrease in volume would lead to a decrease in buoyant mass. Indeed, we find that the 330 buoyant mass remains relatively unaffected by osmotic compression (350, 400 mOsm/L) 331 (Fig. 3C, D). Thus, we define deformability as the passage time of a cell accounting for its 332 volume, thereby eliminating the dependence of passage time on size (Fig. 4) (23). By using 333 an average value for population density, which has a variance 100-fold smaller than that of 334 both buoyant mass and volume, we can convert buoyant mass to volume with only minimal 335
error contributions (Fig. 2A, C, Fig. S1) (12, 37). This is an improvement over previous 336 methods, in which we performed the same conversion but starting instead with a volume 337 distribution from a commercial Coulter counter (23, 38). A plot of each data set with a log-338 log scale is subsequently fit to lines with a fixed slope and variable intercepts (Fig. 4A). The 339
deformability is determined by the ratio of passage times given the same cell volume, 340
which is acquired from the difference between the two intercepts (green arrow), and is 341 then converted to a percentage (Fig. 4B). 342 343 344 345 346 347
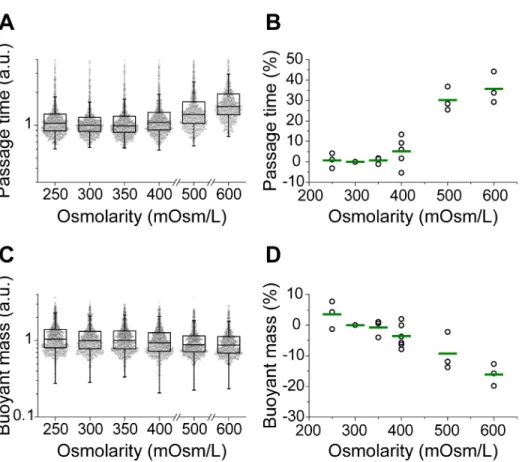
Fig. 3. Effect of osmotic stress on passage time and buoyant mass. FL5.12 cells are 348
incubated in hypo- and hyperosmolar media for 30 min before and during the 349 measurement. Passage time and buoyant mass are relatively unaffected by osmotic stress 350 at 250, 350, and 400 mOsm/L. (A) Box plots of passage time scaled by the median of the 351 control (300 mOsm/L). Each data point represents passage time of an individual cell (n = 352 972-1101). (B) Percentage change in the median of passage time. The median passage time 353 from each condition is normalized by the median of the control. A single point represents 354 one replicate and the green line indicates the mean from multiple replicates (3-6 for each 355 condition). (C) Box plots of buoyant mass scaled by the median of the control. Data shown 356
was measured simultaneously with passage time in A. Each data point represents the 357 buoyant mass of an individual cell. (D) Percentage change in the median buoyant mass. The 358 median buoyant mass from each condition is normalized by the median of the control. A 359 single point represents one replicate and the green line indicates the mean from multiple 360 replicates (3-6 for each condition). 361 362
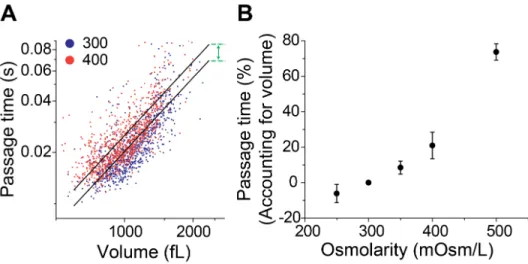
363 364 Fig. 4. Determining deformability from passage time by accounting for cell volume. Volume 365
is obtained by converting single cell buoyant mass data using the population average 366
density. (A) Passage time versus volume of the two datasets (from Fig. 3, isoosmotic and 367
hyperosmotic conditions) in a log–log scale are fitted to the linear models (black lines) with 368
a fixed slope and variable intercepts corresponding to the two conditions. The 369
deformability is determined by the ratio of passage times given the same cell volume, 370
which is acquired from the difference between the two intercepts (green arrow). (B) 371 Dependence of deformability (percentage change in passage time based on cell volume) on 372 osmolarity of media. The data used is the same as shown in Fig. 3. 373 374 375 376 After accounting for volume, we can identify a significant difference between two cells of 377
the same volume exposed to differing values of media osmolarity (-6.1, 8.5, and 21% 378
changes, respectively, for 250, 350 and 400 mOsm/L), which demonstrates that cells 379
become stiffer by hyperosmotic compression and more deformable by hypoosmotic 380
swelling. In other words, though the population of cells as a whole still exhibits similar a 381
passage time to the isoosmotic control (Fig. 3B), the viscoelasticity of an individual cell is 382
changed by osmotic stress (Fig. 4B). The observed decrease in deformability caused by 383
hyperosmotic compression and determined by a longer passage time is consistent with 384
previous studies, one of which links the change to cytoplasmic crowding resulting from 385
water loss (30, 39, 40). The increase in deformability by a hypoosmotic challenge has also 386
been reported (19, 39, 41), but is not consistent among all studies (40), likely due to 387
discrepancies in measurement techniques and cell lines. Our results indicate that volume 388
should be taken into consideration when relating passage time through a constriction to 389 cellular deformability. 390 391 Characterizing cell states by deformability, density, and volume 392 393
When cells are exposed to an osmotic challenge, changes in density or volume correlate 394
with changes in deformability due to the dependence of all three parameters on the 395
osmolarity of the surrounding fluid (Fig. 2A). However, a general relationship between 396 density, volume and deformability cannot be established a priori, since cellular activity or 397 external stimuli can affect cellular composition and cytoskeletal proteins, which can affect 398 density, volume and deformability independently of each other (1, 12). Similarly, a change 399
in volume alone cannot predict density or deformability, except when cells change their 400
volume only by water exchange. Thus, we next sought to investigate representative 401
relationships of deformability versus density and volume (Fig. 5), which would allow us to 402
demonstrate how cell states can be characterized by multiple biophysical properties. In 403
addition to an osmotic challenge, FL5.12 cells were also exposed to the following 404
conditions: latrunculin B, staurosporine, cycloheximide (1 µg/ml, 10 µg/ml), rapamycin, 405
and Torin 1. A summary of the effects of these drugs is provided in Table S1 in the 406
Supporting Material. Density, volume, and deformability were measured using the same 407
methods as previously described. Passage time accounting for volume is then plotted 408
versus density (Fig. 5A) and volume (Fig. 5B). 409
410
Increases in osmolarity lead to increases in density and decreases in volume and 411
deformability, represented by the black solid lines in Fig. 5A and 5B. Latrunculin B, 412
however, leads to an increase in deformability accompanied by a slight increase in density 413
and insignificant change in volume (green line, Fig. 5A and 5B). A small increase in volume 414
by latrunculin B has been previously reported (42). This outcome likely results from the 415
relatively specific behavior of latrunculin B, which complexes with actin monomers to 416
inhibit actin polymerization (43). These changes may result in a slight change in cellular 417 water content, due to shifting hydration layers in the proteins; this shift may be sufficient 418 to change density, but not volume (44). 419 420
Treating with staurosporine (red line) maintains the same relationship between density 421
and deformability as we observe with osmotic stress but with a greater change in 422
deformability. A cell undergoing apoptosis by staurosporine typically shows an apoptotic 423
volume decrease and denser cytoplasm, which is consistent with our measurements of 424
volume and density (45). Staurosporine can also lead to cell cycle arrest (46), inhibit 425
protein synthesis independently of caspase activation (47), and delocalize myosin II (48). 426
Therefore, a decrease in deformability after treating with staurosporine may be related to 427
impaired myosin activity, which may explain why staurosporine leads to a much greater 428
change in deformability than does hyperosmotic compression. 429
430
Treating with 10 µg/ml cycloheximide decreases density similarly to what we observe 431
under a hypoosmotic condition (250 mOsm/L), but a greater increase in deformability. The 432
increase in deformability caused by treating with cycloheximide, which inhibits protein 433
synthesis, is consistent with a previous study (49). Interestingly, the biological effects of 434
cycloheximide depend on the concentration and cell type. For example, while 435 cycloheximide is cytotoxic at low concentrations to Jurkat cells, it has no effect on CEM C7 436 cells at low or high concentrations, even though both are human leukemic cell lines (50). 437 Moreover, additional studies of different cell types exposed to low levels of cycloheximide 438
have shown that it may have cytoprotective effects (51). This concentration dependence 439
may explain the slight discrepancy between the changes to density and volume at 1 µg/mL 440
and 10 µg/mL (5A and red arrows, Fig. 5B). Since cycloheximide can also induce the 441 elongation or arrest of cell cycle, which may affect the protein content and cell volume (52, 442 53), the relationship between volume and density is difficult to predict. Thus, while density 443
and volume are inversely correlated at the higher concentration, they are directly 444 correlated at the lower concentration. 445 446 Similarly to the case with cycloheximide, we also notice that Torin 1 and rapamycin induce 447
decreases in both density and volume, providing another example of how volume is not 448
always inversely related to density (arrows in Fig. 5B). This outcome may be attributed to 449
the biological effect of Torin 1 and rapamycin, which block mTOR, inducing cell cycle arrest 450
at the G1/S transition and inhibiting protein synthesis (54, 55). Previous studies have
451
shown that cell volume and deformability depend on the cell cycle (10). The slight decrease 452
in population volume may thus be attributed to arrest in S phase. A decrease in density 453
could be due to lower levels of both protein and DNA. In addition, Torin 1 and rapamycin 454
are also known to affect actin polymerization and protein synthesis (56–59). Although 455
previous studies often demonstrated that Torin 1 and rapamycin can inhibit actin 456
polymerization (57), rapamycin can also increase actin polymerization in RBL-2H3 cells 457 (56), suggesting that the slight decrease in cell deformability by these mTOR inhibitors may 458 be induced by the change in actin structure. 459 460
We would also like to note that, the drugs used in our study, typically cause a more 461
significant change in deformability than does osmotic stress. For example, staurosporine 462
induces more than a 200% change in passage time, and the deformability of FL5.12 cells is 463
increased by cycloheximide regardless of changes in density or volume. This suggests that 464
the integrity of cytoskeletal structure can play a more important role on deciding 465
deformability than the changes driven by water exchange. However, Zhou et al. previously 466
showed that latrunculin A-induced weakening of the cytoskeletal rigidity is overwhelmed 467
by stiffening of the cytoplasm induced by very high osmotic stress (~ 1000 mOsm/L), 468
suggesting that the change in cytoskeletal structure does not always dominate cell 469 deformability (30). 470 471 472 Conclusion 473 474 We have shown the value of measuring multiple biophysical parameters. Although volume 475
is the most commonly identifiable cell size metric, density can reveal additional 476
information for understanding the mechanical properties of cells. Density may represent 477
changes in structure or composition as well as the crowdedness in the cytoplasm which 478
may not be directly related to volume, but may still affect deformability. Grover et al. 479
previously found that measuring density enables the identification of cell states which 480
were not detectable by other cell size metrics, such as volume and mass (12). However, 481
changes to deformability may not necessarily lead to changes in any size metric, 482
particularly if the deformability change is associated with changes to structural proteins. 483
Thus, by combining measurements of deformability and density, we can detect more 484
specific biophysical characteristics that refine our representation of cell state. 485
486 487 Fig. 5. Deformability versus density and volume for various conditions: osmotic challenge 488 (250, 350, 400, 500 mOsm/L), latrunculin B (LatB), staurosporine (STS), 1 µg/ml and 10 489 µg/ml cycloheximide (CHX), rapamycin (Rap), and Torin 1 (Tor). Changes in deformability, 490
density, and volume after treatments are quantified based on the isoomotic control 491
(untreated, 300 mOsm/L) in each experiment. Plots are divided into four quadrants, 492
defined by two grey dotted lines. (A) The percentage change in passage time accounting for 493
volume is plotted versus the change in density. The correlation between changes in 494 deformability and density depends on the mechanism associated with each treatment. (B) 495 The percentage change in passage time accounting for volume is plotted versus the change 496 in volume. Rap, Tor, and CHX (1 µg/mL) are located in different quadrants compared to A 497
(arrows). Vertical error bars represent standard deviation of the mean. Horizontal error 498
bars (density, volume) represent standard error of the mean. All treatments induce a 499
significant change in the density (p < 0.0001, Wilcoxon rank sum). All treatments, except 500
Torin 1 (p = 0.0501), induce a significant change in the passage time (p < 0.0001, linear 501 model). The data used for osmotic challenge is the same data as shown in Fig. 4 and for the 502 other conditions, we measured ~ 200 cells and ~ 1000 cells for density and deformability, 503 respectively. 504 505
Author Contributions 506 S.B., V.C.H., and S.R.M. designed research; S.B. and V.C.H. performed research; S.B. and V.C.H. 507 analyzed data; and S.B., V.C.H., and S.R.M. wrote the paper. 508 509 Acknowledgements 510 We would like to acknowledge Josephine Bagnall for valuable discussions. This work was 511
supported with funding from the National Cancer Institute Contracts: Physical Sciences 512
Oncology Center U54CA143874 and CCNE-T (Grant 26697290-47281-A). S. Manalis is co-513
founder of Affinity Biosensors which develops instruments that utilize the suspended 514 microchannel resonator. 515 516 Supporting Citations 517 Reference (60) appears in the Supporting Material. 518
References 519 1. Suresh, S. 2007. Biomechanics and biophysics of cancer cells. Acta Biomater. 3: 413– 520 38. 521 2. Cross, S.E., Y.-S. Jin, J. Rao, and J.K. Gimzewski. 2007. Nanomechanical analysis of cells 522 from cancer patients. Nat. Nanotechnol. 2: 780–3. 523 3. Guck, J., S. Schinkinger, B. Lincoln, F. Wottawah, S. Ebert, M. Romeyke, D. Lenz, H.M. 524 Erickson, R. Ananthakrishnan, D. Mitchell, J. Käs, S. Ulvick, and C. Bilby. 2005. Optical 525 deformability as an inherent cell marker for testing malignant transformation and 526 metastatic competence. Biophys. J. 88: 3689–98. 527 4. Weaver, W.M., P. Tseng, A. Kunze, M. Masaeli, A.J. Chung, J.S. Dudani, H. Kittur, R.P. 528 Kulkarni, and D. Di Carlo. 2014. Advances in high-throughput single-cell 529 microtechnologies. Curr. Opin. Biotechnol. 25: 114–23. 530 5. Tse, H.T.K., D.R. Gossett, Y.S. Moon, M. Masaeli, M. Sohsman, Y. Ying, K. Mislick, R.P. 531 Adams, J. Rao, and D. Di Carlo. 2013. Quantitative diagnosis of malignant pleural 532 effusions by single-cell mechanophenotyping. Sci. Transl. Med. 5: 212ra163. 533 6. Wirtz, D., K. Konstantopoulos, and P.C. Searson. 2011. The physics of cancer : the role 534 of physical interactions and mechanical forces in metastasis. Nat. Rev. Cancer. 11: 535 512–522. 536 7. Chowdhury, F., S. Na, D. Li, Y.-C. Poh, T.S. Tanaka, F. Wang, and N. Wang. 2010. 537 Material properties of the cell dictate stress-induced spreading and differentiation in 538 embryonic stem cells. Nat. Mater. 9: 82–8. 539 8. Gossett, D.R., H.T.K. Tse, S. a. Lee, Y. Ying, a. G. Lindgren, O.O. Yang, J. Rao, a. T. Clark, 540 and D. Di Carlo. 2012. Hydrodynamic stretching of single cells for large population 541 mechanical phenotyping. Proc. Natl. Acad. Sci. 109: 7630–7635. 542 9. Théry, M., and M. Bornens. 2008. Get round and stiff for mitosis. HFSP J. 2: 65–71. 543 10. Tsai, M.A., R.E. Waugh, and P.C. Keng. 1996. Cell cycle-dependence of HL-60 cell 544 deformability. Biophys. J. 70: 2023–9. 545 11. Suresh, S., J. Spatz, J.P. Mills, a Micoulet, M. Dao, C.T. Lim, M. Beil, and T. Seufferlein. 546 2005. Connections between single-cell biomechanics and human disease states: 547 gastrointestinal cancer and malaria. Acta Biomater. 1: 15–30. 548 12. Grover, W.H., A.K. Bryan, M. Diez-Silva, S. Suresh, J.M. Higgins, and S.R. Manalis. 2011. 549 Measuring single-cell density. Proc. Natl. Acad. Sci. U. S. A. 108: 10992–6. 550
13. Lam, W.A., M.J. Rosenbluth, and D.A. Fletcher. 2015. Brief report Chemotherapy 551 exposure increases leukemia cell stiffness. 109: 3505–3509. 552 14. Maeno, E., Y. Ishizaki, T. Kanaseki, a Hazama, and Y. Okada. 2000. Normotonic cell 553 shrinkage because of disordered volume regulation is an early prerequisite to 554 apoptosis. Proc. Natl. Acad. Sci. U. S. A. 97: 9487–92. 555 15. Pietuch, A., B.R. Brückner, and A. Janshoff. 2013. Membrane tension homeostasis of 556 epithelial cells through surface area regulation in response to osmotic stress. 557 Biochim. Biophys. Acta - Mol. Cell Res. 1833: 712–722. 558 16. Maroudas, A. 1979. Physicochemical properties of articular cartilage. In: Freeman 559 MAR, editor. Adult Articular Cartilage. Pitman Medical. pp. 215–290. 560 17. Schneiderman, R., D. Keret, and A. Maroudas. 1986. Effects of mechanical and osmotic 561 pressure on the rate of glycosaminoglycan synthesis in the human adult femoral 562 head cartilage: an in vitro study. J. Orthop. Res. 4: 393–408. 563 18. Bush, P.G., and A.C. Hall. 2001. The osmotic sensitivity of isolated and in situ bovine 564 articular chondrocytes. J. Orthop. Res. 19: 768–778. 565 19. Guilak, F., G.R. Erickson, and H.P. Ting-Beall. 2002. The effects of osmotic stress on 566 the viscoelastic and physical properties of articular chondrocytes. Biophys. J. 82: 567 720–7. 568 20. Go, W.Y., X. Liu, M.A. Roti, F. Liu, and S.N. Ho. 2004. NFAT5 ͞ TonEBP mutant mice 569 define osmotic stress as a critical feature of the lymphoid microenvironment. PNAS. 570 101: 10673–10678. 571 21. González-Cruz, R.D., V.C. Fonseca, and E.M. Darling. 2012. Cellular mechanical 572 properties reflect the differentiation potential of adipose-derived mesenchymal stem 573 cells. Proc. Natl. Acad. Sci. U. S. A. 109: E1523–9. 574 22. Lee, W.C., H. Shi, Z. Poon, L.M. Nyan, T. Kaushik, G. V Shivashankar, J.K.Y. Chan, C.T. 575 Lim, J. Han, and K.J. Van Vliet. 2014. Multivariate biophysical markers predictive of 576 mesenchymal stromal cell multipotency. Proc. Natl. Acad. Sci. U. S. A. 111: E4409–18. 577 23. Byun, S., S. Son, D. Amodei, N. Cermak, J. Shaw, J.H. Kang, V.C. Hecht, M.M. Winslow, T. 578 Jacks, P. Mallick, and S.R. Manalis. 2013. Characterizing deformability and surface 579 friction of cancer cells. Proc. Natl. Acad. Sci. U. S. A. 110: 7580–7585. 580 24. Boise, L.H., M. González-García, C.E. Postema, L. Ding, T. Lindsten, L.A. Turka, X. Mao, 581 G. Nuñez, and C.B. Thompson. 1993. bcl-x, a bcl-2-related gene that functions as a 582 dominant regulator of apoptotic cell death. Cell. 74: 597–608. 583
25. Burg, T.P., M. Godin, S.M. Knudsen, W. Shen, G. Carlson, J.S. Foster, K. Babcock, and S.R. 584 Manalis. 2007. Weighing of biomolecules, single cells and single nanoparticles in fluid. 585 Nature. 446: 1066–1069. 586 26. Limpert, E., W. a. Stahel, and M. Abbt. 2001. Log-normal Distributions across the 587 Sciences: Keys and Clues. Bioscience. 51: 341–352. 588 27. Bathe, M., A. Shirai, C.M. Doerschuk, and R.D. Kamm. 2002. Neutrophil transit times 589 through pulmonary capillaries: the effects of capillary geometry and fMLP-590 stimulation. Biophys. J. 83: 1917–33. 591 28. Gabriele, S., M. Versaevel, P. Preira, and O. Théodoly. 2010. A simple microfluidic 592 method to select, isolate, and manipulate single-cells in mechanical and biochemical 593 assays. Lab Chip. 10: 1459–1467. 594 29. Miermont, A., F. Waharte, S. Hu, M.N. McClean, S. Bottani, S. Léon, and P. Hersen. 2013. 595 Severe osmotic compression triggers a slowdown of intracellular signaling, which 596 can be explained by molecular crowding. Proc. Natl. Acad. Sci. U. S. A. 110: 5725–30. 597 30. Zhou, E.H., X. Trepat, C.Y. Park, G. Lenormand, M.N. Oliver, S.M. Mijailovich, C. Hardin, 598 D. a Weitz, J.P. Butler, and J.J. Fredberg. 2009. Universal behavior of the osmotically 599 compressed cell and its analogy to the colloidal glass transition. Proc. Natl. Acad. Sci. 600 U. S. A. 106: 10632–10637. 601 31. Anderson, N.G., W.W. Harris, A.A. Barber, C.T. Rankin, and E.L. Candler. 1966. 602 Separation of subcellular components and viruses by combined rate- and isopycnic- 603 zonal centrifugation. Natl. Cancer Inst. Monogr. 21: 253–283. 604 32. Panijpan, B. 1977. The Buoyant Density of DNA and the G + C Content. J. Chem. Educ. 605 54: 172–173. 606 33. Fischer, H., I. Polikarpov, and A.F. Craievich. 2004. Average protein density is a 607 molecular-weight-dependent function. Protein Sci. 13: 2825–2828. 608 34. Minton, A.P. 2006. How can biochemical reactions within cells differ from those in 609 test tubes? J. Cell Sci. 119: 2863–2869. 610 35. Al-Habori, M. 2001. Macromolecular crowding and its role as intracellular signalling 611 of cell volume regulation. Int. J. Biochem. Cell Biol. 33: 844–864. 612 36. Ellis, R.J. 2001. Macromolecular crowding: obvious but underappreciated. Trends 613 Biochem. Sci. 26: 597–604. 614
37. Bryan, A.K., V.C. Hecht, W. Shen, K. Payer, W.H. Grover, and S.R. Manalis. 2014. 615 Measuring single cell mass, volume, and density with dual suspended microchannel 616 resonators. Lab Chip. 14: 569–76. 617 38. Bryan, A.K., A. Goranov, A. Amon, and S.R. Manalis. 2010. Measurement of mass, 618 density, and volume during the cell cycle of yeast. Proc. Natl. Acad. Sci. 107: 999– 619 1004. 620 39. Steltenkamp, S., C. Rommel, J. Wegener, and A. Janshoff. 2006. Membrane stiffness of 621 animal cells challenged by osmotic stress. Small. 2: 1016–20. 622 40. Sung, K.L., G.W. Schmid-Schönbein, R. Skalak, G.B. Schuessler, S. Usami, and S. Chien. 623 1982. Influence of physicochemical factors on rheology of human neutrophils. 39: 624 101–106. 625 41. Spagnoli, C., A. Beyder, S. Besch, and F. Sachs. 2008. Atomic force microscopy analysis 626 of cell volume regulation. Phys. Rev. E. 78: 031916. 627 42. Kerrigan, M.J.P., C.S.V. Hook, A. Qusous, and A.C. Hall. 2006. Regulatory Volume 628 Increase (RVI) by In Situ and Isolated Bovine Articular Chondrocytes. J. Cell. Physiol. 629 209: 481–492. 630 43. Wakatsuki, T., B. Schwab, N.C. Thompson, and E.L. Elson. 2001. Effects of cytochalasin 631 D and latrunculin B on mechanical properties of cells. J. Cell Sci. 114: 1025–1036. 632 44. King, J.T., E.J. Arthur, C.L. Brooks, and K.J. Kubarych. 2014. Crowding induced 633 collective hydration of biological macromolecules over extended distances. J. Am. 634 Chem. Soc. 136: 188–194. 635 45. Bertrand, R., E. Solary, P. O’Connor, K.W. Kohn, and Y. Pommier. 1994. Induction of a 636 common pathway of apoptosis by staurosporine. Exp. Cell Res. 211: 314–321. 637 46. Bruno, S., B. Ardelt, J.S. Skierski, F. Traganos, and Z. Darzynkiewicz. 1992. Different 638 effects of staurosporine, an inhibitor of protein kinases, on the cell cycle and 639 chromatin structure of normal and leukemic lymphocytes. Cancer Res. 52: 470–473. 640 47. Tee, A.R., and C.G. Proud. 2002. Caspase cleavage of initiation factor 4E-binding 641 protein 1 yields a dominant inhibitor of cap-dependent translation and reveals a 642 novel regulatory motif. Mol. Cell. Biol. 22: 1674–1683. 643 48. Straight, A.F., A. Cheung, J. Limouze, I. Chen, N.J. Westwood, J.R. Sellers, and T.J. 644 Mitchison. 2003. Dissecting temporal and spatial control of cytokinesis with a myosin 645 II Inhibitor. Science. 299: 1743–1747. 646
49. Laporte, J.D., P.E. Moore, R.A. Panettieri, W. Moeller, J. Heyder, S.A. Shore, D. Johanne, 647 and A. Reynold. 1998. Prostanoids mediate IL-1-beta-induced beta-adrenergic 648 hyporesponsiveness in human airway smooth muscle cells. Am J Physiol. 275: 491– 649 501. 650 50. Tang, D., J.M. Lahti, J. Grenet, and V.J. Kidd. 1999. Cycloheximide-induced T-cell death 651 is mediated by a Fas-associated death domain-dependent mechanism. J. Biol. Chem. 652 274: 7245–52. 653 51. Mattson, M.P., and K. Furukawa. 1997. Anti-apoptotic actions of cycloheximide : 654 blockade of programmed cell death or induction of programmed cell life ? Apoptosis. 655 2: 257–264. 656 52. Okuda, a, and G. Kimura. 1988. Non-specific elongation of cell cycle phases by 657 cycloheximide in rat 3Y1 cells, and specific reduction of G1 phase elongation by 658 simian virus 40 large T antigen. J. Cell Sci. 91 ( Pt 2): 295–302. 659 53. Liu, X., J.-M. Yang, S.S. Zhang, X.-Y. Liu, and D.X. Liu. 2010. Induction of cell cycle 660 arrest at G1 and S phases and cAMP-dependent differentiation in C6 glioma by low 661 concentration of cycloheximide. BMC Cancer. 10: 684. 662 54. Thoreen, C.C., and D.M. Sabatini. 2009. Rapamycin inhibits mTORC1 , but not 663 completely. Autophagy. 5: 725–726. 664 55. Terada, N., H.R. Patel, K. Takase, K. Kohno, a C. Nairn, and E.W. Gelfand. 1994. 665 Rapamycin selectively inhibits translation of mRNAs encoding elongation factors and 666 ribosomal proteins. Proc. Natl. Acad. Sci. U. S. A. 91: 11477–11481. 667 56. Castellano, F., C.L. Clainche, D. Patin, M.F. Carlier, and P. Chavrier. 2001. A WASp-668 VASP complex regulates actin polymerization at the plasma membrane. EMBO J. 20: 669 5603–5614. 670 57. Kuehn, H.S., M.Y. Jung, M.A. Beaven, D.D. Metcalfe, and A.M. Gilfillan. 2011. 671 Prostaglandin E2 activates and utilizes mTORC2 as a central signaling locus for the 672 regulation of mast cell chemotaxis and mediator release. J. Biol. Chem. 286: 391–402. 673 58. Thoreen, C.C., S.A. Kang, J.W. Chang, Q. Liu, J. Zhang, Y. Gao, L.J. Reichling, T. Sim, D.M. 674 Sabatini, and N.S. Gray. 2009. An ATP-competitive mammalian target of rapamycin 675 inhibitor reveals rapamycin-resistant functions of mTORC1. J. Biol. Chem. 284: 8023– 676 8032. 677 59. Thomas, G., and M.N. Hall. 1997. TOR signalling and control of cell growth. Curr. Opin. 678 Cell Biol. 9: 782–787. 679
60. Feijó Delgado, F., N. Cermak, V.C. Hecht, S. Son, Y. Li, S.M. Knudsen, S. Olcum, J.M. 680 Higgins, J. Chen, W.H. Grover, and S.R. Manalis. 2013. Intracellular water exchange for 681 measuring the dry mass, water mass and changes in chemical composition of living 682 cells. PLoS One. 8: e67590. 683 684