Publisher’s version / Version de l'éditeur:
Vous avez des questions? Nous pouvons vous aider. Pour communiquer directement avec un auteur, consultez la
première page de la revue dans laquelle son article a été publié afin de trouver ses coordonnées. Si vous n’arrivez
Questions? Contact the NRC Publications Archive team at
PublicationsArchive-ArchivesPublications@nrc-cnrc.gc.ca. If you wish to email the authors directly, please see the first page of the publication for their contact information.
https://publications-cnrc.canada.ca/fra/droits
L’accès à ce site Web et l’utilisation de son contenu sont assujettis aux conditions présentées dans le site LISEZ CES CONDITIONS ATTENTIVEMENT AVANT D’UTILISER CE SITE WEB.
Research Report (National Research Council of Canada. Institute for Research in
Construction), 2011-10-31
READ THESE TERMS AND CONDITIONS CAREFULLY BEFORE USING THIS WEBSITE.
https://nrc-publications.canada.ca/eng/copyright
NRC Publications Archive Record / Notice des Archives des publications du CNRC :
https://nrc-publications.canada.ca/eng/view/object/?id=914ca4f0-7fbc-4388-8f91-903987d4ac53 https://publications-cnrc.canada.ca/fra/voir/objet/?id=914ca4f0-7fbc-4388-8f91-903987d4ac53
NRC Publications Archive
Archives des publications du CNRC
For the publisher’s version, please access the DOI link below./ Pour consulter la version de l’éditeur, utilisez le lien DOI ci-dessous.
https://doi.org/10.4224/20375058
Access and use of this website and the material on it are subject to the Terms and Conditions set forth at
Fire incidents in single- and two-family dwellings: a survey in Calgary,
Edmonton, Lethbridge and Ottawa
FIRE INCIDENTS IN SINGLE-
AND TWO-FAMILY DWELLINGS
— A Survey in Calgary,
Edmonton, Lethbridge and
Ottawa
IRC-RR-320
October 31
st, 2011
Authors: Joseph Z. Su
Fire Research Program
ACKNOWLEDGMENTS
The author gratefully acknowledges the City of Calgary for its financial and technical support to this survey, and fire services in Calgary, Edmonton, Lethbridge and Ottawa for their participation in the survey.
The author would like to acknowledge Philip Rizcallah, Ian Henderson and Cameron McCartney for inputs to the design of the survey, and Lisette Séguin for data entry.
ABSTRACT
A six-month survey was conducted in Calgary, Edmonton, Lethbridge and Ottawa, covering fire incidents involving single-family and two-family homes which took place between January and June 2011. A total of 168 fire incidents were reported in this period. These included fire incidents involving 129 detached single-family (77% of the incidents) and 39 semi-detached two-family homes (23% of the incidents).
Approximately 60% of the fire incidents occurred in houses 25 years or older. Peak hours for the fire incidents to occur were between 16:00 and 20:00. The top three areas of fire origins were kitchen (28%), building exterior (20%) and basement (12%). No sprinkler system was reportedly installed in any of the houses reported in this survey.
Three fire incidents resulted in one civilian fatality each. The fatal fires originated from the living room in two incidents and from the balcony in the third incident. No smoke alarm was installed in the two houses with the living room fire origin.
Eight percent [N=13] of the fire incidents resulted in 17 civilian injuries and one firefighter injury. Among them, 13% [N=6] of the kitchen fires resulted in 7 civilian injuries; 20% [N=4] of the basement fires resulted in 7 civilian injuries; and 7% [N=1] of the bedroom fires resulted in 2 civilian injuries. The fatal fire that originated from the exterior balcony also caused one civilian injury. The single firefighter injury resulted from a fire originating in the attic. Smoke alarms were operational and activated at the time of the fire incident in 62% [N=8] of these 13 houses. The leading cause of ignition, 20%, was cooking equipment/activities with cooking oil or grease as the first item ignited. Other significant causes of ignition included electrical malfunction (15%), smoking materials (9%), lightning strikes (5%), arson and suspected arson (5%), open flames (4%), candles (4%), design and/or maintenance errors (4%), and heating equipment (3%).
Most of the exterior fires were caused by smoking materials and lightning. The first items ignited by smoking materials included trees, bushes, grass, straw, leaves, peat moss, plastic planters, compost bins, organic materials/fuels, decks and garbage. There were lightning strikes igniting roofs, exterior walls, chimneys and clothes lines.
The total estimated property loss was $17.7 million for the 168 fire incidents. Among them, 17 fire incidents resulted in total loss of the houses with over $9.5 million, in which two fire incidents involved multiple houses under construction and resulted in a loss of more than $1.1 million (representing more than 6% of the total property losses from all incidents). Eleven fire incidents involved adjacent buildings (less than 7% of the total numbers of fire incidents) and accounted for 22% of the total property losses from all incidents.
FIRE INCIDENTS IN SINGLE- AND TWO-FAMILY DWELLINGS
— A Survey in Calgary, Edmonton, Lethbridge and Ottawa
Joseph Z. Su Fire Research Program
Institute for Research in Construction National Research Council of Canada
Introduction
In collaboration with the City of Calgary and fire services in Calgary, Edmonton, Lethbridge and Ottawa, the National Research Council (NRC) conducted a survey from January to June 2011 to collect information on fire incidents in detached single-family and semi-detached two-family homes. The survey sought to identify numbers and trends in fire incidents, fatalities and injuries within these homes.
This report documents the results of the survey, including the design of a questionnaire, information gathered and data analysis. The information presented in this report may help assess and identify trends and appropriate mitigating measures.
Questionnaire for the Survey
NRC developed a questionnaire for the survey in consultation with the City of Calgary Building Regulations and the Ottawa Fire services. The questionnaire (see page 2) consists of a series of short questions on the fire incidents in detached single-family and semi-detached two-family homes. The questionnaire was designed to be completed online, using the e-form or paper form.
The survey was administered by the participating fire departments in Calgary, Edmonton, Lethbridge and Ottawa. Each time after the participating fire departments responded to a fire incident involving a detached single-family home or semi-detached two-family home, they completed the survey questionnaire. A total of 168 completed questionnaires (76 from Calgary, Edmonton and Lethbridge; 92 from Ottawa) were received from the four fire services for the six-month survey.
Results
Among the 168 questionnaires received, 127 questionnaires were completed using the e-form; 27 completed online; and 14 completed using the paper form. Information gathered over the six-month period is analyzed. Results are provided in this section.
In any future survey, responses online should be encouraged since the other modes give more chances for incomplete submission (the web survey questionnaire has control mechanism such that it cannot be submitted until all required information is entered). Survey design should tailor more closely to the intended purpose and use the “other” and “unknown” choices carefully.
Time distribution of fire incidents
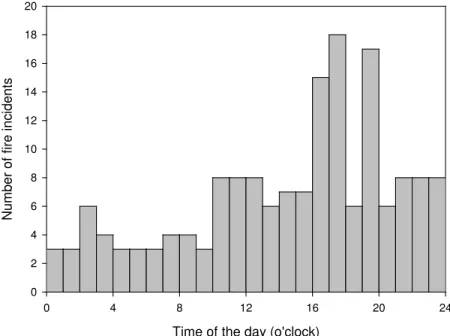
Figure 1 shows the distribution of fire incidents over time of the day. It appears that, to a certain extent, the number of fire incidents was associated with human activities. There were lower numbers of fire incidents during the sleeping hours; the highest numbers occurred from 16:00 to 20:00.
Time of the day (o'clock)
0 4 8 12 16 20 24 N um ber of f ir e inc ident s 0 2 4 6 8 10 12 14 16 18 20
Figure 1. Number of fire incidents versus time of the day.
Fire department response times
In this survey, the fire department response time was defined as the time from an emergency call received at the station until the arrival of the first unit on scene. For 89% [N=150] of the 168 fire incidents, the fire department response times were less than 10 minutes. The response times for 8% [N=13] incidents were between 10 to 15 minutes. The response time for one incident was between 15 to 20 minutes. There were four incidents for which the response times were not reported (two indicated as “other” and two left blank in the questionnaires).
Characteristics of dwellings involved
Based on the 168 questionnaires received during the period of this survey, 77% [N=129] of fire incidents involved single-family houses and 23% [N=39] involved two-family houses. Fifty three percent [N=90] of these fire incidents were indentified to have occurred with wood frame
construction (all reported fire incidents from Alberta occurred in wood frame construction). The Type of construction for the remaining fire incidents [N=78] were not reported (left blank in the questionnaires).
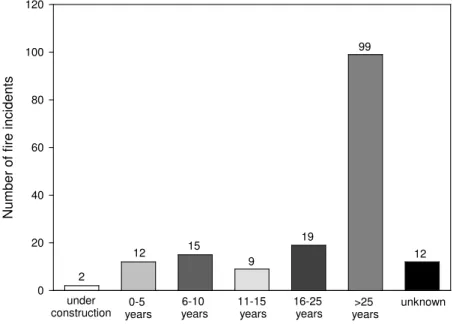
In terms of the height of the dwellings of fire origin, 60% [N=101] of these houses were two storeys in height, 32% [N=54] were one storey in height, 3% [N=5] were three storeys in height and 5% [N= 8] were of unknown height. Note, that only 20% [N= 20] of the two-storey houses and 31% [N=17] of the one-storey houses were identified as having a basement level, and 2% [N=2] two-storey houses as having no basement. The rest of the houses involved did not report whether they had a basement level. Figure 2 and Figure 3 show the number of houses involved in fire incidents versus the estimated ages and exterior finishes of the houses, respectively. Neither vinyl over gypsum nor brick, block or stone was reported as the exterior finish in the returned questionnaires.
Estimated age of houses (years)
N um ber of f ir e inc ident s 0 20 40 60 80 100 120 2 12 15 9 19 99 12 under construction years0-5 6-10 years 11-15 years 16-25 years >25 years unknown
Exterior finish of houses N um ber of hous es 0 20 40 60 80 100 39 1 21 11 3 95 Vinyl over OSB or plywood Vinyl over non-combustible Stucco Wood or composite Aluminium or other metals Other or unreported
Figure 3. Number of houses involved in fire incidents versus exterior finish.
Fire protection devices – smoke alarms and sprinklers
Among the 168 fire incidents, 22% [N=37] of the houses had one smoke alarm installed and 52% [N= 88] of these houses had one smoke alarm on each floor in the house.
Fourteen percent [N=23] of the fire incidents involved houses in which no smoke alarms were installed. Most of these were either more than 25 years old or under construction.
Information on smoke alarms was not reported for 12% [N=20] of the houses. Nearly half of the fire incidents involving these houses were exterior fires.
Overall 74% [N=125] of the houses had at least one smoke alarm installed at some point in the house. Of these 125 houses, 51% [N=64] had battery operated smoke alarms, 42% [N=52] had hardwired in alarms and of these 30% [N=16] were interconnected. The smoke alarms were operational in 79% [N=99] of the houses and had been activated in 63% [N=79] of the houses at the time of fire incidents.
No sprinkler was reportedly installed in any of the houses involved in the fire incidents (92% [N=155] of the houses reportedly had no sprinklers; 8% [N=13] houses had no reports on whether sprinklers were installed or not).
Origins of fires
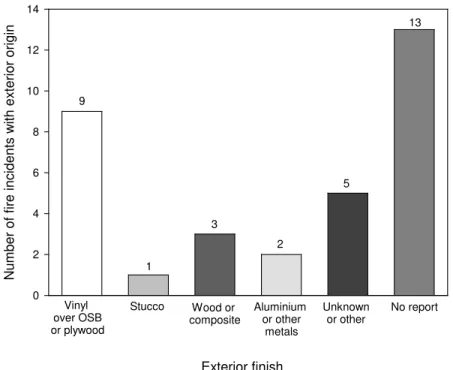
Figure 4 shows fire origins and their respective number of fire incidents. The top three origins of fires were kitchen (28%), exterior (20%) and basement (12%). Note that seven of the 20 fire incidents with the basement fire origin were identified as having a basement level. Figure 5
shows the number of fire incidents with exterior as the fire origin and the respective exterior finish. Origin of fire N um ber of f ir e inc ident s 0 10 20 30 40 50 47 14 9 20 1 28 K itc hen B edr oom Li vi ng room Att ic B as em ent A tt ac hed gar age 9 7 33 D et ac hed gar age E x ter ior O ther or unr epor ted
Figure 4. Number of fire incidents versus origin of fires.
Exterior finish N um ber of f ir e inc ident s w it h ex ter ior or ig in 0 2 4 6 8 10 12 14 9 1 2 13 3 5 Vinyl over OSB or plywood Stucco Wood or composite Aluminium or other metals Unknown or other No report
Fatalities and injuries
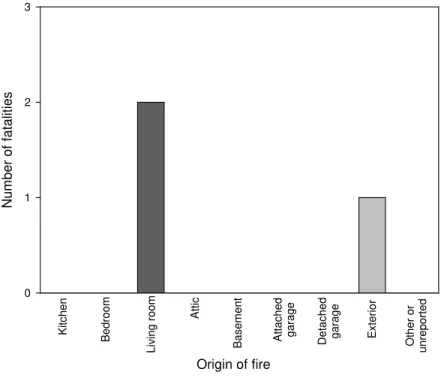
There were three fire incidents which resulted in one civilian fatality each. As shown in Figure 6, the fatal fires originated from the living room in two incidents and from the balcony in the third incident (the fire with balcony origin also caused one civilian injury). (The third fatal fire incident was originated from the balcony because the balcony was reported as the first item ignited.) The three houses were all more than 25 years old and no smoke alarm was installed in the two houses with the living room fire origin. The balcony originated fire started in the early morning. The fire department response time was less than 10 minutes for all of these three fire incidents.
Origin of fire N um ber of f at al it ies 0 1 2 3 K itc hen B edr oom Li vi ng room Att ic B as em ent A tt ac hed gar age D et ac hed gar age E x ter ior O ther or unr epor ted
Figure 6. Number of fire fatalities versus origin of fires.
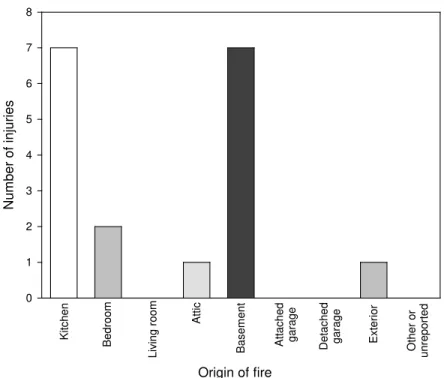
Eight percent [N=13] of the fire incidents resulted in 17 civilian injuries and one firefighter injury that required treatment. Smoke alarms were operational and activated at the time of the fire incidents in 62% [N=8] of these 13 houses; smoke alarms were not operational and did not activate in 15% [N=2] of these houses, and no smoke alarm was installed in 23% [N=3] of these houses. The fire department response time was less than 10 minutes for 77% [N=10] of these fire incidents, between 10 to 15 minutes for 15% [N=2] fire incidents, and unreported for one fire incident.
As shown in Figure 7, 13% [N=6] of the kitchen fires with cooking oil or grease as the first item ignited resulted in 7 civilian injuries; 20% [N=4] of the basement fires resulted in 7 civilian injuries; and 7% [N=1] of the bedroom fires with bedding as the first item ignited resulted in 2 civilian injuries. The single firefighter injury resulted from a fire originating in the attic. The fatal fire originated from the exterior balcony also caused one civilian injury.
Origin of fire N um ber of i nj ur ies 0 1 2 3 4 5 6 7 8 K itc hen B edr oom Li vi ng room Att ic B as em ent A tt ac hed gar age D et ac hed gar age E x ter ior O ther or unr epor ted
Figure 7. Number of fire injuries versus origin of fires.
Property losses
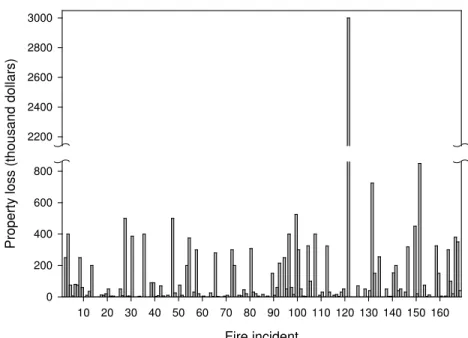
Figure 8 shows the estimated value of property loss for each fire incident. The total estimated property loss was $17.7 million for the 168 fire incidents. Ten percent [N=17] of the fire incidents resulted in the total destruction of the houses involved with over $9.5 million in property losses, which included the total destruction of multiple houses under construction in two fire incidents with more than $1.1 million in losses. There were 11 fire incidents that spread to adjacent buildings, which resulted in $3.9 million in property losses. Figure 9 shows fire origins and the respective property losses.
Fire incident 10 20 30 40 50 60 70 80 90 100 110 120 130 140 150 160 P roper ty l os s ( thous and dol lar s ) 0 200 400 600 800 2200 2400 2600 2800 3000
Figure 8. Estimated value of property loss for each incident (in thousand dollars).
Origin of fire P roper ty l os s ( thous and dol lar s ) 0 1000 2000 3000 4000 5000 $2.34M $1.63M $4.38M $1.35M $0.10M $2.32M K itc hen B edr oom Li vi ng room Att ic B as em ent A tt ac hed gar age $1.96M $0.30M $3.31M D et ac hed gar age E x ter ior O ther or unr epor ted
Causes of ignition
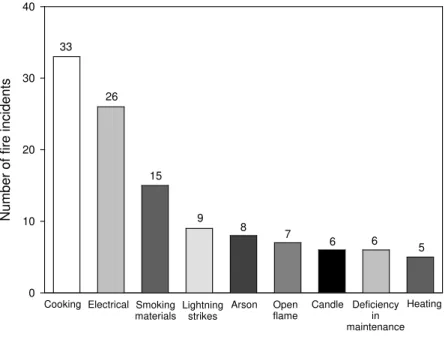
Figure 10 shows causes of ignition and the respective number of fire incidents. The top three causes of ignition were cooking (20%, N=33), electrical malfunction (15%, N=26) and smoking materials (9%, N=15). Cooking as the leading ignition source included both equipment and human error such as unattended cooking oil. Eighty percent of the fires that started by smoking materials happened outside the houses (including in the garages). Lightning strikes (5%, N=9) was the number 4 cause of ignition along with arson or suspected arson (5%, N=8).
In addition, there were other causes of ignition. These included open flames (4%, N=7), candles (4%, N=6), design and/or maintenance errors (4%, N=6) and heating equipment (3%, N=5). The causes of ignition for the remaining fire incidents (31%, N=53) were unknown (marked as other) or left blank in the questionnaires.
Cause of ignition N um ber of f ir e inc ident s 0 10 20 30 40 15 33 8 26 5 Smoking materials
Cooking Electrical Lightning Heating
strikes 6 9 6 7 Open flame
Arson Candle Deficiency in maintenance
Figure 10. Number of fire incidents versus cause of ignition.
The leading first item ignited was cooking oil or grease, which led to 17% [N= 28] of all fire incidents. Other items first ignited in kitchen fires included plastic Tupperware, towel, etc. which were left on, or too close to, the stove. There were also a few cases of burners, ovens and dishwashers being the first items ignited.
Common first items ignited in bedroom fires included mattresses, pillows and beddings ignited by candles, smoking materials and electrical malfunction. Books, magazines, papers and carpet also became the first items ignited in a few incidents.
In fire incidents with living rooms as the fire origin, chimneys/flue pipes of fireplaces and wood burning stoves were often the first items ignited. Other items which first caught fire in the living room included couch fabric and stored materials.
There were fire incidents started with insulation in the attic due to fireplace chimney, electrical wiring and lightning strike.
For the fires that originated in the basement, the first items ignited included various combustibles: stored materials and boxes, papers/wrappers, wood, fabrics, carpet/rugs, plastics, dryers, electrical wiring and insulation, solvents, gasoline, spray can, etc. Common ignition sources were heating, electrical malfunction and smoking materials.
In garages, the first items ignited included electrical cord, paper, exposed vapour barrier, gardening and agricultural products. There was one incident where chemical reactions from stored organic materials, gardening and agricultural products caused a fire.
Most of the exterior fires were caused by smoking materials and lightning. The first items ignited by smoking materials included trees, bushes, grass, straw, leaves, peat moss, plastic planters, compost bins, organic materials/fuels, decks and garbage. There were lightning strikes igniting roofs, exterior walls, chimneys and clothes lines. Other first items ignited included porches or balconies, electric insulation and barbecues in the exterior originated fires.
Extent of fire spread
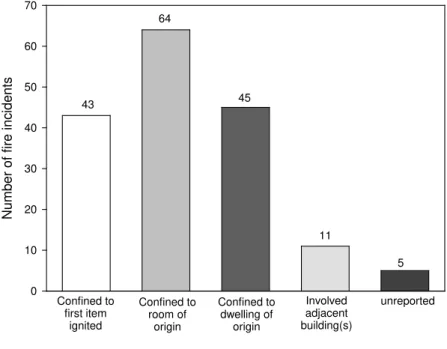
Figure 11 shows the extent of fire spread and the respective number of fire incidents. More than 90% [N=152] of the fire incidents did not spread to the neighbouring buildings.
Extent of fire spread
N um ber of f ir e inc ident s 0 10 20 30 40 50 60 70 43 64 45 11 5 Confined to first item ignited Confined to room of origin Confined to dwelling of origin Involved adjacent building(s) unreported
Figure 11. Number of fire incidents versus extent of fire spread.
There were 11 fire incidents that involved adjacent buildings. They accounted for less than 7% of the total number of the fire incidents but 22% of the total property losses from all incidents.
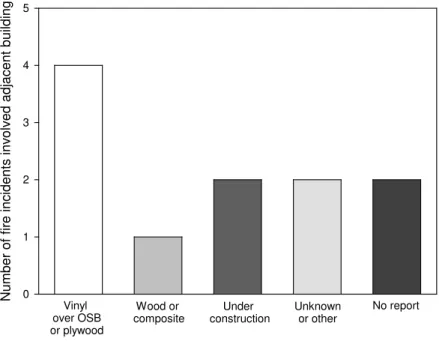
Figure 12 shows the exterior finishes of the buildings involved in the fire spread. The fire department response times were less than 10 minutes for these 11 fire incidents.
Exterior finish N um ber of f ir e inc ident s i nv ol ved adj ac ent bui ldi ng 0 1 2 3 4 5 Vinyl over OSB or plywood Wood or composite Under construction Unknown or other No report
Figure 12. Number of fire incidents that spread to adjacent buildings versus exterior finishes.
Summary
1. A six-month survey was conducted in Calgary, Edmonton, Lethbridge and Ottawa, covering fire incidents involving single-family and two-family homes which took place between January and June 2011. A total of 168 fire incidents were reported in this period. These included fire incidents involving 129 detached single-family (77% of the incidents) and 39 semi-detached two-family homes (23% of the incidents).
2. Approximately 60% of the fire incidents occurred in houses 25 years or older. Peak hours for the fire incidents to occur were between 16:00 and 20:00. The top three areas of fire origins were kitchen (28%), building exterior (20%) and basement (12%). No sprinkler system was reportedly installed in any of the houses reported in this survey.
3. Three fire incidents resulted in one civilian fatality each. The fatal fires originated from the living room in two incidents and from the balcony in the third incident. No smoke alarm was installed in the two houses with the living room fire origin.
4. Eight percent [N=13] of the fire incidents resulted in 17 civilian injuries and one firefighter injury. Among them, 13% [N=6] of the kitchen fires resulted in 7 civilian injuries; 20% [N=4] of the basement fires resulted in 7 civilian injuries; and 7% [N=1] of the bedroom fires resulted in 2 civilian injuries. The fatal fire that originated from the exterior balcony also caused one civilian injury. The single firefighter injury resulted from a fire originating in the attic. Smoke alarms were operational and activated at the time of the fire incident in 62%
[N=8] of these 13 houses.
5. The leading cause of ignition, 20%, was cooking equipment/activities with cooking oil or grease as the first item ignited. Other significant causes of ignition included electrical malfunction (15%), smoking materials (9%), lightning strikes (5%), arson and suspected arson (5%), open flames (4%), candles (4%), design and/or maintenance errors (4%), and heating equipment (3%).
6. Most of the exterior fires were caused by smoking materials and lightning. The first items ignited by smoking materials included trees, bushes, grass, straw, leaves, peat moss, plastic planters, compost bins, organic materials/fuels, decks and garbage. There were lightning strikes igniting roofs, exterior walls, chimneys and clothes lines.
7. The total estimated property loss was $17.7 million for the 168 fire incidents. Among them, 17 fire incidents resulted in total loss of the houses with over $9.5 million, in which two fire incidents involved multiple houses under construction and resulted in a loss of more than $1.1 million (representing more than 6% of the total property losses from all incidents). Eleven fire incidents involved adjacent buildings (less than 7% of the total numbers of fire incidents) and accounted for 22% of the total property losses from all incidents.