HAL Id: hal-01608051
https://hal.archives-ouvertes.fr/hal-01608051
Submitted on 26 May 2020HAL is a multi-disciplinary open access
archive for the deposit and dissemination of sci-entific research documents, whether they are pub-lished or not. The documents may come from teaching and research institutions in France or abroad, or from public or private research centers.
L’archive ouverte pluridisciplinaire HAL, est destinée au dépôt et à la diffusion de documents scientifiques de niveau recherche, publiés ou non, émanant des établissements d’enseignement et de recherche français ou étrangers, des laboratoires publics ou privés.
Copyright
Identifying foods with good nutritional quality and price
for the Opticourses intervention research project
Christophe Dubois, Marion Tharrey, Nicole Darmon
To cite this version:
Christophe Dubois, Marion Tharrey, Nicole Darmon. Identifying foods with good nutritional quality and price for the Opticourses intervention research project. Public Health Nutrition, Cambridge University Press (CUP), 2017, 20 (17), pp.1-9. �10.1017/S1368980017002282�. �hal-01608051�
Version postprint
Title: Identifying foods with good nutritional quality and price for the Opticourses interventional research project
Christophe Dubois1, Marion Tharrey1, Nicole Darmon1
1 INRA 1110, CIRAD, SupAgro, CIHEAM-IAMM, MOISA (Markets, Organizations, institutions and Strategies of Actors), Montpellier, France
Correspondence Address: Nicole Darmon, UMR Moisa, Campus Inra-SupAgro de la Gaillarde ; 2, place Pierre Viala - Bât. 26 ; 34060 Montpellier Cedex 2. Telephone number: +33 633189586. Email address: nicole.darmon@ inra.fr (ND)
Short title: Foods with good nutritional quality and price
Acknowledgments: The authors would like to thank everyone involved in the “Demand” section of the Opticourses intervention: Hind Gaigi (project leader), Malu-Séverine Gaubard and Audrey Maidon (contributors), Audrey Lesturgeon (administrator), Maëlle Robert, Joséphine Rohaut and Lucile Marty (students), Célia Chischportich (external evaluator) and Valérie Leblanc (graphic designer) as well everyone who participated in the workshops and all those who work in the organisations where the workshops were held.
Financial support: After two innovative actions funded by the ARS-PACA in 2010 and 2011, Opticourses received funding for 2 years from the Institut National du Cancer (INCa), and since September 2014 has been funded by the ARS-PACA to study its transferability on a regional scale. The funding organizations had no role in the design, analysis or writing of this article.
Conflict of Interest: None.
Authorship: ND and CD designed the study. ND provided databases essential for the research. ND provided methodological support for data analyses. CD and MT analyzed data, performed statistical analysis and wrote the first draft of the manuscript. All authors had full access to data and revised and approved the manuscript for publication. ND and CD have primary responsibility for final content.
Ethical Standards Disclosure: The protocol of the Opticourses education intervention was reviewed by the Comité de Protection des Personnes Sud-Méditerranée which stated that no institutional review board approval was necessary for this research. Written informed consent
Version postprint
was obtained from all participants at enrolment and the trial was registered at
clinicaltrials.gov as NCT02383875.
ABSTRACT 1
Objective: People on a limited budget want to know the “good price” of foods. Here we 2
report the methodology used to produce an educational tool designed to help recognize foods 3
with good nutritional quality and price, and assess the validity and relevancy of the tool.
4
Design: A ‘Good Price Booklet’ presenting a list of foods with good nutritional quality and 5
price was constructed. The validity of the in-booklet prices was assessed by comparing them 6
to prices actually paid by households from the Opticourses project. The relevancy of the 7
booklet tool was assessed by semi-structured interviews with Opticourses participants. 8
Setting: Socioeconomically disadvantaged neighbourhoods of Marseille, France. 9
Subjects: 91 participants collected household food-purchase receipts over a 1-mo period. 10
Results: Based on the French food database, foods with higher-than-median nutritional 11
quality were identified. After grouping similar foods, a list of one hundred foods were 12
selected and their corresponding in-booklet prices were derived based on the distribution of 13
average national prices by food group. Household food purchases data revealed that of the 14
2386 purchases of foods listed in the booklet, 67.1% were bought at prices lower than the in-15
booklet prices. Nineteen semi-structured interviews showed that participants understood the 16
tool and most continued using it more than a month after the intervention. 17
Conclusions: A method was developed to ease the identification of foods with good 18
nutritional quality and price. The Good Price Booklet is an effective tool to help guide people 19
shopping on a low budget. 20
21
Keywords: food, food budget, food prices, good nutritional quality and price, intervention 22
research 23
Abbreviations: Nutritional Quality for Price (NQP); month (mo); Recommended Daily 24
Intake (RDI). 25
Version postprint
INTRODUCTION 26
Studies suggest that the cost of food helps explain social inequalities in nutrition(1-3), partly
27
due to the direct relationship between diet quality and diet cost(4;5). Energy-dense
nutrient-28
poor foods are often the cheapest sources of calories(6), making it more difficult for a person
29
with a very limited budget to get a balanced diet(7;8). However, healthy eating at low cost is
30
achievable by making nutritionally optimal choices that target affordable nutrient-rich foods
(9-31
13)
. Diet modelling approaches on French data showed that it is possible to get a balanced food 32
basket with a modest budget of at least €3.50 per day per person(8;14) on condition that foods
33
with good nutritional quality for price (NQP)—assessed as the relationship between nutrient 34
profile and average national price—are selected(12). In short, getting a balanced diet on a small
35
budget is difficult but not impossible, but is it realistic, and how do we translate theory into 36
practice? To find out, the Opticourses intervention (www.opticourses.fr) was launched in 37
2012 in the northern neighbourhoods of Marseille (France) following two pilot actions 38
conducted in 2010 and 2011. Within the framework of a multi-partner, territorial-community 39
participative approach, the Opticourses project features supply-side and demand-side strands, 40
both aimed at increasing purchases of good-NQP foods by financially struggling households. 41
The demand side of the intervention involved workshops on diet and budget attended on a 42
voluntary basis by local inhabitants responsible for their household’s food purchases(15). The
43
supply side was based on a social marketing intervention that aimed to make good-NQP foods 44
accessible, visible and attractive in shops in the target neighbourhoods(16).
45
Consistent with the existing literature, early exploration of the factors driving food purchases 46
in the Opticourses population revealed that price was a major concern(16), and that participants
47
expressed a strong desire to know “the good price” for foods. This popular notion refered to 48
an affordable price given a low food budget, within the range of market prices(17). The
49
research team thus made it its goal to operationalize this popular notion by co-constructing an 50
educational tool called the ‘Good Price Booklet’, designed to help participants make sound 51
combined nutritional and budgetary choices at the time of purchase. 52
The aim of this article is to describe the methodology used to produce the Good Price Booklet 53
and to provide quantitative and qualitative assessments of its applicability, perception and use
54
by the target public. 55
Version postprint
MATERIAL AND METHODS
56
Study design and population
57
Details and characteristics of the “Opticourses” nutrition intervention (2012–2014) have been 58
described elsewhere(15). Participants facing financial problems and willing to participate in the
59
“Demand” strand of the intervention were asked to provide a detailed record of foods entering 60
their household over a 1-mo period. In-depth interviews were also conducted to understand 61
the factors driving food purchases in this population(16).
62 63
Methodology to create the Good Price Booklet
64
Food composition and price databases 65
The INCA2 food composition table covering 1,343 foods declared as having been consumed 66
over one week by a representative sample of 2,624 adults who participated in the French 67
national INCA2 survey in 2006–2007 was used. In addition to energy content and around 30 68
nutritional components, the composition table included two variables obtained during a 69
previous study(18): one column for added sugars and one column for average national prices
70
(calculated on the basis of purchases made by the 2006 Kantar consumer panel). The food 71
composition table gives nutritional values for foods as consumed, and average national prices 72
are expressed in € for 100g as consumed. However, here we needed to determine the price of 73
foods as purchased, as this is the only relevant information to communicate to participants. 74
We therefore used correction coefficients enabling us to move from price of food consumed 75
to price of purchase (e.g. the average price of 100g of cooked pasta was multiplied by a 76
coefficient of 3 to obtain the average price of 100g of raw pasta). 77
78
SAIN and LIM calculations 79
SAIN and LIM are indicators that estimate foods’ positive and negative aspects, 80
respectively(19). SAIN estimates the adequacy, for 100kcal of food, for recommended daily
81
intake (RDI) of protein, vitamin C, fibre, calcium and iron. LIM estimates the average excess, 82
for 100g of food, of sodium, saturated fatty acids and added simple sugars. The SAIN/LIM 83
ratio give a single indicator of nutritional quality: the higher the ratio of a food, the better its 84
nutritional quality(12). In the specific case of a food having a LIM of less than 1, we consider
85
that the SAIN/LIM ratio is equal to the food’s SAIN. SAIN/LIM ratio was calculated for all 86
the foods in the INCA2 composition table. 87
Version postprint
Definition of foods with good nutritional quality 89
The next stage of the analysis was carried out on a reduced composition table covering all the 90
foods of the INCA2 table including fortified foods and foods described as “generic” (e.g. 91
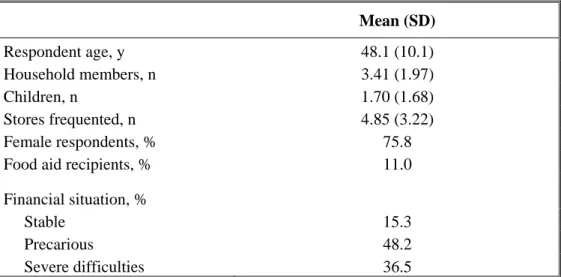
“non-specified fruit” or “non-specified cheese”) but excluding ready-made meals (due to their 92
huge variability in composition), alcoholic beverages and zero-calorie beverages. Foods 93
whose SAIN/LIM ratio was higher than the median calculated in this reduced table were 94
considered to be of good nutritional quality 95
96
Determination of the good prices for foods of good nutritional quality
97
Each food of good nutritional quality was then attributed a good price, defined as the price 98
below which the food can be considered as relatively inexpensive. To determine this price, 99
two variables were used: the average national price of the food as purchased, and its “limit 100
price” defined as equal to the value of the first price tertile of the group to which it belongs. 101
For each food, the average national price was then compared against the limit price, and the 102
following rule was applied: when average national price was below limit price, then average 103
national price was selected as the good price; if not, limit price was chosen instead. 104
105
Selection and grouping of foods of good nutritional quality and price for the Good Price 106
Booklet 107
Based on the calculations described above, a list of foods with good nutritional quality and 108
price was established to be communicated to workshop participants in the form of an 109
educational tool called the ‘Good Price Booklet’. To avoid communicating prices that were 110
unrealistic as too low with regard to marketplace reality, it was decided to present only those 111
foods whose average national price was no more than 2.5 times higher than the limit price. 112
The ratio of 2.5 was chosen because it is the average ratio observed between the price of 113
“brand-name” foods and the price of the cheapest foods sold under the same name(9;10).
114
The list of foods was appraised by an expert to avoid potential repetitions in the composition 115
table (e.g. baked potato and boiled or steamed potato) and to group together similar foods 116
under a single designation in accordance with their purchased form (e.g. potato). In that case, 117
the good price indicated in the booklet was the average of good prices of the different foods 118
that have been grouped together. 119
The selected foods were classified according to supermarket shelves. For some foods, booklet 120
price was calculated by unit as sold in stores (e.g. for one grapefruit or one lettuce). 121
Version postprint
Assessment
123
Quantitative assessement of the in-booklet prices 124
Opticourses participants (n=91) were asked to collect all food-purchase receipts for their 125
household over a 1-mo period. Purchase-receipt protocol training and data collection were 126
previously described by Marty et al.(15). For each food item, information from receipts (i.e.
127
date of purchase, corresponding INCA2 food name and code, quantity and price) were entered 128
into a food purchases database. The validity of the food prices listed in the booklet was 129
assessed by quantifying the percentage of purchases bought at a price lower than in-booklet 130
price, by supermarket shelf category, and for the whole food list. 131
132
Qualitative assessment of the Good Price Booklet 133
As part of the effort to evaluate the Opticourses intervention, 19 semi-structured interviews 134
were conducted with participants after the workshops by an external evaluator. The interview 135
guide contained questions on the tools used during the workshops, in particular the Good 136
Price Booklet. 137
Version postprint
RESULTS 138
Opticourses households: descriptive characteristics
139
Sociodemographic characteristics of the Opticourses households are given in Table 1. 140
Average household size was 3.41 (range: 1–8) including 2 children on average (range: 0–6). 141
Almost half of the households (48.2%) were in a precarious financial situation, and one third 142
(36.5%) declared severe financial difficulties. Each household shopped an average of 5 143
different stores while collecting receipts, and price was reported as the most important 144
determinant of food purchases. 145
List of foods featuring in the Good Price Booklet
146
The different stages in the process of identifying the foods with good nutritional quality and 147
price are summarized in Figure 1. The reduced INCA2 table with ready-made meals and 148
alcoholic and zero-calorie beverages pre-eliminated contained 1,054 foods. The median 149
SAIN/LIM ratio was then calculated on this reduced table, and foods with a SAIN/LIM ratio 150
lower than this median were discarded, resulting in a list of 527 foods of high nutritional 151
quality. Then foods with an average national price 2.5 times greater than their limit price were 152
eliminated (mostly expensive foods such as shellfish, game meat, berries or nuts). Among the 153
remaining foods (n=404), similar items were then grouped together under the same 154
designation, resulting in 153 foods classified according to supermarket shelf. Table 2 presents 155
the list of foods with good nutritional quality and price selected and included in the booklet. 156
For example, for generic foods, the in-booklet price is €1.94/kg for fresh vegetables, €2.42/kg 157
for tinned or frozen vegetables, €1.80/kg for fresh fruits, €2.35/kg for pasta and rice, €4.34/kg 158
for legumes, €2.07/kg for dairy products, and €9.56/kg for meat and fish (Table 2). 159
160
Creation of the Good Price Booklet
161
The Good Price Booklet was created in collaboration with a graphic designer (Figure 2). This 162
educational tool is presented in the form of a small brochure in payment-card format. It was 163
distributed to participants during the Opticourses intervention workshops to help them spot 164
foods and their corresponding good price when shopping for groceries. 165
The flyleaf of the booklet carries the slogan “Good for my health and good for my wallet”. 166
The second page carries the statement “All these foods are of good nutritional quality. If you 167
find them cheaper than the price indicated, it’s a bargain for eating healthily and cheaply. If
168
you find them at a price higher than the price indicated, you can buy them anyway as they are
169
all of good nutritional quality”. Olive oil and walnuts are present in the booklet given their
Version postprint
widely-established health benefits(20), even though they were not strictly foods of good
171
nutritional quality and price (olive oil has a SAIN/LIM ratio lower than the median of the 172
SAIN/LIM table median and walnuts have an average price over 2.5 times higher than the 173
limit price of their group). Therefore, for these two foods, the booklet did not give a price but 174
instead stated “Although expensive, moderate consumption is good for your health”. It was 175
not possible to include foods specific to certain culinary cultures in the booklet (e.g. plantain, 176
sorghum, etc.,) as average national prices in mainland France are often high. It was noted at 177
the end of the booklet that “Traditional basic foods from your culture are usually of good 178
nutritional quality, and you probably know where to buy them at a good price”.
179 180
Quantitative assessment of the relevance of in-booklet price
181
Several trials were conducted and compared to test the suitability of the proposed method. It 182
emerged that the choice of the median SAIN:LIM ratio to identify food of good nutritional 183
quality in the table, and the choice of the price tertile of each group to estimate in-booklet 184
prices was the most suitable method to have a sufficient number of foods in each group as 185
well as a realistic price value with regard to prices observed on supermarket shelves. The tool 186
was tested by the team and workshop participants. During the Opticourses intervention, 2386 187
purchases of foods with good nutritional quality and price were registered, of which 67.1% 188
were bought at a price lower than the in-booklet price (Table 3). When separately analyzing 189
foods as categorized by supermarket shelf, over half of the purchases made were below prices 190
displayed in the booklet, except for processed meats (46.5%), breads (8.3%) and oils & fats 191
(25.3%). Note however that the booklet only counted a few foods in these 3 categories (due to 192
their relatively low nutritional quality), resulting in few related purchases. None of the 193
breakfast cereals listed in the booklet were purchased by the participants, and so we could not 194
assess the relevance of the in-booklet price for this category. Percentages of purchases below 195
prices displayed in the booklet were higher for foods for which the booklet prices were based 196
on average national price rather than on limit price (i.e. up to 2.5 times cheaper than the 197
average national price), suggesting that it was easier to find the former than the latter. 198
199
Applicability of the Good Price Booklet within the framework of the Opticourses
200
intervention
201
One of the workshop’s aims was to share experiences for buying food at lower prices. 202
Participants exchanged useful tips, with some of them knowing where to buy at unbeatable 203
prices (flea markets, stock clearance stores, the fish market at the end of the morning, etc.). 204
Version postprint
These discussions gave contributors the opportunity to highlight several strategies as 205
substitutions between different food groups (e.g. purchasing less meat and more vegetables), 206
intra-group substitutions (e.g. purchasing cheaper meats of higher nutritional quality), or 207
‘price hunting’ (e.g. for a given food, preferring low-cost foods over their brand-name 208
equivalents). Thanks to the Good Price Booklet, the notion of “Good Price” was no longer 209
theoretical. As the Good Price Booklet was designed to be easily transportable in a handbag, 210
it can be used directly in purchase situations: if the price displayed in the shop is below the 211
booklet price for a given food, it is a bargain! 212
213
Qualitative assessment of the Good Price Booklet
214
All the participants appreciated the quality of the discussions during the workshops. This was 215
facilitated by the insight it gave into participants’ concerns about the relationship between 216
nutritional quality and food budget. The Good Price Booklet was praised by all the 217
participants interviewed (with the exception of one person with reading difficulties), as well 218
as by professionals. The tool, co-constructed with the workshop participants, was greatly 219
appreciated and continues to be used more than a month after the workshops. Verbatim 220
accounts recorded during interviews one month after the workshops include, for example: 221
“I use this tool (Good Price Booklet) when I go shopping, it’s always in my bag. I buy 222
products when they’re cheaper than the price listed here. I mostly use it for vegetables when I
223
go to Noailles (a popular fresh foods market, in the centre of Marseille) at the end of the
224
market, as it’s cheaper.”
225
“I do my shopping with the keyring (Good Price Booklet) and I buy when it’s below the price 226
listed, otherwise I buy something else.”
227
“I use this tool, it’s handy. I buy a lot of bargains.” 228
“This month my husband had more time for shopping, so this tool helped him a bit.” 229
“I compare purchases with the Good Price Booklet, and I manage to find shops with cheaper 230
prices. But I’ve always looked at prices—now I’ve got this tool, it motivates me to shop
231
better.”
232
One participant did not use the booklet but explained that her financial constraints were less 233
limiting. “I prefer quality to a good price now that there are only two of us at home. The 234
children don’t live with us anymore so it’s different, we can afford to choose quality.”
Version postprint
DISCUSSION 236
The Good Price Booklet, designed to help recognize foods with good nutritional quality and 237
price when grocery shopping, resulted from a co-construction using the desire of people with 238
financial difficulties to have information on “the good price” for foods, and the theoretical 239
work of the research team on the notion of foods with a good NQP(12).
240 241
Two indicators—SAIN and LIM—were used to appreciate the nutritional quality of foods 242
based on a limited number of nutrients (5 qualifying nutrients and 3 disqualifying nutrients). 243
This selection reflected a balance between the need to include nutrients that are of importance 244
to public health and nutrient markers of other essential nutrients(21). When implemented, the
245
SAIN,LIM system was found to adequately discriminate foods according to their contribution 246
to nutritionally-adequate diets(19,22). Several studies show that price is a major criterion in
247
terms of food choices, and this is particularly true for people with a limited budget(23;24).
248
Managing a small food budget effectively requires a sound understanding of food choices. It 249
is true that the foods we are advised to consume more of to protect our health, such as fruit, 250
vegetable and fish, are more expensive sources of calories, whereas carbohydrates and high-251
fat and high-sugar foods are cheap sources of calories(3). Nevertheless, while studies on the
252
cost of a balanced diet unequivocally show that it is more difficult to get a balanced diet with 253
a small budget(7;25), they also show that it is not impossible on condition that food groups and
254
good-NQP foods are chosen(12). The nutritional quality of foods correlates positively with
255
food prices (expressed in €/100kcal based on average national prices)(26). This indicates that
256
price structure is generally negative for nutritional balance, because the most expensive foods 257
are often the most nutrient-dense. However, there is strong dispersion around this correlation 258
line, which shows the existence of foods with higher NQP than others: for the same price, one 259
can find foods of high and lower nutritional quality. In particular, legumes, vegetable oils, 260
wholemeal cereal products, milk, plain yoghurt, eggs, poultry and some seafood (e.g. tinned 261
sardines) have a higher NQP “in absolute terms”. Conversely, other animal products and most 262
fruits and vegetables (with exceptions, such as carrots, orange juice, etc.) emerge as too
263
expensive to have a good NQP(6;11;12). Giving priority to foods with a good NQP “in absolute
264
terms” makes it possible to create a nutritionally optimal diet for €3.50 per day(12).
265 266
Many studies have jointly addressed the notions of diet cost and diet quality(3). Some have
267
found that healthy eating does not necessarily cost more when foods with higher nutritional 268
quality for their price are selected(8;12). Above all, they highhlight that achieving
Version postprint
quality diets does not entail major changes in habitual dietary patterns but rather optimal 270
choices in each food group (e.g. by preferring low-cost foods to their brand-name equivalent, 271
or canned products to fresh ones)(9;10). However, any effort to encourage a balanced diet for
272
underprivileged populations mainly by promoting foods with good NQP “in absolute terms” 273
is potentially contentious: not only because many of them are rarely consumed and therefore 274
not socially acceptable for everyone (as is the case for tinned sardines and giblets, for 275
example)(27) but also because, given the variability of prices, it is highly theoretical to claim
276
categorically that a food has higher nutritional quality for its price in absolute terms. In this 277
regard, during the Opticourses workshops, the theoretical list of foods with good NQP “in 278
absolute terms” quickly proved ill-adapted to the reality in the field. For example, participants 279
challenged the relevance of the list because peppers were not included. The average national 280
price of bell pepper is too high for it to qualify as a food with good NQP “in absolute terms”, 281
but the fact is that many participants managed to find this highly nutritious food far cheaper 282
than the average national price. Basing their work on these observations and discussions over 283
food prices, the research team was able to develop the notion of a food’s good price. 284
285
The Good Price Booklet was produced in a dynamic two-way interaction between research 286
and fieldwork. Co-construction is recognized as a factor for success in actions to promote 287
health(28;29). When they are developed in interaction with the public for which they are
288
designed, educational tools have a better chance of being adapted to people’s real situation 289
and thus getting used. This is the case for the Good Price Booklet, since the qualitative 290
assessment showed that the tool was appropriated by participants who knew how to use it. 291
Most participants appreciated the tool and continued to use it more than a month after the 292
interventions, thus demonstrating that the tool meets participants’ expectation to find foods of 293
good nutritional quality at an affordable price relative to their food budget. Considering the 294
socieconomically disadvantged situation of the study population, these results suggest that 295
prices displayed in the booklet may remain appropriate for any other population,
296
notwithstanding the fact that‘good price’ is a budget-dependent concept. Scaling up effective 297
implementation of this education tools requires adapting the methodology to the target
298
population. The booklet must notably integrate specific food patterns and dietary habits which 299
may vary according to population or country considered. In particular, the Opticourses 300
intervention targeted a financially-struggling population with diverse cultural backgrounds, 301
which may have resulted in specific dietary habits. Booklet prices must also be adapted to 302
domestic food prices and currency. 303
Version postprint
304
This tool has several limitations. First, it uses average national prices dating from 2006, well 305
before the Opticourses intervention began. It would be desirable to frequently update the in-306
booklet prices. However, collecting robust average national prices of foods is still a 307
challenge(16). In France, average national prices were estimated by researchers to be matched
308
with consumption data from the two national dietary surveys, i.e. INCA1 (1998–99) and 309
INCA2 (2006–07). Furthermore, previous analyses carried out as part of the Opticourses 310
intervention showed that participants purchased food at prices significantly lower than the 311
2006 average national prices(15)
, which thus remain relevant within the framework of our 312
intervention. Second, national prices may not directly reflect local prices which are influenced 313
by many factors such as local markets or policies(16). Third, exposure to food contaminants, a
314
growing health concern(30), is not captured by the SAIN,LIM calculation. Fourth, the
315
definition of good nutritional quality in this study—based on the median of foods’ SAIN/LIM 316
ratios—is relative and depends on the number and type of foods included in the table. If the 317
composition table contained more fruit and vegetables, for example, then the value of the 318
median SAIN/LIM ratio would increase and thus modify the foods of good nutritional quality 319
selected. Groups of foods high in fat and/or sugar would be less represented. An analysis 320
based on the medians of the SAIN/LIM ratio of each group would allow for the selection of 321
more foods in certain groups, but this choice was rejected here as since median values were 322
hugely disparate depending on the group, some foods with high nutritional quality would be 323
eliminated (e.g. certain fruits and vegetables) while others with lower nutritional quality 324
would be selected (e.g. foods high in fats and sugars) due to the differences in nutritional 325
quality of the groups to which they belong. To overcome these problems, one solution would 326
be to adopt a non-relative definition of nutritional quality, such as its classification within the 327
SAIN,LIM nutrient profiling system, which depends exclusively on the nutritional 328
composition of each food, independent of the food group to which it belongs(19). A final
329
limitation concerns the methodology used to produce the booklet’s prices, which could itself 330
be considered arbitrary. However, several trials were conducted to test the realism of the 331
findings obtained by means of the method adopted, and they confirmed the possibility of 332
finding the foods presented in the booklet at a price cheaper than listed. The method 333
developed here needs to be validated more thoroughly to assess the sensitivity of results to 334
spatial and temporal variation in food databases and average national prices. 335
Version postprint
Various actors (departmental health education committees, family allowance offices, health 337
insurance companies, dieticians, social workers, etc.) require adapted tools to address the 338
issue of shopping and eating healthily on a low budget. The Opticourses Good Price Booklet 339
enables them to move from theory to practice on purchasing food for a balanced diet on a low 340
budget, and is an example of an educational tool produced through co-construction. The 341
transferability of the Opticourses approach is currently being studied as part of a broader 342
project in France. This will provide an opportunity to test the acceptability and benefits of 343
Opticourses protocols and tools in different contexts in terms of target populations, 344
organizations, areas, etc. 345
Health logos, nutritional information and even subsidies can give rise to unwanted effects and 346
may be liable to increase social inequalities with regard to nutrition(31). A positive nutritional
347
logo exclusively indicating foods with a good NQP (by making them available, visible and 348
attractive in shops) was found to direct purchases towards these foods(16) and would be a
349
concrete way to help consumers identify foods that enable them to reconcile nutrition and 350
budget when they shop for food. Further research is now needed to investigate the effect on 351
nutritional status of a positive logo scheme promoting good-NQP foods. 352
Version postprint
REFERENCES
1. James WP, Nelson M, Ralph A et al. (1997) Socioeconomic determinants of health. The contribution of nutrition to inequalities in health. BMJ 314, 1545-1549.
2. Aggarwal A, Monsivais P, Cook AJ et al. (2011) Does diet cost mediate the relation between socioeconomic position and diet quality? Eur J Clin Nutr 65, 1059-1066.
3. Darmon N, Drewnowski A (2015) The contribution of food prices and diet cost to
socioeconomic disparities in diet quality: a systematic review and analysis. Nutr Rev 73, 643-660.
4. Andrieu E, Darmon N, Drewnowski A (2006) Low-cost diets: more energy, fewer nutrients. Eur
J Clin Nutr 60, 434-436.
5. Townsend MS, Aaron GJ, Monsivais P et al. (2009) Less-energy-dense diets of low-income women in California are associated with higher energy-adjusted diet costs. Am J Clin Nutr 89, 1220-1226.
6. Maillot M, Darmon N, Darmon M et al. (2007) Nutrient-Dense Food Groups Have High Energy Costs: An Econometric Approach to Nutrient Profiling. J Nutr 137, 1815-1820.
7. Darmon N, Ferguson EL, Briend A (2002) A cost constraint alone has adverse effects on food selection and nutrient density: an analysis of human diets by linear programming. J Nutr 132, 3764-3771.
8. Darmon N, Ferguson EL, Briend A (2006) Impact of a cost constraint on nutritionally adequate food choices for French women: an analysis by linear programming. J Nutr Educ Behav 38, 82-90.
9. Cooper S, Nelson M (2003) 'Economy' line foods from four supermarkets and brand name equivalents: a comparison of their nutrient contents and costs. J Hum Nutr Diet 16, 339-347.
10. Darmon N, Caillavet F, Joly C et al. (2009) Low-cost foods: how do they compare with their brand name equivalents? A French study. Public Health Nutr 12, 808-815.
Version postprint
11. Drewnowski A (2010) The Nutrient Rich Foods Index helps to identify healthy, affordable foods. Am J Clin Nutr 91, 1101S.
12. Maillot M, Ferguson EL, Drewnowski A et al. (2008) Nutrient profiling can help identify foods of good nutritional quality for their price: a validation study with linear programming. J Nutr
138, 1107-1113.
13. Drewnowski A (2013) New Metrics of Affordable Nutrition: Which Vegetables Provide Most Nutrients for Least Cost? J Acad Nutr Diet 113, 1182-1187.
14. Darmon N (2010) Manger équilibré malgré la précarité [Balanced diet in spite of precarious conditions?]. Soins Supplément au n° 744 - avril 2010, S10-S12.
15. Marty L, Dubois C, Gaubard MS et al. (2015) Higher nutritional quality at no additional cost among low-income households: insights from food purchases of "positive deviants". Am J Clin
Nutr 102, 190-198.
16. Gamburzew A, Darcel N, Gazan R et al. (2016) In-store marketing of inexpensive foods with good nutritional quality in disadvantaged neighborhoods: increased awareness, understanding, and purchasing. Int J Behav Nutr Phys Act 13, 104.
17. Lee A, Mhurchu CN, Sacks G, et al.(2013) Monitoring the price and affordability of foods and diets globally. Obes Rev 14:82–95.
18. Bocquier A, Vieux F, Lioret S et al. (2015) Socio-economic characteristics, living conditions and diet quality are associated with food insecurity in France. Public Health Nutr 18, 2952-2961.
19. Darmon N, Vieux F, Maillot M et al. (2009) Nutrient profiles discriminate between foods according to their contribution to nutritionally adequate diets: a validation study using linear programming and the SAIN,LIM system. Am J Clin Nutr 89, 1227-1236.
20. Estruch R, Ros E, Salas-Salvado J et al. (2013) Primary prevention of cardiovascular disease with a Mediterranean diet. N Engl J Med 368, 1279-1290.
Version postprint
21. Tharrey M, Maillot M, Braesco V, et al. (2017) From the SAIN,LIM system to the SENS algorithm: a review of a French approach to nutrient profiling. Proc Nutr Soc, sous Press.
22. Maillot M, Drewnowski A, Vieux F, et al. (2011) Quantifying the contribution of foods with unfavourable nutrient profiles to nutritionally adequate diets. Br J Nutr 105(8):1133–7.
23. Wiig K, Smith C (2009) The art of grocery shopping on a food stamp budget: factors influencing the food choices of low-income women as they try to make ends meet. Public
Health Nutr 12, 1726-1734.
24. Waterlander WE, de Mul A, Schuit AJ et al. (2010) Perceptions on the use of pricing strategies to stimulate healthy eating among residents of deprived neighbourhoods: a focus group study.
Int J Behav Nutr Phys Act 7, 44.
25. Drewnowski A, Darmon N, Briend A (2004) Replacing fats and sweets with vegetables and fruit – a question of cost. Am J Pub Health 94, 1555-1559.
26. Darmon N, Darmon M, Maillot M et al. (2005) A nutrient density standard for vegetables and fruits: nutrients per calorie and nutrients per unit cost. J Am Diet Assoc 105, 1881-1887.
27. Maillot M, Darmon N, Drewnowski A (2010) Are the lowest-cost healthful food plans culturally and socially acceptable? Public Health Nutr 13, 1178-1185.
28. WHO (2009) Interventions on diet and physical activity: WhatWorks. Summary report. WHO: Geneva.
29. Molleman GRM, Peters LWH, Hommels LH et al. (2006) Project quality rating by experts and practitioners: experience with Preffi 2.0 as a quality assessment instrument. Health Educ Res.
21(2):219-29.
30. Hussain MA. (2016) Food Contamination: Major Challenges of the Future. Foods 5(2).
31. Darmon N, Lacroix A, Muller L et al. (2014) Food price policies improve diet quality while increasing socioeconomic inequalities in nutrition. Int J Behav Nutr Phys Act 11, 66.
Version postprint
Table 1. Sociodemographic characteristics of Opticourses households (n=91)
Mean (SD) Respondent age, y 48.1 (10.1) Household members, n 3.41 (1.97) Children, n 1.70 (1.68) Stores frequented, n 4.85 (3.22) Female respondents, % 75.8
Food aid recipients, % 11.0
Financial situation, %
Stable 15.3
Precarious 48.2
Version postprint
Table 2. List of foods with good nutritional quality presented in the booklet with their ‘good price’ (€/kg or €/article) SHELF FOOD GOOD PRICE (€/kg) SHELF FOOD GOOD PRICE (€/kg) VEGETABLES GRAINS Aubergine 1.76 Wheat 2.35 Avocado 0.44* Couscous 2.15 Beetroot 2.06 Pasta 2.09
Chard 1.99 Wholemeal pasta 2.35
Broccoli 2.18 Polenta/cornmeal 2.25
Carrot 1.12 Rice 2.31
Celery/celeriac 1.70 Wholemeal rice 2.35
Mushroom 1.70 POTATO
Cabbage a 1.74 Potato 1.28
Cucumber 0.49* Dried mashed potato 1.66
Courgette 1.78 Potato gnocchi 2.35
Chicory 1.81 LEGUMES
Spinach 1.74 Dry kidney/white beans 5.19
Corn on the cob 0.40* Dry lentils 3.85
Turnip 1.47 Dry split peas 3.48
Onion 2.07 Dry chickpeas 4.83
Leek 1.70 TINNED VEGETABLES
Pepper 2.06 Carrots 2.42
Pumpkin 1.70 Celery/celeriac 2.42
Radish (bunch) 0.72* Mushrooms 2.42
Lettuce b 0.86* Sauerkraut without garnish 2.42
Tomato 2.18 Green beans 2.42
FRUITS Diced mixed veg. 2.19
Apricot 2.18 Sweetcorn 2.42
Pineapple 1.89* Peas with or without carrots 2.42
Banana 1.39 Ratatouille 2.42
Lemon 2.18 TINNED TOMATOES
Clementine/mandarin 1.70 Tomato concentrate 1.77
Dried fruit c 3.90 Tomato sauce 3.01
Kiwi 0.16* Tomatoes 1.89
Melon 1.70* TINNED LEGUMES
Plum 2.18 Kidney/white beans 2.67
Nectarine/peach 2.18 Lentils 1.79
Walnut d - Chickpeas 1.97
Orange 1.23 TINNED FISH
Grapefruit 0.64* Cod liver 9.56
Watermelon 0.73 Mackerel 8.74
Version postprint
Apple 1.52 Tuna 8.36
Greengage plum 2.18 SOUP
Grape 2.30 Carton of veg. soup 2.20
FISH Powdered veg. soup 1.28
Anchovy 6.69 JUICE
Sea bream 6.69 Pure fruit juice 1.20
Haddock/smoked haddock 9.56 OILS & FATS
Pollock, coley, hake 6.69 Rapeseed oil 1.42
Mackerel 6.85 Walnut oil 3.01
Mullet 7.64 Olive oil d -
Perch 7.17 Sunflower oil 1.22
Rock salmon 8.60 Blended oil 2.18
Sardine 5.73 Margarine 3.01
Salmon 8.60 BREAKFAST CEREALS
Cuttlefish 7.64 Oat flakes 3.60
Tuna 8.60 Muesli 2.35
Rainbow trout 7.17 SWEET PRODUCTS
MEAT Fruit compote 2.42
Offal (poultry, beef, pork) 5.71 Fruit salad 1.94
Chicken breast 9.56 Custard 2.74
Chicken thigh 4.96 Chocolate/vanilla pudding i 3.38
Turkey cutlet 9.24 Rice pudding 3.87
Rabbit (whole) 6.69 Gingerbread 3.90
Chicken (whole) 5.09 FROZEN VEG
Ground beef—5% fat 9.56 Courgette 2.42
Ground beef—10% fat 8.74 Spinach 2.42
Beef, high quality cuts e 9.15 Green beans 1.88
Beef, , other cuts f 6.11 Ratatouille 2.42
Turkey 7.80 FROZEN POTATO
Pork (lean tenderloin, joint) 8.49 Potato 1.76
Veal g 9.56 FROZEN FISH
PROCESSED MEAT Seafood cocktail 9.56
Black sausage 7.25 Pollock, coley, hake 6.69
Cooked ham 9.27 Salmon 8.60
EGGS FROZEN MEAT
Egg 0.16* Chicken thigh 4.96
DAIRY Ground beef—5% fat 9.56
Milk 0.95 Ground beef—10% fat 8.74
Flavoured milk 1.63 Turkey 7.80
Fermented milk drink 1.72 Pork (lean tenderloin, joint) 8.49
Fromage blanc 2.72 GENERIC
Petits suisses 2.47 Fresh veg. 1.94
Flavoured yoghurt 2.38 Fresh fruit 1.80
Fruit yoghurt 2.38 Tinned veg. 2.42
Plain yoghurt 1.97 Frozen veg. 2.42
Version postprint
Rusk or toasted bread h 2.35 Meat 9.56
Wholemeal bread 2.35 Dairy j 2.07
Rye bread, wholegrain bread 2.35 Pasta, rice 2.35
Legumes 4.34
In bold are foods whose ‘good price’ is based on the limit price rather than average national price. * Good price/unit (€/article)
a
green, white, brussels sprout, red, cauliflower b
lettuce, escarole, lamb’s lettuce, curly endive c
apricot, banana, date, prune, fig d
“Although expensive, moderate consumption is good for your health” e
joint, beefsteak f
for bourguignon, stews or braising g
chunks for braising, cutlet, joint h
wholemeal or wholegrain i
tinned or fresh j
Version postprint
Table 3. Proportion, by supermarket-shelf category, of purchases of the booklet’s foods bought by Opticourses participants at a price below the booklet’s price
* Not purchased by Opticourses participants Median (IQR) price, (€/kg) Total, N
Price below the booklet’s price,
N
Price below the booklet’s price,
%
Vegetables (fresh or frozen) 1.5 (1.0–2.0) 425 263 61.9%
Fruit 1.5 (1.0–2.0) 373 219 58.7%
Fish (fresh or frozen) 5.9 (4.0–12.0) 11 6 54.5%
Meat (fresh or frozen) 6.8 (4.0–8.8) 163 93 57.1%
Processed meat 9.8 (7.4–13.3) 28 13 46.4% Eggs 1.9 (1.9–2.8) 130 97 74.6% Dairy 0.9 (0.6–1.5) 319 276 86.5% Bread 3.8 (2.5–4.5) 12 1 8.3% Grains 1.2 (0.8–2.0) 209 164 78.5% Potato 1.0 (0.6–1.7) 126 84 66.7% Legumes 2.0 (1.3–2.7) 37 27 73.0% Tinned vegetables 2.2 (1.7–2.8) 87 51 58.6% Tinned tomatoes 1.6 (0.6–2.1) 100 73 73.0% Tinned legumes 1.8 (1.2–2.7) 27 18 66.7% Tinned fish 7.4 (5.8–9.2) 39 24 61.5% Soup 1.4 (1.0–2.0) 6 4 66.7% Juice 0.9 (0.7–1.1) 141 116 82.3%
Oils & fats 1.5 (1.4–1.6) 95 24 25.3%
Breakfast cereals* - - - -
Sweet products 2.5 (1.8–4.6) 9 5 55.6%
Version postprint
Figures
Figure 1. Flowchart showing how foods were selected for the Good Price Booklet Figure 2. Good Price Booklet distributed during Opticourses* workshops
Version postprint
INCA2 table of the composition of foods (n=1,343)
Elimination of ready-made meals, alcoholic beverages and zero-calorie beverages
Reduced INCA2 table of the composition of foods (n=1,054)
Elimination of foods with a SAIN/LIM ratio < median
Calculation of limit price for each food
Foods of good nutritional quality (n=527)
Elimination of foods whose average national price is 2.5 times higher than the limit price (except for olive oil and walnuts)
Foods of good nutritional quality and price (n=404)
Grouping together similar foods under a single designation
Dividing into categories depending on supermarket shelves
Version postprint