HAL Id: hal-03094210
https://hal.archives-ouvertes.fr/hal-03094210
Submitted on 4 Jan 2021
HAL is a multi-disciplinary open access archive for the deposit and dissemination of sci-entific research documents, whether they are pub-lished or not. The documents may come from teaching and research institutions in France or abroad, or from public or private research centers.
L’archive ouverte pluridisciplinaire HAL, est destinée au dépôt et à la diffusion de documents scientifiques de niveau recherche, publiés ou non, émanant des établissements d’enseignement et de recherche français ou étrangers, des laboratoires publics ou privés.
Optimization of Sample Preparation for the Observation
of Macromolecular Complexes by Electron
(cryo-)Microscopy
Alexandre Frechard, Grigory Sharov, Maximilien Werderer, Patrick Schultz
To cite this version:
Alexandre Frechard, Grigory Sharov, Maximilien Werderer, Patrick Schultz. Optimization of Sample Preparation for the Observation of Macromolecular Complexes by Electron (cryo-)Microscopy. Arnaud Poterszman. Multiprotein Complexes. Methods and Protocols, 2247, Springer, pp.243-256, 2021, Methods in Molecular Biology, 978-1-0716-1125-8. �10.1007/978-1-0716-1126-5_13�. �hal-03094210�
Fig. 1 Table 1 (see Note x) (see Section X.X.X) in bold minutes, seconds, hours, mL
Chapter 14
Optimization of sample preparation for the observation of macromolecular
complexes by Electron (cryo-)Microscopy.
Alexandre Frechard
1,2,3,4, Grigory Sharov
1,2,3,4,5, Maximilien Werderer
1,2,3,4,
Patrick Schultz
1,2,3,4*
1 Institut de Génétique et de Biologie Moléculaire et Cellulaire, Integrated Structural Biology Department, Illkirch, France, Equipe labellisée Ligue Contre le Cancer.
2 Centre National de la Recherche Scientifique, UMR7104, Illkirch, France.
3 Institut National de la Santé et de la Recherche Médicale, U1258, Illkirch, France. 4 Université de Strasbourg, Illkirch, France.
5 EM Facility, MRC Laboratory of Molecular Biology, Francis Crick Avenue, Cambridge Biomedical Campus, Cambridge CB2 0QH, UK.
Running head
Specimen optimization for single particle cryo-EM.
Abstract
Electron microscopy is a powerful tool for studying the homogeneity and structure of biomolecular complexes. The small wavelength of electron and the availability of electron optics enable the direct visualization of macromolecular assemblies in a large range of sizes between 5 to 100 nm. This informs us about the degree of multimerization or aggregation and provides precise information about their general shape and dimensions. When combined with sophisticated image analysis protocols, three-dimensional (3D) information can be gained from 2D projections of the sample leading to a structural description. When intermediate steps of a reaction can be imaged, insights into the mode of action of macromolecules can be gained and structure-function relations can be established. However, the way the samples is prepared for its observation within the vacuum of an electron microscope determines the information that can be retrieved from the experiment. We will review two commonly used specimen preparation protocols for subsequent single particles electron microscopy observation, namely negative staining and vitrification.
Keywords
EM screening for specimen homogeneity, negative stain electron microscopy, Cryo-EM, optimization for structure determination
1
Introduction
In the last decades, imaging of biological macromolecules by electron microscopy became a major structural biology method to describe the shape and size of macromolecules, to investigate their oligomeric or aggregated state, and, in combination with single particle image analysis, to describe their structure (Cheng, 2018). Ultimately this approach aims at understanding the mode of action of molecular assemblies by correlating their structure with their function. Handling macromolecular assemblies a few nanometers in size for their observation in the vacuum of a transmission electron microscope (TEM)
while preserving the structural integrity of the sample is challenging. Over the years, many obstacles were overcome to reveal biomolecules in atomic details.
For most biological applications the sample is applied onto 3 mm EM grids that can be made of different material. Continuously carbon coated grids are used for negative staining where carbon acts as a support for the sample whereas perforated carbon-coated grids can in addition be used in cryo-EM when adsorption has to be avoided. The carbon surface is generally hydrophobic and has to be rendered hydrophilic to allow proper spreading of the sample and adsorption of the biomolecules (Dubochet et al., 1971). The properties of the carbon surface are altered by glow discharge, a process where the grids are exposed to an ionizing plasma formed by applying an electric current through a gas volume at low pressure gas. The ionized gas molecules will modify the properties of the carbon surface of the grids and render it hydrophilic
We will describe two popular specimen preparation methods, negative stain and frozen hydrated samples, which can both provide molecular details.
1.1 Negative staining
The most straightforward negative staining approach was first described by Brenner and Horne in 1959 (Brenner and Horne, 1959). The methods consists in embedding the protein into a matrix of heavy atom salt to increase the contrast of unstained biomolecules and prevent, to some extent, their collapse during the drying process when exposed to the vacuum of the microscope. Stains of heavy metal salts, such as uranyl acetate, uranyl formate, phosphotungstic acid and others, are commonly used, since they strongly scatter electrons and produce high amplitude contrast. It is important to notice, that negative staining reveals only the surface and the overall shape of protein molecules, and does not provide information about their inner structure. The resolution that can be achieved after image analysis of multiple images is limited to 15-20 Å, by the graininess of the stain and particle distortions during the drying process. This methods is however very useful to check particle homogeneity and to determine initial 3-D models. Furthermore the sample preparation is easy to perform and to observe at room temperature in a standard transmission electron microscope. The stained sample, or more specifically, its heavy metal cast, is more resistant to radiation damage produced by the electron irradiation, and the high image contrast favors image interpretation.
1.2 Sample Vitrification
The major drawback of negative staining is that the sample is dried during preparation and introduction in the microscope vacuum. To overcome this limitation several options have been explored to keep the specimen hydrated including the construction of hydrated chambers around the specimen holder. Attempts were made to replace water with sugar polymers to functionally replace the shielding properties of water, and remarkable results were obtained for 2-D crystals of membrane proteins. Cryogenic methods were tried early on and proved efficient to reduce the irradiation damage resulting from the interaction of electrons with matter by a factor of 2 at liquid nitrogen temperature. However, freezing water invariably resulted in ice crystal formation which affects sample distribution and image quality. Being able to obtain vitreous ice at atmospheric pressure was a major breakthrough for studying biological macromolecules in a fully hydrated state in the electron microscope. The method consists in flash freezing a thin layer of an aqueous suspension of the purified biomolecule to form a vitrified sample that can be transferred and observed in a cryo electron microscope at liquid nitrogen temperature. A layer of suspension thinner than 100 nm is generally obtain by removing the excess of a drop of sample applied onto the electron microscopy grid by blotting with a filter paper. Alternatively sample micro droplets can be sprayed onto the grid or applied by a nanoliter dispensers (Jain et al., 2012). Vitrification is generally performed by plunging the EM grid into liquid ethane cooled by liquid nitrogen for better heat dissipation. High pressure freezing devices have been developed for the vitrification of up to 300 nm think sample (Dubochet et al., 1988). This approach, rewarded by the Nobel Prize in chemistry in 2017, preserves the hydrated structure of the molecules at atomic resolution. The vitrification process can be performed once the sample is adsorbed on a carbon film but adsorption can be avoided by using holey carbon films. In this case observations are made on the thin layer of vitrified suspension stretched over the carbon-free holes. However the sample still experiences the interaction with the air-water
interface which can be deleterious when the specimen is prone to denaturation, or can result in preferential orientations of the molecules (Noble et al., 2018).
2
Materials
We list here the equipment needed to prepare purified biological molecules for their observation in electron microscopy. The negative staining and vitrification methods require common material listed in section 2.1. and have their own specificities detailed in sections 2.2. and 2.3, respectively.
2.1 Common materials and equipment
The EM grid, a universal and versatile specimen support. The universal support to manipulate EM samples is a thin metallic grid 3mm in diameter adapted for most electron microscope holders. EM grids are made of copper, copper/rhodium or gold to be conductive and eliminate electron charge accumulation. Square holes of different sizes are separated by grid bars that absorb electrons. Copper mesh grids with 300 grid squares per inch are commonly used because they are conductive, stable under the electron beam and inexpensive. The grid is generally covered by a 5-20 nm thin carbon film onto which protein complexes are adsorbed for subsequent negative staining. To avoid sample adsorption in cryo-EM, the grids can also be covered with a self-made carbon film perforated with holes of various diameter ranging between 0.3 to 10 µm in diameter (Fukami and Adachi, 1965). More recently, perforated grids with calibrated circular holes arranged into regular arrays were developed to serve automated data acquisition (Russo and Passmore, 2016). Such perforated grids can be covered by a continuous thin carbon film when adsorption cannot be avoided. Holey carbon films can also be covered by a single monolayer thick graphene or graphene oxide crystalline layer instead of amorphous carbon thus leading to a less grainy background (Palovcak et al., 2018)(Oxford Instruments, quantifoil micro tools GMBH)
High precision tweezers. To properly manipulate the EM grids without distortion and contamination, high precision and sharp tweezers are recommended (Dumont style 5 tweezers, Fine Science Tools GMBH ref: 11252-30). Make sure to grab the grids by the rim to not damage or distort the support. Standard straight tweezers are sufficient to manipulate grids, but other types of tweezers can be useful in electron microscopy: anti capillarity tweezers have a wider angle at the tip when closed, limiting the amount of liquid retained by capillarity. Inverted tweezers are also found useful since they remain closed until squeezed, limiting the risks of dropping grids when handling the tweezers.
Glow discharge and plasma cleaner Devices. These table top instruments are used to produce a gas plasma to charge the carbon surface of the grids by an electrostatic potential in order to produce a hydrophilic surface suitable for protein absorption. The devices differ by the quality of the vacuum (between 10-2 to 10-6 Torr, or 1.3 to 1.3 10-4 Pa), the way the plasma is produced and the mixture of gazes that can be used to form the plasma. (ELMO, Cordouan technologies; Nanoclean model 1070, Fischione)
Filter paper. Different steps of the protocol require blotting the grids to remove excess of staining solution or water. (Macherey-Nagel, ref: 202009)
Crosslinkers. Chemical crosslinkers such as glutaraldehyde (Sigma, ref: G5882) or bis-sulfosuccinimidyl suberate (BS3, Thermo Fischer Scientific, ref: 21580) are often used to stabilize fragile sample by forming chemical bonds between proximal lysine residues. Chemical cross linker have a short life time and may form oligomeric states, they can be aliquoted and frozen to extend their life time.
2.2 Negative Staining
Heavy atom salt solution. Uranyl acetate (Agar scientific, ref: AGR1260A; Polysciences ref: 21447-25) uranyl formate, phosphotungstic acid (PTA) and others heavy metal, are commonly used to embed the biological sample into a shell of electron dense material. The heavy atom salt are dissolved in water at 2% (w/v). Most of the solutions are at low pH and only few of them, such as PTA, can be buffered to pH 7.0 without forming aggregates. In this respect, phosphate buffer present in the sample solution, may provoke uranyl acetate precipitation observed as dark clusters in the microscope.
Handling heavy metal salts requires strict safety protections: use gloves, mask, safety glasses and work under hood when preparing solutions. Uranyl salts are slightly radioactive and specific safety precautions are necessary: store uranyl salts in a lead protection box, identify the workbench used to work with uranyl acetate, weight powders in a secured work station, work under a hood protected by a Plexiglas screen when handling concentrated solutions and finally, make sure to dispose any contaminated waste according to your lab policy. Radiations emitted from 2% solutions are shielded by water molecules and the glass bottle. Depending on national policies, uranyl based reagent might be difficult or even illegal to buy. Please make sure your experiments comply with your local regulations.
Parafilm. The protocol includes several washing steps aiming at solution replacement. Parafilm may be used to deposit small solution drops on top of which the EM grid can be placed. (VWR international SAS, ref: 97949).
2.3 Cryo-EM
Preparing the sample for Cryo-EM requires more material and equipment than negative staining. Make sure that all the material is at your disposal before you start since the protocol cannot be interrupted.
Liquid Nitrogen. Liquid nitrogen is used at several steps in the protocol to refrigerate and liquefy ethane, to store the vitrified grid and cryo-box, and to transfer the cryo-box to a dedicated short-term or long term storage device. Once vitrified the specimen has to be kept at liquid nitrogen temperature (boiling temperature of -196°C under normal atmospheric pressure) to avoid water devitrification.
Plastic beaker. A 1L polypropylene beaker with a handle to pour nitrogen (Vitlab, ref: 442941).
Cryo-boxes. These round boxes are used to store the vitrified samples in liquid nitrogen. They generally hold four EM grids and have a transparent cover hold in place by a screw. The cover has a single slit and can be rotated to select one of the four EM grid slots (Oxford Instruments, ref: G3539).
Screw driver. A screw driver is necessary to fasten and unfasten the cryo-box cover immerged in liquid nitrogen.
Long isolated tweezers. Twenty centimeter long tweezers are used to manipulate the cryo-boxes submerged in nitrogen. To protect the operator from frostbites the tweezers should be cold-isolated by a protective layer.
Liquid Nitrogen Tank. A 5L liquid nitrogen container is required to store over longer periods the cryo-boxes which contain the grids. The cryo-cryo-boxes can be put into Falcon tubes perforated for liquid nitrogen influx and fixed to a 2-3 mm thick plastic coated metallic cord which hangs out of the tank once the tube is immerged. More elaborate systems have been developed to organize multi-user grid storage, efficient cryo-box retrieval and automated nitrogen refill (EMS Cryo Pucks G2).
Cryo-plunger. Specimen vitrification is commonly achieved by forming a thin layer of the sample on the EM grid through blotting away the excess of sample and subsequent plunging of the grid into a liquid ethane slush refrigerated by liquid nitrogen (Dubochet et al., 1988). Simple, versatile and portable devices were designed in which a tweezer holding the grid was fixed on a weighted friction reduced rod that moved by gravity to plunge the grid into the cryogen container. Ethane is liquefied in a 2mL
aluminium container inserted in a styrofoam container of liquid nitrogen. Since the boiling temperature of liquid nitrogen is lower than the fusion temperature of ethane (-183.3 °C) the ethane will tend to solidify. An ethane heating device or a properly designed ethane tank assure that ethane does not reach liquid nitrogen temperature and stays as a liquid slush. Highly automated devices are currently available providing a temperature and humidity controlled chamber to avoid evaporation, a force and time controlled blotting and automated plunging (Vos et al., 2008)(Vitrobot Mark IV, Thermofisher; EM GP2, Leica).
Ethane gas cylinder. A 5L cylinder containing compressed ethane gas is required to fill the ethane container. The cylinder has to be equipped with a pressure reducer to fine tune the gas flow and with a thin flexible plastic pipe (diameter of 2 mm) to flow the ethane stream into the liquid nitrogen cooled cryogen container. The extremity of a pipette tip can be mounted at the end of the plastic pipe for increased precision in driving the ethane flow.
Safety issues. Liquid ethane close to its solidification temperature is dangerous and will freezes any hydrated object upon contact. Care must be taken to avoid spills on skin or eyes. The use of a face shield is highly recommended. Thick gloves must be used to manipulate cold objects.
3 Methods
3.1 Negative staining
Negative staining is a fast method to assess the quality of your sample by checking its stability, homogeneity and propensity to aggregate.
3.1.1 Preparation of a negatively stained sample
1. Glow discharge a carbon coated EM grid to render the carbon support hydrophilic. Place the EM grid in the glow discharging device, carbon side facing up. The nature of the gas present in the chamber, the partial gas pressure, the voltage applied, the glow discharge time and the geometry of the device will all affect the ionization of the carbon support. Using air as the residual gas at a pressure of 1.8 10-1 bar, a current of 2mA should be applied for 45 sec to assure a suitable hydrophilicity (Fig. 1.a). 2. Deposit 3-5 µl of your sample onto the glow discharged side of the grid held with tweezers and wait
1 min for protein absorption. The protein concentration should be around 30µg/ml (Fig.1.b). 3. Place a square of parafilm onto the bench and deposit 4 separate 40 µl drops, 3 of water or buffer
and one drop of phosphotungstic acid at 2%.
4. After adsorption (step 2), place the grid sequentially on top of the first three droplets of water to remove material not adsorbed to the carbon (Fig. 1.c). Then remove the excess of water using filter paper and transfer the grid to the last drop containing the phosphotungstic acid and wait 30 seconds (Fig. 1d).
5. Grab the grid with tweezers, approach the filter paper from the side of the grid, gently remove the excess of stain by capillarity, let the grid dry completely for 1 min. and store it in a grid storage box before observation in the transmission electron microscope (Fig. 1e).
3.1.2 Observation and Trouble shooting
Ideally the sample should be evenly distributed with little interactions between individual particles. The macromolecules should be included in a layer of stain of the same thickness as the particle to sustain optimally the sample, to reveal all parts and to obtain the best contrast. It is often necessary to screen several places on the grids to find optimal staining. The following indications may help to improve staining.
1. Poor Staining. In a standard bright field transmission electron microscope your protein should appear as a lighter area embedded in a darker background. If your sample is poorly stained you will only see fingerprints of your protein (Fig. 3b) or worse, your sample may be positively stained and appear as
dark spots on a lighter background. You may adjust the glow discharge conditions to render the support more hydrophilic and make sure that the staining solution is not removed too fast by wetting the filter paper beforehand. Adding 0.5% glycerol may help to reduce the drying speed and improve staining.
2. Excess staining. Your sample may be well embedded but a thick layer of stain may be superimposed to the particles thus reducing the contrast and obscuring fine details of your sample (Fig. 3c). Sometimes wiping away the stain faster can help. Check that your sample buffer does not contain large excess of sucrose of glycerol which increases its viscosity. In this case an additional washing step can be added.
3. Presence of stain crystals. Uranyl salts precipitate at neutral pH or in contact with phosphate buffer and form small crystals visible in EM. Make sure that these reagents are absent or sufficiently dilute in the last staining step and that the PH is suitable.
4. Damaged/destroyed proteins. Some fragile protein complexes may be altered during grid preparation and even fall apart during the dilution, adsorption or staining steps. Chemical crosslinkers such as glutaraldehyde or BS3 may stabilize the sample. As a standard procedure glutaraldehyde is added at a final concentration of 0.1 to 0.5% 2 min, before adsorption on the EM grid. Crosslinkers may lead to protein aggregation and therefore crosslinking time and concentration need to be adjusted. Adding 1% glycerol in the staining solution may help sustaining fragile samples and prevent their collapse during the drying step.
5. Small number of particles. When a smaller number of particles than expected is observed, the sample may form aggregates. Aggregates are not always detected because of their small interaction interface with the carbon support which can lead their dissociation during the washing or staining steps. Alternatively, the sample suspension may contain reagents (elution peptides, detergents, lipids) that compete with the protein for adsorption. In this case these reagents have to be removed whenever possible.
3.2 Sample vitrification
3.2.1 Preparation of the vitrified suspension
The protocol presented here is adapted for a Vitrobot but most of the steps can be adjusted to a handmade plunger or a device from another manufacturer.
1. Prepare four EM grids coated with holey carbon (non-adsorbed sample) or plain carbon (adsorbed sample) and glow discharge them as described in section 3.1.1
2. Prepare the plunging device by adjusting the temperature and humidity of the chamber.
3. Cool down the liquid nitrogen and ethane containers with liquid nitrogen. Once it has reached liquid nitrogen temperature remove liquid nitrogen from the ethane container and place it in its holder. 4. Liquefy ethane in the ethane container by introducing a flow of ethane gas with a polyethylene tubing
connected to the ethane cylinder. The gas flow can be manually adjusted by clamping the tubing. Place the tube at the bottom of the container with a weak gas flow until some liquid ethane forms. At that point the gas flow may be increased until the liquid level reaches a few millimeters from the top of the container. Wait for the ethane to solidify at the rim of the container, which signals that the ethane is cold enough.
5. Adjust the liquid nitrogen level and place the container under the plunger. 6. Fix the grid onto the plunger tweezer and transfer it into the chamber.
7. Apply 3 µl of the sample onto the grid. In the absence of adsorption, the sample concentration needs to be higher, in the order of 0.3 to 1 mg/mL
8. Blot the grid using the filter paper supplied by the manufacturer after having adjusted the blotting time and blotting force.
9. Plunge the grid down into liquid ethane.
3.2.2 Observation and Trouble shooting
1. Opaque grid. If your grid is not transparent to electrons it generally means that the ice is too thick. Blot time and force can be increased. Make sure that reagents that increase viscosity such as glycerol or sucrose are absent. The thickness of the vitrified layer is of key importance to reach high resolution in single particle cryo-EM. The thinnest is the better and small amounts of non-ionic detergents may be added to form even thinner layers.
2. Poor contrast. Thick ice will reduce image contrast. Some reagents such as glucose or glycerol may affect the contrast. Make sure that their concentration is lower than 1%.
3. Ethane contaminants. Long filaments forming aggregates are sometimes present and originate from impurities present in the ethane which do not evaporate in the temperature and vacuum conditions of the microscope (Fig. 3d). Avoid solid ethane accumulation on the EM grid which forms when transferring the grid from the ethane to the liquid nitrogen container after vitrification. Slow retraction of the grid from the container is the best way to prevent ethane accumulation. Solid ethane may be gently removed under liquid nitrogen with tweezers. Storage for a few days in liquid nitrogen may detach the solid ethane from the grid.
4. Crystalline ice. During freezing, parts of the water layer may not have cooled down fast enough thus forming hexagonal ice. This should be restricted to the thicker parts of the suspension layer. If this problem persists the plunging speed or depth may need to be adjusted. Alternatively if the grid heats up during its manipulation, the vitreous ice will transform into cubic ice and deteriorate image quality (Dubochet et al., 1988)(Fig. 3e). To avoid this problem, it is imperative to keep the grid cold during the transfer and mounting steps.
5. Ice contamination. During the grid transfer and mounting steps, ambient humidity can condense on the grid and form ice crystals on its surface (Fig. 3f). Such crystals may also be collected from the liquid nitrogen. Furthermore ice crystals loosely attached to the grid may evaporate and re-condense onto the cold grid surface thus forming a continuous or speckled ice layer sometimes difficult to detect. This continuous contamination accumulates over time due to water molecules present in the vacuum of the microscope. Working in a dry environment, changing liquid nitrogen frequently to avoid ice crystal accumulation, handling the grids in liquid nitrogen or very close to the surface and heating/emptying the containers between two freezing sessions will reduce ice contaminations. If contamination builds up rapidly in the microscope, check the anticontamination devices of your microscope.
6. Damaged sample. During cryo-EM sample preparation, protein complexes may be damaged when placed in a thin layer of suspension due to its interactions with the air-water interface. This may result to partial denaturation, dissociation of subunits and aggregation. Sample cross-linking with glutaraldehyde or BS3 as described in section 3.1.2. generally helps stabilizing the molecular assemblies. Alternatively the air-water interface may be screened with amphiphilic molecules such as detergents. In this case the particle concentration may need to be increased since the air/water interface does not concentrate the biomolecules any more. The possibility to absorb the proteins on a continuous carbon film is worth exploring to avoid the air-water interface.
7. Lack of particles. It is difficult to predict the protein concentration needed to produce projection image with densely packed particles. Recent experiments showed that in most cases as much as 90% of the particles accumulate at the air-water interface (Noble et al., 2018). The number of particles adsorbed on the grid depends on their propensity to accumulate at the interface. In the absence of surface accumulation, an extremely rare situation, particle concentrations of 100 mg/ml (10% of the volume) may be needed to produce densely populated images. Absence of particles may therefore also arise from competition for the surface and high concentrations of detergents or of hydrophobic peptides that may shield the surface and prevent surface accumulation of the sample. In extreme cases most of the particles are denatured and form a grainy background. A cross-linking experiment generally helps sorting out this problem.
4 Notes
1. Specimen preparation methods for single particle cryo-EM studies are a key bottleneck for high resolution structural studies. New concepts are emerging from spray systems to microfluidic based
devices and the near future will see the development of novel, more reproducible and more automated systems.
2. The quality of the frozen hydrated grid depends critically on sample homogeneity and stability. It is essential to give the highest priority to protein purification to increase the chances to produce an exploitable grid.
3. Negative staining and cryo-EM are complementary structural biology approaches. Negative staining brings important preliminary information on sample quality and may be used on a daily bases to follow and optimize a purification protocol. Associated with single particle image analysis it may provide precious information on homogeneity or oligomerization states. This information may not be portable for cryo-EM sample preparation but guaranties a firm starting point.
Acknowledgements
We acknowledge support from the Institut National de la Santé et de la Recherche Médicale (INSERM), the Centre National pour la Recherche Scientifique (CNRS), the Ligue contre le Cancer and the grant ANR-10-LABX-0030-INRT, a French State fund managed by the Agence Nationale de la Recherche under the frame program Investissements d’Avenir ANR-10- IDEX-0002-02. We acknowledge the use of resources of the French Infrastructure for Integrated Structural Biology FRISBI ANR-10-INBS-05 and of Instruct-ERIC.
References
Brenner, S., and Horne, R.W. (1959). A negative staining method for high resolution electron microscopy of viruses. Biochim Biophys Acta 34, 103-110.
Cheng, Y. (2018). Single-particle cryo-EM-How did it get here and where will it go. Science 361, 876-880.
Dubochet, J., Adrian, M., Chang, J.J., Homo, J.C., Lepault, J., McDowall, A.W., and Schultz, P. (1988). Cryo-electron microscopy of vitrified specimens. Q Rev Biophys 21, 129-228.
Dubochet, J., Ducommun, M., Zollinger, M., and Kellenberger, E. (1971). A new preparation method for dark-field electron microscopy of biomacromolecules. J Ultrastruct Res 35, 147-167.
Fukami, A., and Adachi, K. (1965). A new method of preparation of a self-perforated micro plastic grid and its application. J Electron Microsc (Tokyo) 14, 112-118.
Jain, T., Sheehan, P., Crum, J., Carragher, B., and Potter, C.S. (2012). Spotiton: a prototype for an integrated inkjet dispense and vitrification system for cryo-TEM. J Struct Biol 179, 68-75.
Noble, A.J., Dandey, V.P., Wei, H., Brasch, J., Chase, J., Acharya, P., Tan, Y.Z., Zhang, Z., Kim, L.Y., Scapin, G., et al. (2018). Routine single particle CryoEM sample and grid characterization by tomography. Elife 7.
Palovcak, E., Wang, F., Zheng, S.Q., Yu, Z., Li, S., Betegon, M., Bulkley, D., Agard, D.A., and Cheng, Y. (2018). A simple and robust procedure for preparing graphene-oxide cryo-EM grids. J Struct Biol
204, 80-84.
Russo, C.J., and Passmore, L.A. (2016). Progress towards an optimal specimen support for electron cryomicroscopy. Curr Opin Struct Biol 37, 81-89.
Vos, M.R., Bomans, P.H., Frederik, P.M., and Sommerdijk, N.A. (2008). The development of a glove-box/Vitrobot combination: air-water interface events visualized by cryo-TEM. Ultramicroscopy 108, 1478-1483.
Figure 1 Negative Staining
(a) The EM grid is glow-discharged in a plasma of ionized air to render the support hydrophilic. (b) 3µl of the purified biomolecules solubilized in buffer are allowed to adsorb on the EM grid support for 1 min. (c) The excess of sample and detrimental buffer components are diluted away by several passes on top of buffer drops. (d) Sample staining: the grid is deposed on the top of a drop of stain - here a 2% of Uranyl Acetate - for 30 s. (e) The staining solution is blotted away using filter paper. (f) Electron micrograph of a well stained sample, particles are well dispersed, show little aggregation and optimal embedding in the stain layer.
Figure 2 Sample Vitrification
(a) Styrofoam holder filled with liquid nitrogen showing the central ethane container. The ethane gas was liquefied holding the pipe appearing on the left into the cold container. (b) The grids is loaded on the tweezers attached to the plunger. (c) 3µl of sample are deposited on the grid which will be lifted up to the filter paper pads that will be automatically pressed against the grid to blot away the excess of liquid. (d) The plunger quickly submerges the grid in the liquid ethane. (e, f) the vitrified sample is transferred into a cryo-box for storage. (g) Electron micrograph of a frozen hydrated sample showing well dispersed particles, little aggregation, thin ice and no ice contamination.
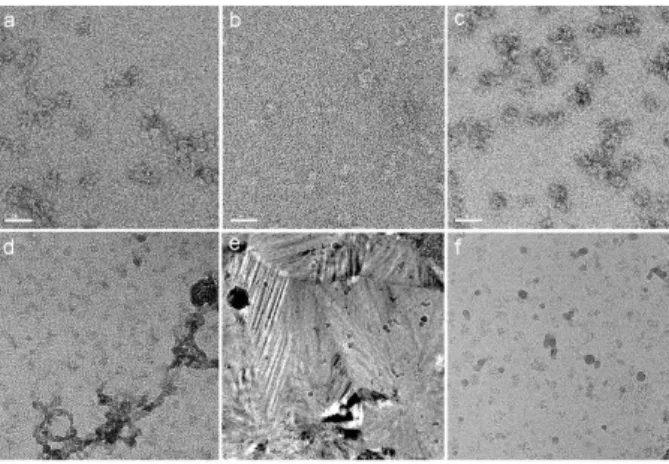
Figure 3 Troubleshooting
Negative staining: (a) Electron micrograph showing aggregated particles. (b) Electron micrograph showing a heavily stained sample in which the details of the particles are lost and the overall contrast is weak due to stain accumulation on top of the particle. (c) In this field, the particles are not well stain embedded and only a small rim of stain surrounds each particle whose structure is poorly sustained.
Sample vitrification: (d) Contaminant filaments (black arrow) arising from residues remaining after ethane evaporation. (e) Transformed ice image due to warning up of the sample during transfer in the microscope. (f) Partially molten hexagonal ice crystals (arrows) are spread over the grid surface and may have been collected during the grid transfer or mounting steps and exposition to humid environment.

![[PDF] Cours Arduino en espagnole PDF | Cours Arduino](data:image/gif;base64,R0lGODlhAQABAIAAAP///wAAACH5BAEAAAAALAAAAAABAAEAAAICRAEAOw==)