HAL Id: cea-02160902
https://hal-cea.archives-ouvertes.fr/cea-02160902
Submitted on 26 Nov 2020
HAL is a multi-disciplinary open access
archive for the deposit and dissemination of
sci-entific research documents, whether they are
pub-lished or not. The documents may come from
teaching and research institutions in France or
abroad, or from public or private research centers.
L’archive ouverte pluridisciplinaire HAL, est
destinée au dépôt et à la diffusion de documents
scientifiques de niveau recherche, publiés ou non,
émanant des établissements d’enseignement et de
recherche français ou étrangers, des laboratoires
publics ou privés.
crucial contributions of gas phase data and simulations
Sana Habka, Thibaut Véry, Jeremy Donon, Vanesa Vaquero-Vara, Benjamin
Tardivel, Florence Charnay-Pouget, Michel Mons, David Aitken, Valérie
Brenner, Eric Gloaguen
To cite this version:
Sana Habka, Thibaut Véry, Jeremy Donon, Vanesa Vaquero-Vara, Benjamin Tardivel, et al..
Identi-fication of ion pairs in solution by IR spectroscopy: crucial contributions of gas phase data and
simu-lations. Physical Chemistry Chemical Physics, Royal Society of Chemistry, 2019, 21 (24),
pp.12798-12805. �10.1039/c9cp00700h�. �cea-02160902�
ARTICLE
a.LIDYL, CEA, CNRS, Université Paris Saclay; CEA Saclay, Bât 522, 91191
Gif-sur-Yvette, France
b.ICMMO, CNRS, Université Paris Sud, Université Paris Saclay, UMR 8182, Bât. 420,
15 rue Georges Clémenceau, 91405 Orsay cedex, France
† present address: Biomolecular Mass Spectrometry and Proteomics, Utrecht University, Padualaan 8, 3584 CH Utrecht, The Netherlands
†† present address: IDRIS-CNRS, Campus Universitaire d’Orsay, BP 167, 91403 Orsay cedex
Electronic Supplementary Information (ESI) available: S1 Gas phase DFT-D calculations; S2 AMOEBA parameters; S3 Conformational search at the AMOEBA force field level; S4 DFT-D calculations in solution; S5 Energy profile between O-O and O-O- conformers of (M+, PA-) systems; S6 Results used to determine mode-dependent scaling functions; S7 Mode-mode-dependent scaled harmonic frequencies and splitting compared to gas phase experimental values; S8 Structural changes from phenylacetic acid to (Cs+, PA-); S9 Results of mode-dependent scaled harmonic frequency calculations in solution at the RI-B97-D3/dhf-TZVPP level. See DOI: 10.1039/x0xx00000x
Received 00th January 20xx, Accepted 00th January 20xx DOI: 10.1039/x0xx00000x
www.rsc.org/
Identification of ion pairs in solution by IR spectroscopy: crucial
contributions of gas phase data and simulations
Sana Habka,a,† Thibaut Very,a,†† Jeremy Donon,a Vanesa Vaquero-Vara,a Benjamin Tardivel,a Florence Charnay-Pouget,b Michel Mons,a David J. Aitken,b Valérie Brennera and Eric Gloaguen*a In a context where structure elucidation of ion pairs in solution remains a contemporary challenge, this work explores an original approach where accurate gas phase spectroscopic data are used to refine high level quantum chemistry calculations of ion pairs in solution, resulting in an unprecedented level of accuracy in vibrational frequency prediction. First, gas phase studies focus on a series of isolated contact ion pairs (M+, Ph-CH2-COO-, with M = Li, Na, K, Rb, Cs) for which conformer-selective IR spectra in the CO2- stretch region are recorded. These experiments reveal the interactions at play in isolated contact ion pairs, and provide vibrational frequencies enabling us to assess the accuracy of the theoretical approach used, i.e., mode-dependent scaled harmonic frequency calculations at the RI-B97-D3/dhf-TZVPP level. This level of calculation is then employed on large water clusters embedding either a free acetate ion or its contact or solvent-shared pairs with a sodium cation in order to simulate the individual vibrational spectra of these species in solution. This study shows that the stretching modes of carboxylate are sensitive to both solvent-shared and contact ion pair formation. FTIR spectra of solutions of increasing concentrations indeed reveal several spectral changes consistent with the presence of specific types of solvent-shared and contact ion pairs. By providing relevant guidelines for the interpretation of solution phase IR spectra, this work illustrates the potential of the approach for the elucidation of supramolecular structures in electrolyte solutions.
Introduction
Characterisation of ion pairs in electrolyte solutions is a challenging task despite the existence of numerous analytical methods which are sensitive to ion pair formation.1, 2 Most of
these methods, including potentiometry or conductometry, suffer from the coexistence of different types of ion pairs in addition to free ions, i.e. contact (CIPs), solvent-shared (SIPs) and other solvent-separated ion pairs (SSIPs), each of them contributing to the total measured signal. In order to identify the respective contributions, the total signal often has to be decomposed using theoretical models that have their own limitations. At best, spectroscopic techniques may provide
direct evidence for the presence of ion pairs, which is often revealed by new spectral features beside those of the free ions identified at weak electrolyte concentrations. However, these techniques still generate data that require interpretation, which has already been shown to be counter-intuitive on several occasions.1, 3 In this context where the individual
spectrum of each type of pair is required, theoretical chemistry is often invoked to provide invaluable reference values and assist with the assignment of spectral features.2, 4 This
situation is typically encountered in vibrational spectroscopy where the help of quantum chemistry is widely appreciated.5, 6
Unfortunately, comparison between bulk experimental spectra and frequency calculations at high quantum chemistry level is not straightforward and is indeed sometimes questionable (poor modelling of the environment around the vibrational probe, simplistic corrections of harmonic frequencies...). In response to the need of benchmark data for each type of ion pair, gas phase investigations have recently proven their ability to provide IR spectra of type-selected pairs by mass- and conformer-selective techniques.7, 8
While numerous charged ion pairs have been investigated in the gas phase,9-20 spectroscopic studies on neutral ion pairs
other than alkali halide systems21, 22 are rare in the literature.
Following the pioneering work of Leone and co-workers in 2007,23 an ion pair from an ionic liquid was characterised by its
IR spectrum in the gas phase, first by helium nanodroplet isolation spectroscopy,24 and by IR/UV double resonance
ARTICLE Journal Name
have been carried out is probably due to the difficulty of forming isolated ion pairs by thermal vaporisation,25 even
though ionic liquids are among the easiest salts to vaporise, which underlines the challenge of such experiments. Recently,8
laser desorption combined with IR/UV spectroscopy was used to study alkali carboxylate salts, less volatile than ionic liquids, and characterise their CIPs by monitoring the CO2- stretch
spectral region, particularly sensitive to the type of pairing.26
Alkali acetates have been the focus of a number of recent studies seeking the characterisation of ion pair distribution in solution as a function of ion concentration. Indeed, the nature of pairing between alkali and carboxylate groups plays an essential role at the solvent-protein interface27, 28 and is
thought to contribute to the poorly understood counter-ion effects observed in the Hofmeister series.29 On the theoretical
side, ion pair type distributions have been calculated at 1 M using a force field specifically designed for electrolyte solutions.30 On the experimental side, dielectric relaxation
spectroscopy31, 32 as well as Fourier-Transformed Infrared
(FTIR) and Raman experiments5, 6 have detected signals
assigned to SIPs, while X-ray absorption spectroscopy experiments in microjets33, 34 claim to have detected CIPs in
the same concentration range.
In order to better understand these phenomena, we now endeavour to provide type-resolved vibrational spectra of ion pairs between a carboxylate anion and an alkali cation. An initial matter to accommodate is that isolated alkali acetate CIPs cannot be interrogated by the conformer-selective IR/UV double resonance technique due to the lack of a near-UV chromophore. This limitation is bypassed by studying alkali phenylacetates (PA-) where the phenyl ring serves as a
chromophore. IR spectra of the isolated CIP series (M+, PA-),
where M = Li, Na, K, Rb or Cs (or Li–Cs in short), are thus presented. Structural assignment is made by comparison with high level quantum chemistry calculations at the B97-D3 level, the reliability of which is also being assessed on these systems at the same time. This theoretical approach, improved by the comparison with gas phase measurements, is then applied to the acetate anion (AcO-) and sodium acetate CIPs and SIPs
solvated by at least two shells of explicit water molecules plus a solvent continuum model, giving an unprecedented description of the structure of these systems at the quantum chemistry level, together with their individual vibrational spectra. FTIR spectra in solution are thus interpreted in light of these new results.
Methods
Gas phase spectroscopy
Spectroscopy of isolated ion pairs was carried out using an experimental approach and setup described elsewhere.8, 35
Briefly, (M+, PA-) ion pairs were first vaporised by laser
desorption of a solid sample comprised of a mixture of the desired salt with graphite, and then cooled down in a supersonic expansion of a 7:3 He:Ne gas mixture. Ion pairs were photo-ionised by a UV laser pulse following a resonant
two-photon ionisation scheme (R2PI) where the wavelength was set to excite the first * state of the phenyl group. Conformer-selective IR spectra in the spectral region of the CO2- stretches were recorded using a IR/UV double resonance
technique.36 For this purpose, an IR laser pulse was sent prior
to the UV pulse tuned to specifically ionise one conformer: when the IR laser wavelength was resonant with a vibrational transition of this conformer, a depopulation of the vibrational ground state occurred, leading to a depletion of the ion signal. Conformer-selective IR spectra were thus obtained by monitoring this signal with a time-of-flight mass spectrometer while the wavelength of the IR laser was scanned.
Theoretical analysis of isolated ion pairs
A conformational search was performed for each (M+, PA-)
system: several structures with different positions of the cation around the carboxylate group were optimised at a dispersion-corrected density functional theory (DFT-D) level,37
RI-B97-D3/dhf-TZVPP,38-40 using TURBOMOLE 7.0 (ESI, section
S1).41 Harmonic vibrational frequencies were calculated at the
same level. Additional single point calculations enabled us to obtain energies at the BSSE-corrected-full-CCSD(T)/dhf-TZVPP//RI-B97-D3/dhf-TZVPP level.42, 43 These energies,
combined with zero point energy and thermodynamic corrections calculated at the RI-B97-D3/dhf-TZVPP level were used to calculate Gibbs energies.
Optimisations and frequency calculations were carried out similarly on a set of previously investigated9-16
carboxylate-containing systems in order to build mode-dependent scaling factors44-46 for the carboxylate symmetric and antisymmetric
stretching modes, labelled (CO2-)sym and (CO2-)anti respectively.
Theoretical spectra of ion pairs in solution
The objective was to calculate vibrational spectra of each type of pair with enough accuracy to compare them with spectra recorded in solution. We thus designed an approach targeting a high level of theory applicable to the ions and their first two solvation shells in order to obtain accurate vibrational frequency calculations, although this level is not compatible with MD simulations. For this purpose, a two-step strategy was followed, whereby (i) the minima of the potential energy surface of explicitly hydrated ions were explored at the AMOEBA polarisable force field level47 using the TINKER
software package,48 and (ii) a selection of representative
structures were further optimised and their harmonic frequency calculated at the RI-B97-D3/dhf-TZVPP level. This strategy was applied to acetate and to sodium acetate ion pairs. The AMOEBA multipolar distribution for acetate was not available in the literature; it was therefore calculated (ESI, section S2).
The systems considered in the first step were aggregates made of (i) a conformationally explored core containing the desired ion(s), acetate either alone or with a sodium cation, surrounded by at least two hydration shells around each ion, (ii) a ~0.8 nm-thick shell made of several hundreds of water molecules frozen in a AMOEBA minimum geometry (Fig. S1). This frozen shell ensured that the density remains fixed at
1.016, which is that of ~0.4 M sodium acetate solution.5
Exploration was conducted following a global method based on a biased Monte-Carlo minimisation algorithm developed by Scheraga49 implemented in TINKER (ESI, section S3).
From the minima found by the exploration, starting structures for geometry optimisations at the RI-B97-D3/dhf-TZVPP level were defined by extracting the ions and three hydration shells around them, i.e. typically a hundred water molecules. Optimisations were then carried out with a frozen outside
shell, and with a solvent continuum model COSMO50
implemented in TURBOMOLE (Fig. S3). Harmonic vibrational frequency calculations were further carried out at the RI-B97-D3/dhf-TZVPP level and restricted to the vibrational modes of the ions and the water molecules H-bonded to the carboxylate group (ESI, section S4).
Solution phase infrared spectra
A stock solution (3.6 M) was made by dissolving sodium acetate trihydrate (4.923 g; Prolabo Normapur® grade) in pure water (PURIST, Rephile Bioscience) to give 10.0 mL of solution. This stock solution was used to prepare a set of sample solutions with concentrations of 3.6, 3.0, 2.4, 2.1, 1.8, 1.5, 1.2, 0.9, 0.6, 0.3 and 0.15 M.
FTIR spectra were recorded on a Perkin-Elmer UATR Spectrum Two infrared spectrometer fitted with a synthetic diamond accessory using the attenuated total reflection (ATR) technique. An aliquot of each sample solution (5 μL) was deposited on the ATR diamond for analysis. Pure water was used as the reference. Data were acquired in the wavenumber range between 1250 cm-1 and 1750 cm-1 with an analysis
interval of 0.2 cm-1 and a spectral resolution of 4 cm-1.
Isolated contact ion pairs
According to the results published for (Li+, PA-),8 the
conformational landscape of (M+, PA-) is expected to be
controlled by two main interactions, anion and cation-. Indeed, three types of conformer were found at the DFT-D level (Fig. 1) and named according to the bond(s) between cations and anions: one or two “O” when M+ binds to one or
two oxygen atoms of carboxylate, respectively, and “π” when M+ binds to the aromatic ring. Conformer O-O is always the
lowest in energy for all alkali cations (Table 1), whereas conformer O- is always found at sufficiently high energy (> 29 kJ mol-1) to render its contribution negligible. Conformer
O-O- was only found for M = K–Cs, with low energies compatible with experimental observation (< 14 kJ mol-1).
However, calculations of the energy profile along the isomerisation path between conformers O-O and O-O- at a higher level of theory (BSSE-corrected-full-CCSD(T)/dhf-TZVPP) suggest that O-O- is not a minimum (Fig. S4). Conformers O-O are thus expected to be the only ones observed experimentally.
Figure 1. Three conformers of (K+, PA-) named according to the
main non-covalent interactions (dashed lines) which characterise their structure.
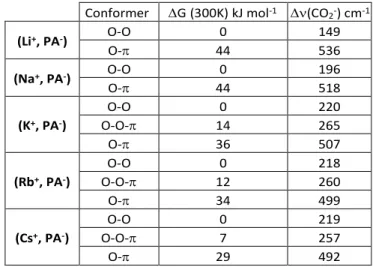
Conformer G(300K) kJ mol-1 (CO2-) cm-1
(Li+, PA-) O-O 0 149 O- 44 536 (Na+, PA-) O-O 0 196 O- 44 518 (K+, PA-) O-O 0 220 O-O- 14 265 O- 36 507 (Rb+, PA-) O-O 0 218 O-O- 12 260 O- 34 499 (Cs+, PA-) O-O 0 219 O-O- 7 257 O- 29 492
Table 1. Gibbs relative energy (G) and harmonic frequency
splitting of the carboxylate stretching modes ((CO2-)) of the
main conformers of (M+, PA-) for M = Li–Cs found at the
RI-B97-D3/dhf-TZVPP level.
Figure 2. IR ion-depletion spectra of (M+, PA-) isolated ion pairs
for M = Li-Cs in the spectral region of the CO2- stretching
modes. Mode-dependent scaled harmonic frequencies built with the scaling functions of Fig. 3 (Table S3) are also shown (bars).
Conformer-selective IR spectra were recorded for the five ion pairs considered (Fig. 2) and revealed the presence of only one conformer for each system. All IR spectra had a single transition in the 1540-1580 cm-1 range corresponding to
(CO2-)anti, and multiplets in the 1370-1460 cm-1 range, resulting
ARTICLE Journal Name
previously observed for (Li+, PA-).8 The frequency splitting of
the CO2- stretching modes is a clear-cut criterion confirming
the assignment to O-O conformers rather than to O- conformers (Table 1). Firstly, the value for conformers O- is too large (~500 cm-1) to fit the experimental data
(115-190 cm-1 range) whereas that for O-O is in agreement
(150-220 cm-1 range). Secondly, the experimental splitting increases
when going down the group of alkali atoms, matching the behaviour predicted for O-O conformers, but not that of O- conformers.
Beyond gas phase studies
This dataset on (M+, PA-) isolated ion pairs provides an
unprecedented benchmark for contact ion pairs between carboxylate groups and alkali cations paired in a bidentate manner. Taken in conjunction with published works on other carboxylate-containing systems in the gas phase,8-16 these
results enable us (i) to evaluate how the vibrational probe (i.e. the carboxylate group) responds to a variety of environments, going from vacuum to doubly charged cations, and from bidentate to monodentate structures, and (ii) to assess the ability of the theoretical approach to quantitatively predict vibrational frequencies (Fig. 3, Tables S2 and S3). Firstly, correlation between experimental and theoretical harmonic frequencies is good for (CO2-)sym and excellent for (CO2-)anti
(standard deviations are 15 and 5 cm-1 respectively), providing
that each mode is considered separately. Secondly, to take advantage of such a good correlation in future calculations, harmonic frequencies must be scaled. To this end, a linear scaling function was determined for each mode. Such an empirical adjustment seeks to correct not only anharmonic effects, but also any systematic error of the method and the basis set, and has already proven considerable prediction capability, especially for non- or weakly coupled vibrational modes.44-46 A first outcome of these gas phase studies was
thus to provide a theoretical approach based on mode-dependent scaled harmonic frequencies at the RI-B97-D3/dhf-TZVPP level which can be used to investigate other systems, such as larger clusters or solution, with the preeminent advantage of knowing the accuracy of the calculation.
Another advantage of such gas phase studies is the isolation and unique documentation of individual species that are usually encountered in solution. Although direct comparison between gas phase and solution phase spectra is insubstantial, the information learned from gas phase isolated pairs is nonetheless useful for interpretation of solution phase data. Given the quasi-planarity of the CO2-M+ part of (M+, PA-) for Li
and Na (Fig. S5), these systems can be considered as reasonable models of bidentate pairs between carboxylate and alkali cations. The spectral shifts observed along this series (Fig. 2) reveal the intrinsic response of carboxylate when immersed in the electric field of these cations in the gas phase. In solution, however, interpretation of spectral shifts along a series is made much more difficult due to other effects (differential solvation, type of pairing). In the context where gas phase benchmarks are now available, we carried out a
critical analysis of recent results on pairing between acetate
and sodium ions,5 and conclude that alternative
interpretations of IR spectra in solution should be considered. This motivated us to perform a theoretical study able to produce vibrational spectra for each type of pair with the hope of suitably addressing assignment issues.
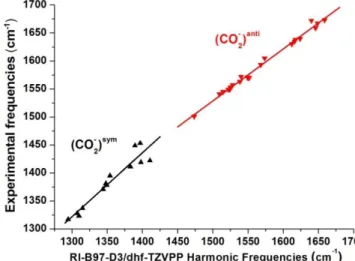
Figure 3. Experimental frequencies plotted against
RI-B97-D3/dhf-TZVPP harmonic frequencies (f0th) (Table S2) for a set
of carboxylate-containing systems in the gas phase8-16, this work
(triangles). An empirical scaling function is deduced for each CO2- stretching mode by linear fitting (lines): fth=1.1431*f0th
-164.3 cm-1 and fth=0.9272*f
0th+137.9 cm-1 for the symmetric
(black) and antisymmetric (red) stretch respectively, where fth
is the mode-dependent scaled frequency.
IR spectra in solution
Free acetate ions. The conformational search for
acetate-containing water aggregates (see section Methods) produced a large variety of structures which lead us to sort them in order to better rationalise their vibrational spectroscopy. The vibrational probe (i.e. the stretching modes of the carboxylate group) responds primarily to its immediate environment, so the structures were classified according to the coordination number of each oxygen atom of the carboxylate group, noted
n and m respectively. The set of structures sharing the same
coordination is noted (n|m), or (n[s]m) when s ligands belong to the first solvation shell of both oxygen atoms. The most frequently found low energy structures belong either to (3|3) (47%), or (3|2) (45%) types (Figure 4, top structures). Very few (8%) structures of other types, such as (2|2), (4|3), (4|2), (3|1) or (4[1]3), were found; they were not subsequently considered. Sampling of the two main types was then carried out: sixteen structures were selected for geometry optimisation and frequency calculations to account for the diversity of structures found in the exploration, although one has to keep in mind that the parameters and the level of theory employed for the conformational search is not expected to provide quantitative ion pair type distributions. Results are presented in Tables 2 and S4.
Types (3|3) and (3|2) have quite different spectral signatures. The frequency splitting of the CO2- stretching modes of (3|3) is
smaller than that of (3|2). A relatively small splitting is indeed expected when the carboxylate group is invested in a symmetric environment (equivalent CO bonds), whereas an asymmetric case would lead to a more pronounced single or double bond character of the CO bonds, and thus to a larger splitting. Considering the type distribution provided by the conformational search, (CO2-)sym and (CO2-)anti of free
acetate ions are predicted at 1427 and 1562 cm-1, respectively.
Given the error expected for this approach (15 and 5 cm-1
respectively) and the qualitative nature of the theoretical ion pair type distribution (see above), these theoretical frequencies agree quite well with the values reported for a dilute sodium acetate solution (1413,5 and 1556 cm-1).5
Theoretical intensities and widths (σ) of the transitions compare reasonably well to the experiment, although underestimations of the width and relative intensity of the antisymmetric transition were noted. Keeping in mind that other modes of smaller intensity are active in this spectral region, and that temperature effects are not taken into account by this theoretical approach, the overall agreement between the experimental and theoretical dataset at low concentration is satisfying.
Figure 4. View of the acetate anion surrounded by its first
solvation shell and the sodium cation, extracted from larger clusters optimised at the RI-B97-D3/dhf-TZVPP level. The type to which each structure belongs is also specified (see sections
Free acetate ions and Sodium acetate ion pairs for type
nomenclature).
Sodium acetate ion pairs. CIP and SIP structures were
organized according to a nomenclature based on that of the free acetate ions. For CIPs, (n|m) is used for structures where the cation is among the n ligands; for SIPs, a(n|m)b is used for
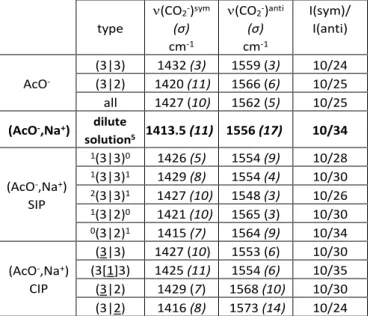
structures where a of the n (resp. b of the m) water molecules belong to the first solvation shell of the cation (Fig. 4). Vibrational frequency changes induced by ion pairing can be seen in Table 2 where the most frequently found structures are reported (see also Table S4). Several trends can be observed, providing that (3|3) and (3|2) structures are considered separately. type (CO2-)sym (σ) cm-1 (CO2-)anti (σ) cm-1 I(sym)/ I(anti) AcO -(3|3) 1432 (3) 1559 (3) 10/24 (3|2) 1420 (11) 1566 (6) 10/25 all 1427 (10) 1562 (5) 10/25
(AcO-,Na+) dilute
solution5 1413.5 (11) 1556 (17) 10/34 (AcO-,Na+) SIP 1(3|3)0 1426 (5) 1554 (9) 10/28 1(3|3)1 1429 (8) 1554 (4) 10/30 2(3|3)1 1427 (10) 1548 (3) 10/26 1(3|2)0 1421 (10) 1565 (3) 10/30 0(3|2)1 1415 (7) 1564 (9) 10/34 (AcO-,Na+) CIP (3|3) 1427 (10) 1553 (6) 10/30 (3[1]3) 1425 (11) 1554 (6) 10/35 (3|2) 1429 (7) 1568 (10) 10/30 (3|2) 1416 (8) 1573 (14) 10/24
Table 2. Mode-dependent scaled harmonic frequencies (),
standard deviations (σ) and intensities (I) of the carboxylate stretching modes of free acetate ions and of its pairs with sodium cations in aqueous solution, compared to experimental data5 (bold) recorded for a dilute solution. Standard deviations
(σ) are given for each set. Relative intensities are also reported with an intensity arbitrarily set at 10 for the symmetric stretch transitions. See text for type nomenclature.
By comparing (3|3) frequencies with that of 1(3|3)0, 1(3|3)1
and 2(3|3)1,one observes that SIP formation from free ions is
accompanied by a red-shift of (CO2-)anti of 5 to 9 cm-1, which is
larger than the accuracy of (CO2-)anti calculations (5 cm-1, see
above). A red-shift of 3 to 6 cm-1 of (CO
2-)sym is also predicted,
but is smaller than the expected accuracy for a calculation of this mode (15 cm-1). Moreover, (3|2), 1(3|2)0 and 0(3|2)1
structures have almost the same frequencies, (CO2-)sym of 0(3|2)1 being the only noticeable exception. IR spectroscopy
may thus not be very sensitive to SIP formation from (3|2) structures. All together, these results show that SIP formation from free ions should result in a measurable red-shift of a few cm-1 of (CO
2-)anti, mainly resulting from the pairing of (3|3)
structures.
Then, regarding the formation of CIPs from SIPs, the frequencies of 1(3|3)0 and 1(3|3)1 on one side, and (3|3) and
(3[1]3) on the other side, are quite similar, making all these species potentially indistinguishable by IR spectroscopy. However, if SIPs 1(3|2)0 and 0(3|2)1 are compared to CIPs (3|2)
and (3|2), one can see that a blue-shift up to 9 cm-1 of
(CO2-)anti is expected during CIP formation.
In conclusion, this theoretical study show that CO2- stretch
ARTICLE Journal Name
and that measurements of spectral shifts can document supramolecular structures in solution.
Experimental spectra. On the one hand, the novel
theoretical approach presented in this article provides absolute vibrational frequencies that are consistent with those of dilute sodium acetate solutions;5 On the other hand,
however, it associates ion pair formation to spectral shifts that have not been previously observed in the 0.03 - 2.2 M concentration range.5 At 2.2 M, the number of water
molecules available per sodium acetate entity is 23, and is comparable to the number of water molecules needed to complete a first solvation shell around each ion (~15 and ~6 water molecules for acetate and sodium ions respectively). ~2.2 M is thus the minimum concentration which ensures the presence of SIP in solution, but no data for the antisymmetric transition at higher concentrations are currently available, to the best of our knowledge. Additional FTIR spectra of sodium acetate solutions of increasing concentrations were recorded from 0.15 to 3.6 M (Fig. 5). This new set of spectra does show a red-shift of the (CO2-)anti transition of a few cm-1 starting at
concentrations as low as 0.3 M up to 3.6 M (Fig. 6). In addition, a red-shift of the (CO2-)sym transition is also observed together
with an increase of the FHWM of both (CO2-)sym and (CO2-)anti
transitions. These observations combined with the present simulations can then be used to document the supramolecular structures in solution.
Figure 5. FTIR spectra of sodium acetate solutions of increasing
concentration: 0.15, 0.3, 0.6, 0.9, 1.2, 1.5, 1.8, 2.1, 2.4, 3.0 and 3.6 M. Dashed lines mark the maximum of the (CO2-)sym and
(CO2-)anti transitions at 0.15 M, highlighting the red-shift of
these transitions at higher concentrations.
First, the increase of FHWM reveals the increasing diversity of structures in which the carboxylate is engaged, and is thus consistent with ion pair formation. According to our theoretical study, the red-shift of the (CO2-)anti transition at low
concentration can be assigned to the formation of SIPs such as
1(3|3)0, 1(3|3)1 or 2(3|3)1. The red-shift of the (CO2-)sym
transition is also consistent with the formation of these species, as suggested by calculations (Table 2). As concentration is increased up to 3 M, where CIPs must be
formed according to the number of water molecules left per sodium acetate entity, the CO2- stretch transitions still red-shift
(Fig. 6), but a change of slope can be seen for (CO2-)anti around
2 M. The relatively smaller rate of red-shift above 2 M may indicate the appearance of new species with a blue-shifted (CO2-)anti: this slowdown in red-shift could then result from an
on-going population increase of species inducing a red-shift of the (CO2-)anti transition, such as 1(3|3)0, 1(3|3)1, 2(3|3)1 SIPs, or
(3|3), (3[1]3) CIPs coupled to the appearance of species inducing a blue-shift, such as (3|2) or (3|2) CIPs. Consequently, the change of slope at ~2 M could mark the concentration threshold for CIP appearance. Above ~3 M, there are not enough water molecules to complete the first solvation shell around the most compact CIP. Ionic clusters larger than ion pairs are thus expected to contribute to the IR spectrum, but have not been investigated.
Figure 6. Peak position and full width at half maximum
(FWHM) of the (CO2-)sym (black) and (CO2-)anti (red) transitions
of FTIR spectra of Fig. 5 as a function of concentration.
An estimation of the ion pair type distribution was done previously by molecular simulations at the classical force field level,30 which predicted a significant contribution (33%) of SIPs
to the total acetate distribution at 1 M. These values support that enough SIP can be formed to be detected below 1 M, although these theoretical ion pair type distributions might be only qualitative due to the use of a non-polarisable force field.30
The FTIR spectra of the present work, however, differs significantly from previous similar experiments on both absolute frequencies, spectral shifts and FWHM of the CO2
-stretch transitions:5 (i) free acetate transitions were observed
at 1413.5 and 1556 cm-1, vs. 1415 and 1551 cm-1 in this work,
(ii) observation of a 1.5 cm-1 blue-shift of (CO2-)sym between 0
and 5 M, vs. 4 cm-1 red-shift between 0.15 and 3.6 M, (iii) 24
vs. 39 cm-1 for the symmetric transition of free acetate. This
disparity may be ascribed to the differences between the operating conditions. In particular, solutions were investigated in this work at the surface of a synthetic diamond using the attenuated total reflection (ATR) technique, whereas Rudolph et al.5 studied solutions of capillary thickness between AgCl
interfaces on ion pairing,51, 52 it is legitimate to believe that
these latter experimental conditions may particularly favour ion pairing/clustering at the surface of AgCl windows, which might explain the difference between both sets of experiments.
Conclusions
In this work, IR spectra of isolated ion pairs between phenylacetate and alkali cations (Li-Cs) were recorded, and revealed the vibrational signature of carboxylate groups paired with alkali cations. Thanks to this unique dataset and other previous gas phase works, an original theoretical approach was designed to provide the vibrational signature of free acetate ions and its pairs with sodium ions in solution. In addition to provide theoretical spectra of free acetate ions in quantitative agreement with experimental spectra of dilute sodium acetate solution, this theoretical study found that ion pair formation should result in spectral shifts of the CO2- stretching modes
depending on the type of ion pair formed. Such shifts were indeed observed by FTIR spectra in solution, demonstrating the sensitivity of this technique to ion pair formation. Specific SIPs and CIPs consistent with the observed spectral shifts were identified, and are thus likely to play a prominent role in ion pairing between sodium and acetate. Collectively, these results illustrate how accurate experimental gas phase data combined with a quantitative theoretical approach in solution provide invaluable benchmark data that can be used to investigate supramolecular structures in electrolyte solutions.
Conflicts of interest
There are no conflicts of interest to declare.
Acknowledgements
EG would like to acknowledge the work of undergraduate students A. Ghandri, S. Goursaud, S. Bourg and S. de Lima-Barbosa. EG gratefully thank ANR (grant ANR-16-CE29-0017),
GENCI-TGCC (projects
t2016087524-A0010807524-A0030807524 and p615) and LabEx PALM (ANR-10-LABX-0039-PALM) for their support.
References
1. Y. Marcus and G. Hefter, Chem. Rev., 2006, 106, 4585.
2. N. F. A. van der Vegt, K. Haldrup, S. Roke, J. R. Zheng, M. Lund and H. J. Bakker, Chem. Rev., 2016, 116, 7626.
3. G. Hefter, Pure Appl. Chem., 2006, 78, 1571. 4. P. Jungwirth, J. Phys. Chem. B, 2014, 118, 10333.
5. W. W. Rudolph, D. Fischer and G. Irmer, Dalton Transactions, 2014, 43, 3174.
6. W. W. Rudolph and G. Irmer, RSC Adv., 2015, 5, 21897.
7. R. Cooper, A. M. Zolot, J. A. Boatz, D. P. Sporleder and J. A. Stearns, J. Phys. Chem. A, 2013, 117, 12419.
8. S. Habka, V. Brenner, M. Mons and E. Gloaguen, J. Phys. Chem. Lett., 2016, 7, 1192.
9. C. Kapota, J. Lemaire, P. Maitre and G. Ohanessian, J. Am. Chem. Soc., 2004, 126, 1836.
10. R. C. Dunbar, N. C. Polfer and J. Oomens, J. Am. Chem. Soc., 2007, 129, 14562.
11. M. F. Bush, J. Oomens, R. J. Saykally and E. R. Williams, J. Am. Chem. Soc., 2008, 130, 6463.
12. R. C. Dunbar, A. C. Hopkinson, J. Oomens, C. K. Siu, K. W. M. Siu, J. D. Steill, U. H. Verkerk and J. F. Zhao, J. Phys. Chem. B, 2009,
113, 10403.
13. J. Oomens, J. D. Steill and B. Redlich, J. Am. Chem. Soc., 2009,
131, 4310.
14. M. K. Drayss, D. Blunk, J. Oomens, B. Gao, T. Wyttenbach, M. T. Bowers and M. Schafer, J. Phys. Chem. A, 2009, 113, 9543. 15. R. C. Dunbar, J. D. Steill and J. Oomens, Phys. Chem. Chem.
Phys., 2010, 12, 13383.
16. M. K. Drayss, P. B. Armentrout, J. Oomens and M. Schaefer, Int. J. Mass Spectrom., 2010, 297, 18.
17. R. C. Dunbar, in Gas-Phase IR Spectroscopy and Structure of Biological Molecules, eds. A. M. Rijs and J. Oomens, Springer-Verlag Berlin, Berlin, 2015, vol. 364, pp. 183.
18. W. J. Zhang, G. L. Hou, P. Wang, H. G. Xu, G. Feng, X. L. Xu and W. J. Zheng, J. Chem. Phys., 2015, 143.
19. G. L. Hou, C. W. Liu, R. Z. Li, H. G. Xu, Y. Q. Gao and W. J. Zheng, J. Phys. Chem. Lett., 2017, 8, 13.
20. J. W. DePalma, P. J. Kelleher, L. C. Tavares and M. A. Johnson, J. Phys. Chem. Lett., 2017, 8, 484.
21. A. M. Sadoon, G. Sarma, E. M. Cunningham, J. Tandy, M. W. D. Hanson-Heine, N. A. Besley, S. F. Yang and A. M. Ellis, J. Phys. Chem. A, 2016, 120, 8085.
22. J. Tandy, C. Feng, A. Boatwright, G. Sarma, A. M. Sadoon, A. Shirley, N. D. Rodrigues, E. M. Cunningham, S. F. Yang and A. M. Ellis, J. Chem. Phys., 2016, 144.
23. D. Strasser, F. Goulay, M. S. Kelkar, E. J. Maginn and S. R. Leone, J. Phys. Chem. A, 2007, 111, 3191.
24. E. I. Obi, C. M. Leavitt, P. L. Raston, C. P. Moradi, S. D. Flynn, G. L. Vaghjiani, J. A. Boatz, S. D. Chambreau and G. E. Douberly, J. Phys. Chem. A, 2013, 117, 9047.
25. M. J. Earle, J. Esperanca, M. A. Gilea, J. N. C. Lopes, L. P. N. Rebelo, J. W. Magee, K. R. Seddon and J. A. Widegren, Nature, 2006, 439, 831.
26. M. Nara, H. Torii and M. Tasumi, J. Phys. Chem., 1996, 100, 19812.
27. K. D. Collins, Biophys. Chem., 2006, 119, 271. 28. K. D. Collins, Biophys. Chem., 2012, 167, 43.
29. P. Lo Nostro and B. W. Ninham, Chem. Rev., 2012, 112, 2286. 30. B. Hess and N. F. A. van der Vegt, Proc. Natl. Acad. Sci. U. S. A.,
2009, 106, 13296.
31. H. M. A. Rahman and R. Buchner, Journal of Molecular Liquids, 2012, 176, 93.
32. H. M. A. Rahman, G. Hefter and R. Buchner, J. Phys. Chem. B, 2012, 116, 314.
33. E. F. Aziz, N. Ottosson, S. Eisebitt, W. Eberhardt, B. Jagoda-Cwiklik, R. Vacha, P. Jungwirth and B. Winter, J. Phys. Chem. B, 2008, 112, 12567.
34. J. S. Uejio, C. P. Schwartz, A. M. Duffin, W. S. Drisdell, R. C. Cohen and R. J. Saykally, Proc. Natl. Acad. Sci. U. S. A., 2008,
105, 6809.
35. E. Gloaguen, H. Valdes, F. Pagliarulo, R. Pollet, B. Tardivel, P. Hobza, F. Piuzzi and M. Mons, J. Phys. Chem. A, 2010, 114, 2973. 36. R. H. Page, Y. R. Shen and Y. T. Lee, J. Chem. Phys., 1988, 88,
ARTICLE Journal Name
37. S. Grimme, J. Antony, S. Ehrlich and H. Krieg, J. Chem. Phys., 2010, 132, 19.
38. A. Schäfer, C. Huber and R. Ahlrichs, J. Chem. Phys., 1994, 100, 5829.
39. F. Weigend, M. Häser, H. Patzelt and R. Ahlrichs, Chem. Phys. Lett., 1998, 294, 143.
40. F. Weigend and A. Baldes, J. Chem. Phys., 2010, 133.
41. TURBOMOLE V7.0 2015, a development of University of Karlsruhe and Forschungszentrum Karlsruhe GmbH, 1989-2007,
TURBOMOLE GmbH, since 2007; available from
http://www.turbomole.com
42. S. F. Boys and F. Bernardi, Mol. Phys., 1970, 19, 553.
43. K. Raghavachari, G. W. Trucks, J. A. Pople and M. Headgordon, Chem. Phys. Lett., 1989, 157, 479.
44. H. S. Biswal, Y. Loquais, B. Tardivel, E. Gloaguen and M. Mons, J. Am. Chem. Soc., 2011, 133, 3931.
45. R. J. Plowright, E. Gloaguen and M. Mons, Chemphyschem, 2011, 12, 1889.
46. E. Gloaguen and M. Mons, in Gas-Phase IR Spectroscopy and Structure of Biological Molecules, eds. A. M. Rijs and J. Oomens, 2015, vol. 364, pp. 225.
47. M. L. Laury, L. P. Wang, V. S. Pande, T. Head-Gordon and J. W. Ponder, J. Phys. Chem. B, 2015, 119, 9423.
48. TINKER V7.1-2015, Software tools for molecular design, Jay Ponder Lab, Department of Chemistry, Washington University, Saint Louis, Missouri 63130 U.S.A.; available from http://dasher.wustl.edu/tinker/
49. L. Piela, J. Kostrowicki and H. A. Scheraga, J. Phys. Chem., 1989,
93, 3339.
50. A. Klamt and G. Schuurmann, J. Chem. Soc., Perkin Trans. 2, 1993, DOI: 10.1039/p29930000799, 799.
51. D. E. Otten, R. Onorato, R. Michaels, J. Goodknight and R. J. Saykally, Chem. Phys. Lett., 2012, 519-20, 45.
52. L. X. Dang, G. K. Schenter and C. D. Wick, Journal of Physical Chemistry C, 2017, 121, 10018.