HAL Id: hal-01077360
https://hal.archives-ouvertes.fr/hal-01077360
Preprint submitted on 22 Oct 2015
HAL is a multi-disciplinary open access archive for the deposit and dissemination of sci-entific research documents, whether they are pub-lished or not. The documents may come from teaching and research institutions in France or abroad, or from public or private research centers.
L’archive ouverte pluridisciplinaire HAL, est destinée au dépôt et à la diffusion de documents scientifiques de niveau recherche, publiés ou non, émanant des établissements d’enseignement et de recherche français ou étrangers, des laboratoires publics ou privés.
A graphical model for sustainable tourism in protected
areas
Jean-Charles Briquet-Laugier
To cite this version:
Jean-Charles Briquet-Laugier. A graphical model for sustainable tourism in protected areas. 2014. �hal-01077360�
A graphical model for sustainable tourism in protected areas
Jean-Charles Briquet-Laugier1
february 2014
(please do not quote or distribute without permission)
The goal of this paper is to expose a new theoretical model that tries to consider jointly ecological, socio-cultural and economic aspects of sustainable tourism in protected areas. This graphical model, called VQ-MS, is divided into four quadrants corresponding to: relations between the tourists and the environment, tourist satisfaction, average tourist spending and tourism economic impact. This model is an initiative to promote interdisciplinary researches and to study the question of sustainable tourism with multi-criteria analyses. In order to implement this model, we assume that it can constitute an additional management system and can be applied to many situations in protected areas.
Keywords: sustainable tourism, protected areas, ecological-economic modelling, multi-criteria analysis, visitor management system
1. Introduction
The goal of this paper is to expose a new theoretical model for sustainable tourism in
protected areas. The term "sustainable tourism" is derived from the general concept of
sustainable development, defined in [1] as "development that meets the needs of the present
without compromising the ability of future generations to meet their own needs." After the
emergence in the literature of multiple definitions of sustainable tourism (see [2]), this
concept was formulated on an international scale at the World Conference on Sustainable
Tourism (island of Lanzarote, 1995): "Tourism development shall be based on criteria of
sustainability, which means that it must be ecologically bearable in the long term, as well as
economically viable, and ethically and socially equitable for local communities."
Since, every scientific discipline has made important contributions to the field of
sustainable tourism. In the case of protected areas, the development of this concept has
resulted in the publication of several principles, guidelines (e.g., [3]) and declarations (e.g.,
European Charter for Sustainable Tourism in Protected Areas). From this point of view, the
protected area management frameworks developed in both the US and Canada are interesting
1 Maison des Sciences de l’Homme et de la Société Sud-Est (MSHS Sud-Est), Université Nice - Sophia
Antipolis. Pôle Universitaire Saint-Jean d'Angély 3, 24 avenue des diables bleus, 06357 Nice CEDEX 4. E-mail address : [email protected]
examples of policy tools for sustainable tourism: among them, the Limits of Acceptable
Change (LAC, [4]) system is probably the most well known.
Nevertheless, the implementation of sustainable tourism concepts remains a central issue
and the goal of this paper is to propose an interdisciplinary model that links the environmental
protection to the socio-economic impacts of tourism. This graphical model, called VQ-MS, is
divided into four quadrants. The second part of this paper presents the quadrants 1 and 2 of
the model and describes the relationship between tourist attendance and environmental
quality. It shows that environmental quality is a important determinant of demand / visitor
satisfaction and that an increase in the number of visitors can have negative effects on the
environment.
The third section discusses the capacity of tourism to produce economic development
(quadrants 3 and 4 of the model). Firstly, it introduces the characteristics and the measure of
the average visitor spending. Secondly, it presents the definition of the economic impacts of
tourism (EIT).
The complete VQ-MS model is presented in section five. This model provides an
interdisciplinary framework of sustainable tourism, but it can also be used to evaluate the
socio-economic and environmental impacts of alternative management strategies in order to
help the decision making process in protected areas.
2. Tourism and the environment
The visitor attendance (noted V) is bound to the environmental quality (noted Q) by a
double relation:
- the tourism activity is accompanied by significant negative effects on the environment
(Q is dependent on V). The development of tourism sometimes causes the destruction of the
resource which was at the origin of the attraction of the visitors (environmental impact of
- the environmental quality is an important factor of the tourist demand (V is dependent
on Q); it constitutes the basic resource upon which the tourism prosperity and development
depends, so that any environmental pollution compromises the viability of tourism activity.
Conversely, a preserved environment contributes to the development of tourism
(environmental factor of tourism demand).
According to the definitions of the World Commission on Protected Areas (these
definitions are documented in [5]), the variable V can be defined by the number of visitors (a
person who visits the protected area), the number of visits (a visit corresponds to an entry -
the visit statistic has generally no length of data associated with it) or the number of visit-day
or visit hour (if additional data on the length of stay of a visit is available). In our model, we
will use the concept of number of visitor to define V. The environmental quality Q can be
measured by various indicators (e.g., water quality, species richness) and indexes, like the
Costanza's ecosystem health index [6].
First of all, it is important to describe the idea that each of the two variables constitutes
the main factor that determines the evolution of the other. This basic assumption is more
particularly adapted to the situation of protected areas, even if more general considerations on
other tourist destinations can be developed.
2.1. Environmental impacts of tourism
Tourism has inevitably a large environmental impact, because of its importance and its
characteristics (strong concentration of visitors on restricted periods and small areas).
Recreational users are one of the major causes of direct environmental impacts in protected
areas [7]. These direct impacts can concern: soils, water resources, vegetation, animal life,
It is worth mentioning here that some goods (water resources, ecosystems, wildlife...) are
characterized by subtractability and nonexcludability. "Subtractability" deals with whether or not one person’s appropriation of a resource reduces the availability of that resource for others and "exclusion" refers to the degree to which access to a resource can be restricted [9]. These
natural resources are used in common by tourists (and locals) and exclusion is difficult or
impossible: they possess the characteristics of "common pool resources" (CPRs). As a result,
the competition between the users leads to the "tragedy of the commons" [10], where overuse
of the resources is a typical problem. Thus, the analysis of common pool resources in tourism
("tourism commons") and their management play an essential role in sustainable tourism
development [11].
The consequence of the definition of common pool resources is that their quality is
generally related to their level of "consumption". In other words, when the number of visitors
(V) increases, quality (Q) decreases and the negative effects on quality are generally
cumulative.
The simple relation connecting Q to V must however be developed because quality also
depends on:
- visitor activities (a): camping, recreational fishing and hunting, walking,... ;
- visitor behaviour (b);
- tourism facilities and infrastructure (i).
But it should be noted that other variables (not related to tourism) affect the
environmental quality (external effects noted x): other human activities (industry,
agriculture...), non-native species and natural ecosystem cycles.
Therefore, the relation between Q and V is much more complex and the function
impacts of visitors vary according to their number and nature and the characteristics of the site
in terms of behaviour and resilience to the presence of humans [13]. In this theoretical
framework, we will use a negative curvilinear function between Q and V (figure 1). In a more
complete analysis, we can also consider the social and cultural impacts of tourism with a new
function C = h (V, a, b, i), where C is a social and cultural indicator.
From an empirical point of view, even if the impacts of the human activities on the
environment are better known, the construction of such a function remains difficult. The
definition of the ecological impacts of tourism actually encounters several difficulties [14]:
- the impacts due to each tourist activity of those due to natural phenomena and other
human activities are difficult to distinguish;
- the impacts of the facilities and services related to tourism are difficult to measure,
insofar as they are shared with other activities (e.g., transport);
- baseline data over long periods allowing to measure and explain impacts are often
lacking (weakness of the indicators);
- human and natural impacts may have spatial and temporal dimensions which are not
easy to see or understand.
2.2. The impact of the environment on tourism
Tourism demand is influenced by many factors. In accordance with our basic assumption,
the number of tourists (V) depends initially on the environmental quality (Q). The importance
of environment variables in attracting visitors is significant, particularly on protected areas.
Other explanatory variables of V are relative to the tourism supply in terms of quantity
and quality:
- i: facilities and infrastructures related to tourism;
- p: relative prices (of tourism goods and services);
Lastly, it is essential to consider a whole set of socio-economic explanatory variables (e)
among which the demography, the economy (income), the mobility and the family, the work,
the consumption and the consumers system of values.
To give an example, the exploratory study of these determinants in the French case insists
on the major phenomena which are: the ageing of the population, the fragmentation of the
households, the rise of the role of the women, the education, the inequalities, the new forms of
activity and work...
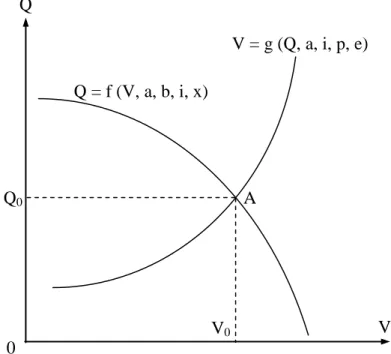
The demand function V = g (Q, a, i, p, e) will be considered in the following pages as a
simple positive function. The double relation between V and Q can be shown in figure 1:
Figure 1. Relationship between the number of visitors and the environmental quality.
In this figure the environmental quality and the number of visitors are closely dependent
and point A represents the situation of equilibrium (V0, Q0). However, this situation of
equilibrium would be seldom reached in reality or would not be durable (because of the fast
evolution of the parameters a, b, e, i, p and x). More specifically, the observed value of Q will
be important to determine the visitor utility. Q V V = g (Q, a, i, p, e) Q = f (V, a, b, i, x) V0 0 Q0 A
2.3. Visitor utility
An increase of the consumer's utility can generally be measured by the consumer's
surplus symbolized by the area between the ordinary demand function and the horizontal line
drawn at the equilibrium market price. This area represents the amount that consumers benefit
by being able to purchase a product for a price that is less that they would be willing to pay.
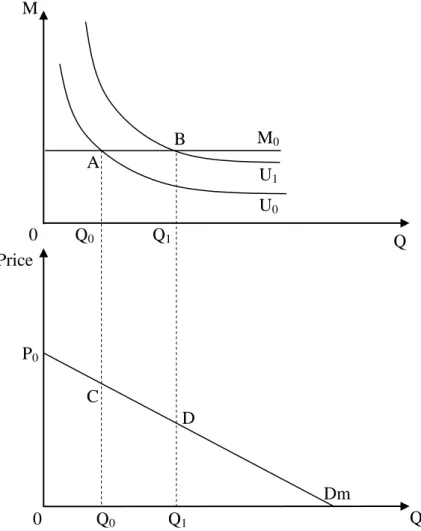
In the lower part of figure 2, the ordinary demand curve is noted Dm (this demand curve
shows the maximum amount a visitor would be willing to pay for each level of Q). The line of
price is the x-axis on which the price is equal to zero, a typical case with a pure collective
good, like wildlife or quality of the air (noted like previously Q). The "consumption" of Q, for
which there is no market and thus no price, is determined by its initial available quantity Q0.
The consumer's surplus (or the amount of value the visitor receives over and above what he
was required to pay) is equal to the area 0P0CQ0.
The higher part of the figure indicates the indifference curves for two levels of utility (U0
and U1) between the environmental quality Q and the income M (M can be interpreted as the
sum of the other goods that can be consumed by an individual and M is independent of Q).
The environmental quality Q0 corresponds to the point A on the indifference curve U0. An
increase in the environmental quality (from Q0 to Q1) means a rise of the satisfaction from A
on U0 to B on U1 (initial income M0 is not affected by the increase of Q). The increase in the
consumer's surplus that results from this increase corresponds to the area Q0CDQ1. In fact,
the variations of environmental quality do not have effects on the income (M0) and the result
Figure 2. Indifference curves and consumer's surplus.
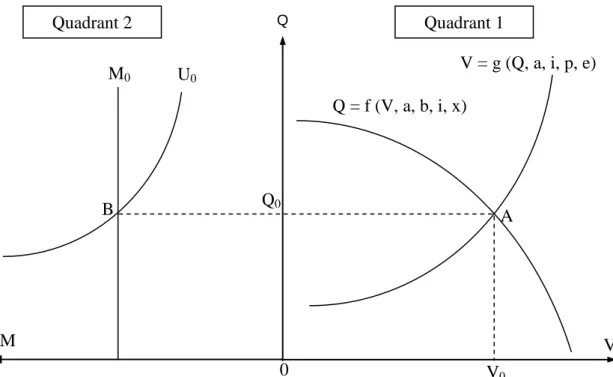
We can link the analysis of the visitors’ utility (or satisfaction) to the relations defined
previously in a new figure: the observed environmental quality Q0 corresponds to point B on
the indifference curve U0 (quadrant 2).
M A B Q Q Price P0 C D Q0 Q1 Q0 Q1 0 Dm M0 U0 U1 0
Figure 3. Relationship between number of visitors, environmental quality and visitor satisfaction.
Despite the importance of the relations between tourism, environment and satisfaction
highlighted in this first section, we should not overlook the fact that tourism is often a major
source of economic development for some areas (economic aspect of the definition of
sustainable tourism).
3. Economic impact analysis of tourism
Tourism in protected areas constitutes a significant source of economic development
significant for many regions. Visitor spending impacts the local economy in terms of sales,
income, employment and value added. In this section we will first study the characteristics
and the evaluation of the visitor spending, before considering the total economic impact.
3.1. Average visitor spending
The value of the average visitor spending generally comes from visitors surveys;
sometimes, it is adapted from studies on comparable sites. This estimation must be based on a
representative sample of the visitor population by considering the variations between the
Q V V = g (Q, a, i, p, e) Q = f (V, a, b, i, x) V0 0 Q0 A M0 M U0 B Quadrant 1 Quadrant 2
In order to determine the total economic impact, more complete information about the
amount of spending must be obtained [15]. It is then necessary that spending should be
estimated for different subgroups of visitors (campers, day users, visitors in campgrounds,
etc.) and for several spending categories (lodging, food, transportation, recreation, souvenirs,
etc.).
Beyond the simple observation of the tourist expenditure, it is interesting to discuss the
spending variations that result in changes in income.
If we refer to Engel's laws, as income rises, the percentage of income spent on food
decreases, while the percentage spent on clothing and housing remains constant. At the same
time, the percentage of income spent on luxuries (e.g., transport and telecommunication,
leisure, vacations) increases.
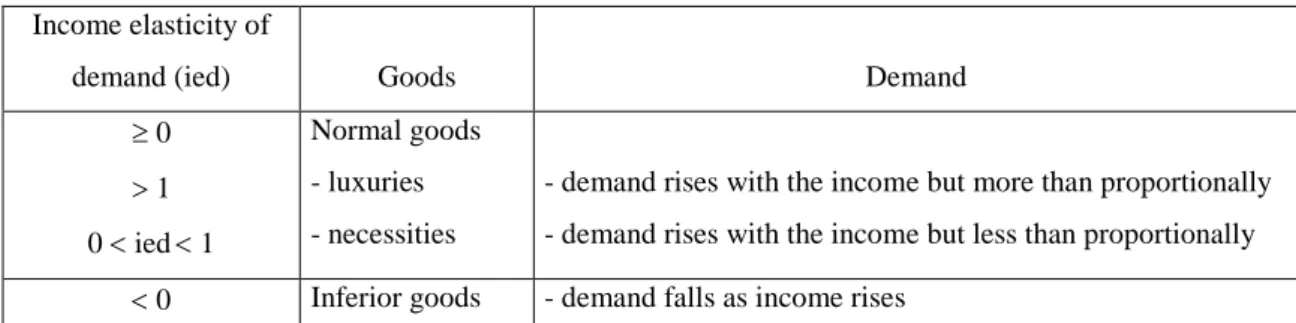
Income elasticity of demand can be used to define the various goods: it measures the
relationship between a change in quantity demanded and a change in income (the basic
formula to calculate income elasticity of demand is: percentage change in quantity of good G
divided by the percentage change in real income):
Table 1. Income elasticity of demand. Income elasticity of
demand (ied) Goods Demand
0 1 0 ied 1 Normal goods - luxuries - necessities
- demand rises with the income but more than proportionally - demand rises with the income but less than proportionally 0 Inferior goods - demand falls as income rises
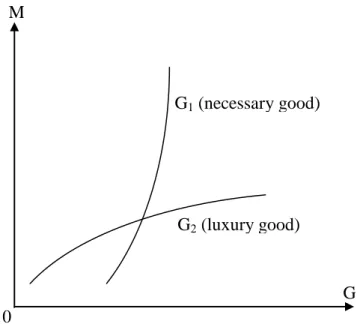
The Engel's curves (demands for a necessary good G1 and a luxury good G2 as the
Figure 4. Engel's curves for a necessary good and a luxury good.
In general, tourism has an income elasticity of demand greater than 1. This is an
empirical fact for many regions, and we will accept this hypothesis for the moment: in the
framework of our theoretical model, the relationship between the income (M) and the average
visitor spending (S) will take a similar form to the Engel's curve for luxury goods. The initial
income M0 will thus determine the average visitor spending S0.
Nevertheless, it is necessary in a more complete demand analysis to take some elements
into account: the consumption habits, the social groups, the household size, the tourist's
motivation, opinions, etc. In this manner, the heterogeneous character of the budgets can
change the form of the curve, even for households having rather close levels of income.
Therefore, the income elasticity of demand may be quite different if we consider that the
visitor expenditure is made up of leisure goods but also of necessary goods (food, lodging).
The analysis of the evolution of the tourist expenditure after a variation of the relative
prices (of the tourist activities and services related to tourism) must be considered with similar M
G G1 (necessary good)
G2 (luxury good)
the more the demand increases (the price elasticity of demand measures the responsiveness of
the quantity demanded of a good to its price). But the demand can also vary in a different way
according to the product or the general economic situation (it may be possible that demand for
a good rises as its price rises). The demand for a good can also be affected by a change in the
price of another good: this effect is measured by the cross elasticity of demand. For example,
if the price of a tourism activity decreases, this will cause an increase in the sales of derived
products (complementary goods) and a decrease in the demand for the concurrent activities
(substitute goods), but that will not affect the demand for lodging (independent goods). The
variation of the tourist expenditure according to the trend of prices is thus very uncertain
when it relates to a whole of diversified consumer goods and services.
From an empirical point of view, numbers of models have tried to estimate the tourism
demand, in term of number of tourists as well as their expenditures. These predictions are
generally based on judgement (Delphi method), time series methods or structural models. In a
review of one hundred international demand models [16], it is showed that the majority of
these studies follow a single-equation time series approach, while only nine studies used panel
data and nine used cross-section data.
In the context of national studies, satellite accounts (that extract tourism-related activity
from a system of national accounts) are generally used. When spending is desired for
particular market segments or for local regions, survey approaches are necessary. They
constitute the first step to determine the total tourism economic impact.
3.2. Economic impacts of tourism
The analysis of the contribution of the tourist activity to the economic development is to
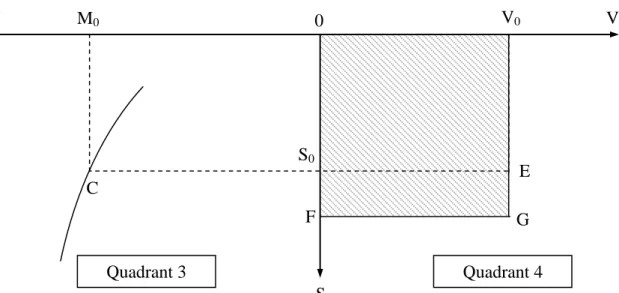
is usually calculated by multiplying the average spending (per visitor, visits, etc.) by the
visitor numbers. The units of the two variables must obviously be compatible. In our model,
the total visitor spending is obtained by multiplying the average visitor spending (S0) by the
number of visitors (V0): area 0S0EV0 in figure 5.
In reality, the tourist spending statistics (official or revealed by surveys) do not give a
precise idea of the real impact of this activity on the economy. The capacity of tourism to
produce economic development must be approached by studying the various effects of an
injection of tourist expenditure. The initial tourist spending on goods and services in hotels,
restaurants, shops, etc. creates changes in sales, income and jobs in the local area (direct
effects). From the direct expenditure, tourism establishments will pay out wages to the local
employees and will reconstitute their stocks from local suppliers and wholesalers: the changes
in sales, income and jobs in "backward-linked" activities are called indirect effects. Lastly, the
income earned through the direct of indirect effects of the visitor spending will generate a rise
in the local consumption expenditure: these additional turnover, income and job opportunities
are called induced effects. The sum of the indirect and induced effects constitutes the
secondary effects, in opposition to direct effects which result from the initial increase in the
tourist expenditure. It is however significant to note that these effects are limited by the
savings, the payments of taxes to the central and local governments and the imports induced
by the additional expenditure.
The effects of an increase in the tourist expenditure can be captured by multipliers. Four
types of tourism multipliers are in common use: the sales multiplier, the output multiplier, the
income multiplier and the employment multiplier [17]. Within these categories, there are
many different kinds of multipliers used to estimate the secondary or multiplier effects; for
sales while the Type II sales multiplier indicates the ratio of direct, indirect and induced sales
to direct sales.
Although the analyses of these secondary effects are often sophisticated, the economic
impacts of tourism (EIT) can be estimated by the simple equation:
EIT = number of tourists * average spending by visitor * multiplier
In our model, EIT are symbolized by the area 0FGV0:
Figure 5. Average visitor spending and economic impacts of tourism.
The evaluation of the multipliers necessitates the use of models, more or less
sophisticated: a base model (where two sectors - export activities and local activities - are
linked by stable and linear relationships), a keynesian model (where additional income and
employment are generated in "rounds" and diminish in geometric progression) or an
input-output model (I-O model). The input-input-output models (see [18,19]) are probably the more
frequently used tools to evaluate economic impacts from tourism: they express a relationship
of the different economic sectors in matrix form, built on the result of a study of the effects of
tourist expenditure.
For example, the US National Park Service's (NPS) Money Generation Model (MGM)
and its update (MGM2) are input-output models which estimates the impacts that NPS
visitors have on the economy of protected areas in terms of their contribution to sales, income
M0 0 S S0 V0 C E F Quadrant 3 Quadrant 4 M V G
and jobs [20,21]. In the MGM2 model, visitors are divided into eight distinct subgroups and
visitor spending is itemized in twelve spending categories.
4. A theoretical model for sustainable tourism in protected areas
4.1. The VQ-MS model and interdisciplinary researches
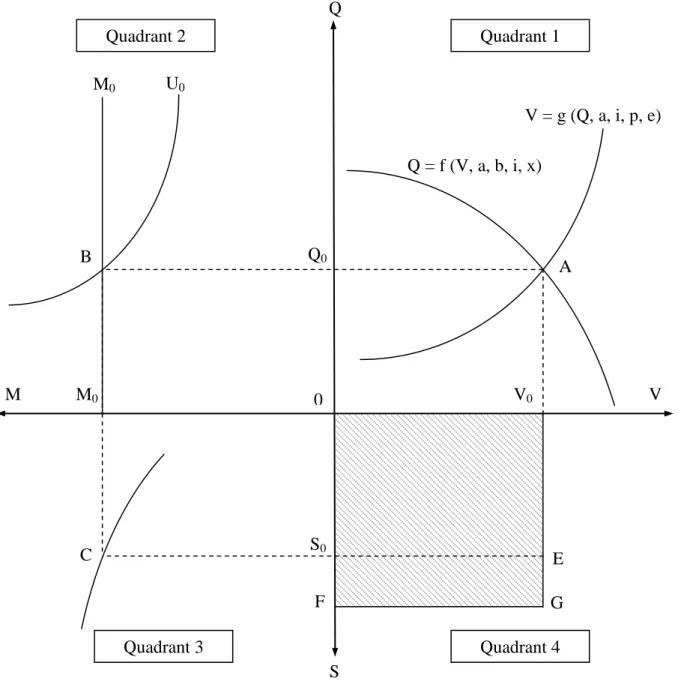
The relations described in section 2 (quadrants 1 & 2) and section 3 (quadrants 3 & 4)
link the principal variables of sustainable tourism: number of visitors, environmental quality,
visitor satisfaction and economic impact of tourism. These variables are closely intertwined
and we can draw the full VQ-MS model (from the name of the axes of the four quadrants) in
Figure 6. The VQ-MS model.
This model tries to connect interdisciplinary researches on sustainable tourism in
protected areas. Firstly, the challenge is to define and measure a range of sustainable
indicators for all three aspects of sustainable tourism: ecological, social and economic.
Several sets of indicators have been proposed in an effort to facilitate the implementation of
sustainable tourism (e.g., [22,23,24]). In protected areas indicators should be defined for this
local scale of application. In our model they should be meaningful of:
- the visitor attendance (number of visitors, visits...);
Q M V V = g (Q, a, i, p, e) Q = f (V, a, b, i, x) U0 E Q0 V0 M0 M0 0 S S0 A B C F G Quadrant 3 Quadrant 4 Quadrant 2 Quadrant 1
- the environmental quality (index of biodiversity, water and landscape quality,...);
- the socio-cultural environment (integrity of the local culture, number of resident
complains...);
- the visitor satisfaction;
- the economic impact of tourism (average spending, multipliers...);
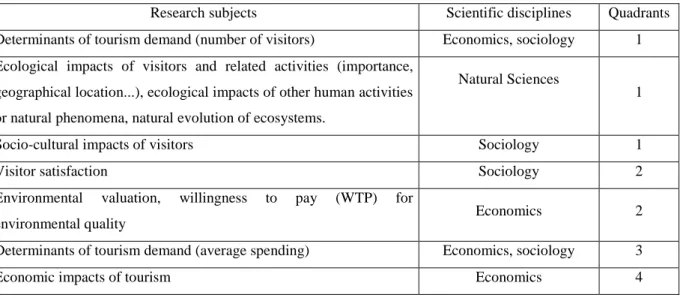
Secondly, the four quadrants of the model allow putting together some issues often
divided in the sustainable tourism literature. More specifically, we can summarize in the
following table some of the main research subjects on sustainable tourism:
Table 2. Examples of research subjects on sustainable tourism.
Research subjects Scientific disciplines Quadrants
Determinants of tourism demand (number of visitors) Economics, sociology 1 Ecological impacts of visitors and related activities (importance,
geographical location...), ecological impacts of other human activities or natural phenomena, natural evolution of ecosystems.
Natural Sciences
1
Socio-cultural impacts of visitors Sociology 1
Visitor satisfaction Sociology 2
Environmental valuation, willingness to pay (WTP) for
environmental quality Economics 2
Determinants of tourism demand (average spending) Economics, sociology 3
Economic impacts of tourism Economics 4
4.2. The VQ-MS model and visitor management
During the 1970s, the traditional concept of carrying capacity (maximum number of
visitors without unacceptable alteration in the environment and without a decline in the
visitors' satisfaction) was a general approach for recreation management. Because of the
limitations of this concept (due to the lack of a clear and predictable relationship between use
and impact) a variety of more sophisticated frameworks, which focus on determining the
desirable conditions for the visitor activity, have been developed in both the US and Canada:
- VIM: Visitor Impact Management;
- VERP: Visitor Experience and Resource Protection;
- VAMP: Management for Visitor Activities Management Process.
The origins and comparative analysis of these systems have been widely described in the
literature [25,26]. These frameworks, used in various parks and protected areas around the
world, follow the four basic planning steps [27]: "(1) determining the current situation (2)
deciding what situation is desired (3) establishing how to get from the current to the desired
situation using certain management actions (4) monitoring and evaluating progress or success
in attaining the desired situation".
We presume that the VQ-MS model could constitute an additional management system.
According to the previous methodology, this system will also follow four steps:
(1) Determining the current situation of the basic indicators (V, Q, U, M, S) of the model
(and use-impact relations if possible) for each site and period (quadrants 1 to 4);
(2) Deciding what environmental (or socio-cultural) situation is desired (e.g., rise of Q)
and discuss the management tools which can be used to accomplish this goal. It is worth
mentioning here that each of these tools will have an influence in quadrant 1, moving the
Table 3. Visitor management goals and tools (adapted from [3]).
Goals Tools (examples) Parameters
1. Reduce use of the entire protected area - Limit number of visitors in the entire area - Charge a visitor fee
i p 2. Reduce use of problem areas - Etablish skill/equipement requirements
- Make access harder/easier to areas
a i 3. Modify the location of use within problem
areas
- Locate facilities on durable sites - Prohibit off-trail travel
i a 4. Modify the timing of use - Encourage use outside of peak use periods
- Fees in period of high use
a p 5. Modify type of use and visitor behaviour - Teach a wilderness ethic
- Discourage/ban damaging practices/equipment
b a 6. Modify visitor expectations - Inform visitors about appropriate uses b 7. Increase the resistance of the resource - Shield the site from impact
- Strengthen the site
i x 8. Maintain/rehabilitate resource - Maintain/rehabilate impacted locations x
(a = activities; b = behaviour; i = facilities and infrastructure; p = prices; x = external factor)
(3) Simulating the effects of the various strategies on the value of the basic indicators
(ecological, social and economic) in order to determine the best choice. The simulation
process for each objective can be based on complex models (e.g., ecological models,
input-output models), on visitor and local surveys or on expert opinion. In this context,
multi-criteria analysis (MCA) is an appropriate form of decision-making because it allows
considering side by side monetary and non-monetary units. For example, we can present in
the following table our basic indicators of sustainable tourism and the evaluation of three
hypothetical management alternatives (A, B and C):
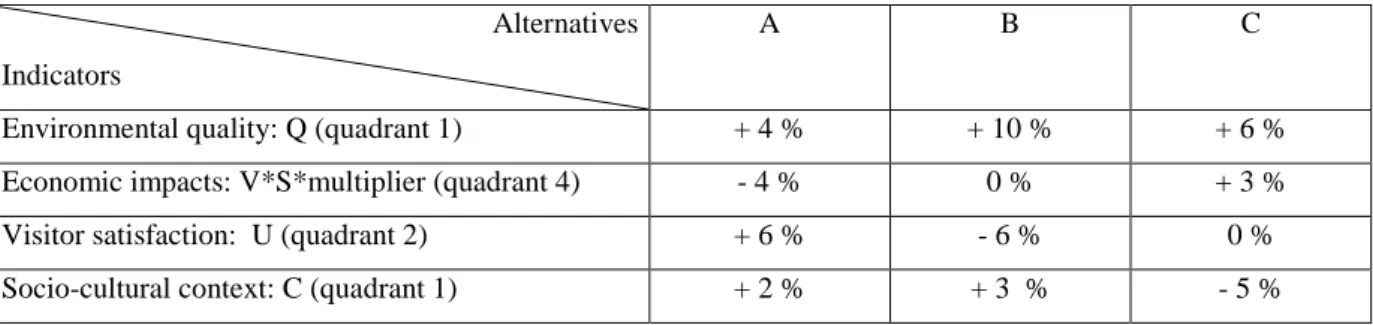
Table 4. Indicators-alternatives matrix. Alternatives
Indicators
A B C
Environmental quality: Q (quadrant 1) + 4 % + 10 % + 6 %
Economic impacts: V*S*multiplier (quadrant 4) - 4 % 0 % + 3 %
Visitor satisfaction: U (quadrant 2) + 6 % - 6 % 0 %
Using all indicators, this table shows that no alternative is better than the others. Each
option actually increases the environmental quality but reduce one of other indicators. In this
case, the indicators have to be weighted according to their perceived importance and the
expert judgment is one solution to provide the weights. The final ranking of the alternatives
can thus be obtained for making decisions using various methods. Because of the weighting
process and the frequent lack of scientific knowledge about the impacts, the MCA process is
necessarily subjective (the same subjectivity is present in all planning and management
frameworks). Furthermore, the necessary involvement of the stakeholders (all the groups who
have a direct interest in protected areas) and the need to consider the conditions of feasibility
(available staffing resources and funding) must also influence the decision process.
(4) Implementing actions and monitoring. The results of monitoring (i.e. measurement of
the key indicators) help managers to evaluate the effectiveness of their actions and to take
new decisions in the future.
5. Conclusion
From a theoretical point of view, the VQ-MS model tries to consider jointly ecological,
socio-cultural and economic aspects of sustainable tourism. This consideration of topics that
had often been treated separately is an initiative to promote interdisciplinary researches. In
that sense, we think that the question of sustainable tourism is too complex to be analysed
with a single criteria: an ecological manager may ignore the possible economic effects of his
decisions. On the other hand, an economic cost-benefit analysis in which gains and losses are
in the same units (prices) can seem inappropriate for valuing the various aspects of
environmental changes. Ultimately, the multi-criteria analysis is obviously the best decision
The model presented here has not yet been used to resolve concrete problems but we
think that it can be applied to many situations in protected areas. It is the reason why the
future developments of interdisciplinary researches and the implementation of the model in
experimental management systems will be necessary to develop this concept in an empirical
way.
References
[1] World Commission on Environment and Development (WCED), Our Common Future, Oxford: Oxford University Press, 1987.
[2] B. Garrod, Beyond the rhetoric of sustainable tourism, Tourism Management 19 (1998) 199-212. [3] P.F.J. Eagles, S.F. McCool and C.D.A. Haynes, Sustainable tourism in protected areas: guidelines for
planning and management. IUCN Gland, Switzerland and Cambridge, UK., 2002.
[4] G.H. Stankey, D.N. Cole, R.C. Lucas, M.E. Petersen and S.S. Frissell, The Limits of Acceptable Change (LAC) system for wilderness planning. USDA Forest Service. Intermountain Forest and Range Experiment Station. General Technical Report INT-176. Ogden, Utah, 1985.
[5] K.E. Hornback and P.F.J. Eagles, Guidelines for public use measurement and reporting at parks and protected areas. IUCN, Gland, Switzerland and Cambridge, UK., 1999.
[6] R. Costanza, Toward an operational definition of ecosystem health, in: Ecosystem Health: New Goals for Environment Management, eds. R. Costanza, B.G. Norton and B.D. Haskell, Island Press, Washington DC, 1992, pp. 239-256.
[7] W.E. Hammitt and D.N. Cole, Wildland recreation: ecology and management, John Wiley & Sons, New York, 1987.
[8] H. Ceballos-Lascurain, Tourism, ecotourism, and protected areas, International Union for Conservation of Nature and Natural Resources (IUCN), Cambridge, UK., 1996.
[9] E. Ostrom, R. Gardner and J. Walker, Rules, games, & common-pool resources, Ann Arbor: University of Michigan Press, 1994.
[10] G.W. Harding, The tragedy of the commons, Science 162 (1968) 1243-1248.
[11] H. Briassoulis, Sustainable tourism and the question of the commons, Annals of tourism research 29 (2002), 1065-1085.
[12] J.C. Briquet-Laugier, Le rôle de l'Etat dans un modèle d'application du tourisme durable, in: La restauration du rôle de l'Etat dans la croissance et le développement économiques, eds. C. Berthomieu, A. Chaabane and A. Ghorbel, Publisud, Paris, 2004, pp. 193-229.
[13] A. Mathieson and G. Wall, Tourism: economic, physical and social impacts, Longman, Harlow, 1982. [14] G. Wall and C. Wright, The environmental impact of outdoor recreation, Department of Geography
Publication Series No 11, University of Waterloo, Canada, 1997.
[15] D.J. Stynes, Guidelines for measuring visitor spending, Bulletin on Concepts and Methods, Department of Park, Recreation and Tourism Resources, Michigan State University, East Lansing MI, 1999.
[17] B.H. Archer, Tourism multipliers: the state of the art, Cardiff: University of Wales Press, 1977.
[18] H. Briassoulis, Methodological issues: tourism input-output analysis, Annals of Tourism Research 18 (1991) 485-495.
[19] J.E. Fletcher, Input-output analysis and tourism impact studies, Annals of Tourism Research 16 (1989) 514-529.
[20] D.J. Stynes, D.B. Propst, W.H. Chang, and Y. Sun, Estimating regional economic impacts of park visitor spending: Money Generation Model Version 2 (MGM2), East Lansing, MI: Department of Park, Recreation and Tourism Resources, Michigan State University, 2000.
[21] USDI, National Park Service, The Money Generation Model. Denver, CO: Office of Social Science, Socio-economic Studies Division, 1995.
[22] WTO, Indicators for the sustainable management of tourism, Report of the International Working Group, WTO, IISD and ISTC, 1993.
[23] WTO, What tourism managers need to know: a practical guide to the development and use of indicators of sustainable tourism, Spain, WTO, 1996.
[24] WTTC, WTO & Earth Council, Agenda 21 for the Travel & Tourism Industry, 1996.
[25] R. Graham, R. and R. Lawrence, Towards serving visitors and managing our resources, proceedings of a North American workshop on visitor management in parks and protected areas, Waterloo, ON: University of Waterloo, 1990.
[26] P. Nilsen and G. Tayler, A comparative analysis of protected areas planning and management framework, in: Proceedings - Limits of Acceptable Change and related planning processes: progress and future directions, comps. S.F. McCool and D.N. Cole, May 20-22, 1997, Missoula, MT., USDA Forest Service, INT-GTR-37, 1998, pp. 49-57.
[27] F. Giongo, J. Bosco-Nizeye and G.N. Wallace G.N., A study of visitor management in the world's national park and protected areas. Fort Collins, CO: Colorado State University, College of Natural Resources, 1993.