RESEARCH OUTPUTS / RÉSULTATS DE RECHERCHE
Author(s) - Auteur(s) :
Publication date - Date de publication :
Permanent link - Permalien :
Rights / License - Licence de droit d’auteur :
Bibliothèque Universitaire Moretus Plantin
Institutional Repository - Research Portal
Dépôt Institutionnel - Portail de la Recherche
researchportal.unamur.be
University of Namur
Highlight on Bottlenecks in Food Allergen Analysis
Planque, Mélanie; Arnould, Thierry; Renard, Patricia; Delahaut, Philippe; Dieu, Marc; Gillard,
Nathalie
Published in:
J AOAC Int.
DOI:
10.5740/jaoacint.17-0005
Publication date:
2017
Link to publication
Citation for pulished version (HARVARD):
Planque, M, Arnould, T, Renard, P, Delahaut, P, Dieu, M & Gillard, N 2017, 'Highlight on Bottlenecks in Food
Allergen Analysis: Detection and Quantification by Mass Spectrometry', J AOAC Int., vol. 100, no. 4, pp.
1126-1130. https://doi.org/10.5740/jaoacint.17-0005
General rights
Copyright and moral rights for the publications made accessible in the public portal are retained by the authors and/or other copyright owners and it is a condition of accessing publications that users recognise and abide by the legal requirements associated with these rights. • Users may download and print one copy of any publication from the public portal for the purpose of private study or research. • You may not further distribute the material or use it for any profit-making activity or commercial gain
• You may freely distribute the URL identifying the publication in the public portal ? Take down policy
If you believe that this document breaches copyright please contact us providing details, and we will remove access to the work immediately and investigate your claim.
Highlight on Bottlenecks in Food Allergen Analysis: Detection
and Quantification by Mass Spectrometry
M
élanieP
lanqueCER Groupe, Health Department, rue du Point du Jour, 8, 6900 Marloie, Belgium
University of Namur, Namur Research Institute for Life Sciences, Laboratory of Biochemistry and Cell Biology, 61, rue de Bruxelles, 5000 Namur, Belgium
T
hierrya
rnouldUniversity of Namur, Namur Research Institute for Life Sciences, Laboratory of Biochemistry and Cell Biology, 61, rue de Bruxelles, 5000 Namur, Belgium
PaTricia renard
University of Namur, Namur Research Institute for Life Sciences, Laboratory of Biochemistry and Cell Biology, 61, rue de Bruxelles, 5000 Namur, Belgium
P
hiliPPed
elahauTCER Groupe, Health Department, rue du Point du Jour, 8, 6900 Marloie, Belgium
M
arcd
ieuUniversity of Namur, Namur Research Institute for Life Sciences, Laboratory of Biochemistry and Cell Biology, 61, rue de Bruxelles, 5000 Namur, Belgium
naThlie Gillard
CER Groupe, Health department, rue du Point du Jour, 8, 6900 Marloie Belgium
EXTENDED ABSTRACTS
Based on a poster presented at the 130th AOAC Annual Meeting, September 18-21, 2016, in Dallas, TX
This project was financially supported by Waters Corp., the Walloon Region (FirstDoCA project: Allermass convention 1217881), and the Technological Platform Mass Spectrometry Service (MaSUN, UNamur, Belgium).
Corresponding author’s e-mail: melanie [email protected]
DOI: 10.5740/jaoacint.17-0005
Mélanie Planque was one of the five contest winners for first time AOAC poster
presenters at the 130th AOAC Annual Meeting.
Food laboratories have developed methods for testing allergens in foods. The efficiency of qualitative and quantitative methods is of prime importance in protecting allergic populations. Unfortunately, food laboratories encounter barriers to developing
efficient methods. Bottlenecks include the lack of regulatory thresholds, delays in the emergence of reference materials and guidelines, and the need to detect processed allergens. In this study, ultra-HPLC coupled to tandem MS was used to illustrate difficulties encountered in determining method performances. We measured the major influences of both processing and matrix effects on the detection of egg, milk, soy, and peanut allergens
in foodstuffs. The main goals of this work were to identify difficulties that food laboratories still encounter in detecting and quantifying allergens and to sensitize researchers to them.
F
ood allergies are increasingly prevalent, affecting over 220 million people worldwide (1). To avoid allergy, allergic consumers must exclude the prohibited food from their diet. Yet, despite many efforts and actions of the food industry, it is very hard to achieve complete elimination of cross-contact with allergens during food manufacturing, transport, and storage (2, 3). To limit the risk of allergy, the industry widely uses precautionary labeling (i.e., “may contain…”), but food recalls due to unlabeled allergens are constantly increasing (4). The lack of correlation between precautionary labeling and the presence of allergens frequently leads allergenic people to ignore the labeling (5). In addition, the absence of regulatory thresholds for allergens does not help food producers establish trustworthy labeling. To help food producers, thresholds have been set by the Allergen Bureau’s Voluntary Incidental Trace Allergen Labeling (VITAL) Program (6, 7), but despite manufacturers’ improvements and the emergence of allergen thresholds, itremains necessary to check for possible contaminations using reliable analytical methods.
The ELISA is the test most widely used in routine laboratories to detect allergens in food products. Yet, detecting highly processed allergens at VITAL thresholds by ELISA is very difficult because of protein modifications and interfering compounds (polyphenols, high fat content, etc.; 8, 9). This limitation has led to the development of methods based on ultra-HPLC (UHPLC) coupled to tandem MS (MS/MS) for the detection of allergens in products processed at high temperature (10–12). Although several methods are available for detecting
2
P
lanqueetal.:
Journalof aoaC InternatIonalVol.
100, no.
4, 2017 allergens, a lack of harmonization between laboratories remainscommon. Although AOAC INTERNATIONAL Standard
Method Performance Requirements (SMPR® 2016.002; 13) recommend using appropriate reference materials from the National Institute of Standards and Technology (NIST; Gaithersburg, MD) or from LGC Standards, some reference materials are still unavailable (cashew, pistachio, Brazil nut, and others), or food laboratories do not use them routinely. This lack of harmonization makes it difficult to compare method performances between laboratories. Food allergen detection methods are mostly characterized by sensitivity thresholds in spiked materials (14, 15), and it is hard to relate method sensitivity determined in this manner to method performances in food industry processes. Problems such as the absence of conversion factors between reporting units and the lack of correspondence between analytical methods such as PCR (DNA copies; 16) and ELISAs or MS (ingredients, soluble proteins, and total proteins; 10, 11) further complicate comparing the performances of methods used for food allergen detection. In the present study, we have sought to illustrate the consequences of this lack of harmonization between laboratories using UHPLC-MS/MS analysis. This technique was used to analyze highly processed and spiked materials. The impacts of processing and matrix effects were systematically evaluated and compared for the detection of egg, milk, soy, and peanut allergens in ice cream (fat), cookie (processed), and tomato sauce (acid) matrixes.
Materials and Methods Reagents and Materials
Standard Reference Materials (SRMs) of whole egg powder (SRM 8445; 48% proteins), whole milk powder (SRM 1549a; 25.64% proteins), soy flour (SRM 3234; 53.37% proteins), and peanut butter (SRM 2387; 22.2% proteins) were from NIST. Ultra-performance LC (UPLC) grade acetonitrile and formic acid were from Biosolve Ltd (Valkenswaard, the Netherlands). Acetic acid was purchased from Acros Organics (Geel, Belgium) and hydrochloric acid from Fisher Chemical (Loughborough, United Kingdom). The cleanup step was performed with a Sep-Pak tC18 SPE column (Cat. No. WAT036790; 6 cc, 500 mg), and UPLC separation was done with a Peptide C18 BEH 130Ȧ column (2.1 × 150 mm), both from Waters Corp. (Milford, MA). Urea, ammonium bicarbonate, tris(hydroxymethyl) aminomethane (TRIS), dimethyl sulfoxide (DMSO), dithiothreitol (DTT), iodoacetamide (IAA), bicinchoninic acid (BCA) protein assay kit, and trypsin from bovine pancreas (Cat. No. T8802) were obtained from Sigma-Aldrich (Bornem, Belgium). The labeled peptides GGLEPINF (Ring-D5) QTAADQAR-NH2 (egg peptide), FFVAPFPEVFGK (U-13C6 15N2)-OH (milk peptide), EAFGV (D8)NMQIVR-OH (soy peptide), and TANELNLLIL (U-13C6 15N)R-OH (peanut peptide), as internal standards, were from Eurogentec (Seraing, Belgium).
Preparation of Food Samples and Standards
Allergen-free matrixes.—Cookie dough was prepared with
flour (53.4%), sugar (15.2%), water (14.8%), oil (16.1%), salt
(0.3%), ammonium bisulfate (0.1%), and sodium bicarbonate (0.1%). Ice cream was mixed in a blender and consisted of coconut milk (29.6%), sugar (11.0%), lemon juice (0.4%), and banana (59.0%). Tomato sauce [tomatoes (75%), onions, carrots, and celery] was purchased from a local shop and homogenized with a blender.
Allergen solutions.—Two allergen solutions (Solutions A and
B) were prepared in extraction buffer (200 mM TRIS-HCl; pH 9.2, 2 M urea) and used to spike matrixes at different concentrations. Solution A was prepared by combining all four NIST reference materials (egg powder, milk powder, soy flour, and peanut butter) with the extraction buffer, applying the extraction protocol to this mixture, centrifuging it, and retaining the final supernatant. Ingredient and buffer proportions were chosen so that 1 mL Solution A corresponded, on the basis of NIST protein content, to 0.6 mg total egg proteins, 0.1 mg total milk proteins, 1.0 mg total soy proteins, and 0.5 mg total peanut proteins. Solution B was prepared by extracting each starting material separately, measuring the soluble protein content of each extract (BCA determination), and combining the different extracts so that 1 mL Solution B contained 0.1 mg soluble milk proteins, 0.6 mg soluble egg proteins, 1.0 mg soluble soy proteins, and 0.5 mg soluble peanut proteins. The allergen concentrations of these two solutions were, therefore, not identical, although both can be described as containing, e.g., “milk proteins at 0.1 mg/mL.” In what follows, we therefore specify “total proteins” or “soluble proteins” when referring to spiking levels obtained with Solution A or Solution B, respectively.
Contaminated matrixes.—Three kinds of contaminated
matrixes were prepared: incurred (incorporation of allergens before processing at 180°C during 18 or 36 min); spiked (incorporation of allergens after processing of tomato sauce, ice cream, and cookie matrixes); and digested (spiking the tomato sauce, ice cream, and cookie matrixes with digested allergens after the digestion step). Calibration curves (n = 3) were constructed for determining protein concentrations in milligrams of total proteins per kilogram (NIST protein content) or in milligrams of soluble proteins per kilogram (BCA quantification). The concentrations used were 0, 3, 6, 15, 30, 60, and 120 mg/kg for egg; 0, 0.5, 1, 2.5, 5, 10, and 20 mg/kg for milk; 0, 5, 10, 25, 50, 100, and 200 mg/kg for soy; and 0, 2.5, 5, 12.5, 25, 50, and 100 mg/kg for peanut.
Internal standards.—The stock solution was prepared by
dissolving the labeled peptides in DMSO (10 mg/mL) before diluting to 1 mg/mL with 0.1% formic acid. The working solution, containing FFVAPFPEVFGK (U-13C6 15N2)-OH and EAFGV (D8)NMQIVR-OH at 4 µg/mL, TANELNLLIL (U-13C6 15N)R-OH at 10 µg/mL, and GGLEPINF (Ring-D5) QTAADQAR-NH2 at 8 µg/mL in 0.1% formic acid, was prepared using the stock solution.
Peptide Analysis Protocol
Incurred and spiked matrixes.—For extraction, digestion,
purification, and analysis by UHPLC-MS/MS, the protocol described by Planque et al. (12) was used. Before extraction, 75 µL labeled-peptide working solution was added to each spiked and incurred matrix sample. The digestion step was slightly modified: 10 mL supernatant was diluted in 10 mL 0.20 mol/L
ammonium bicarbonate. The proteins were reduced for 45 min at 20°C by adding 1 mL 0.80 mol/L DTT, alkylated for 45 min at 20°C in the dark by adding 2 mL 0.50 mol/L IAA, and digested at 37°C for 1 h by addition of 1 mL 1 mg/mL trypsin in 50 mM acetic acid. The reaction was stopped with 300 µL 20% formic acid, and the mixture centrifuged at 4660 × g for 5 min at 10°C. After purification, the extract was dissolved in 500 µL 0.1% formic acid and centrifuged (11 754 × g for 5 min) before analysis by UHPLC-MS/MS.
Digested matrixes.—Tomato sauce, ice cream, and cookie
matrixes were spiked with Solution A (described in the Allergen
solutions section) and digested according to the above-described
protocol. After spiking the digested matrixes with digested allergens, 37.5 µL labeled-peptide working solution was added. After purification, the extract was dissolved in 500 µL 0.1% formic acid and analyzed by UHPLC-MS/MS.
Results and Discussion
Validation Guidelines: Impact on Method Performance
Despite the establishment of guidelines, validation criteria are still fuzzy. In particular, laboratories can still choose the manner in which they determine method sensitivity. We examined how different choices might affect the determined sensitivity of UHPLC-MS/MS.
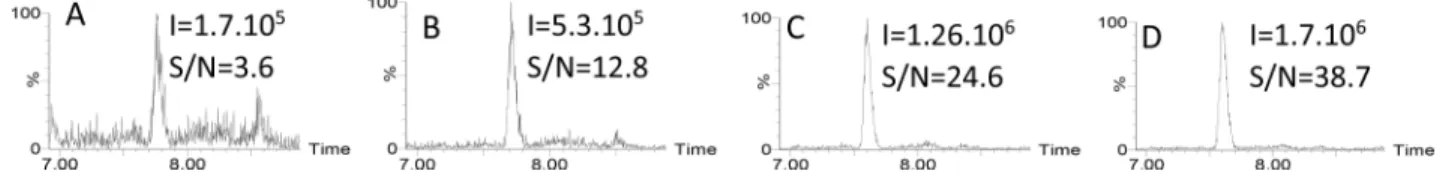
First, we focused on egg proteins in the incurred and the spiked cookie matrix. In UHPLC-MS/MS, the sensitivity (LOQ) is defined as the lowest concentration of analyte corresponding to an S/N higher than 10. In the incurred cookie matrix, having undergone heating at 180°C for 18 min, the LOQ was approximately 3 mg total egg proteins/kg (Figure 1B). When processing was longer (36 min at 180°C), the threshold S/N value was not reached at this concentration (Figure 1A). The use of spiked rather than incurred cookie matrix increased the S/N ratio nearly 7-fold (Figure 1C versus Figure 1A), and when the 3 mg/kg value referred to milligrams of soluble proteins rather than total proteins, the S/N ratio was even higher (Figure 1D).
These results highlight the difficulty in comparing method sensitivities when the reporting units are not the same and when different choices are made regarding processing conditions and the use of spiked or incurred samples. Such discrepancies are an obstacle to guaranteeing reliable detection of allergens in foods.
Next, we looked at the three matrixes (tomato sauce, ice cream, and cookie) spiked with 0.5 mg/kg total milk proteins. The sensitivity of the method was found to depend greatly on the matrix used: the SN was 3.2 times as high in ice cream and 8.8 times as high in tomato sauce as in cookie (Figure 2).
These results show that the matrix effect can be considerable and that foodstuff composition must be taken into account when assessing method performance. AOAC SMPR 2016.002 recommends combining matrixes and allergens when validating a method. It does not, however, indicate which ingredients, proportions, and conditions of preparation should be used. For harmonization, reference materials (e.g., MoniQA, LGC Standards) should be tested/used by different laboratories in order to use the same materials in determining the performances of analytical methods for food allergens.
Quantification Strategies for Allergens: Comparing Different Approaches
For better management of cross-contaminations in production lines, the food industry requires quantitative data, but industrial processes are known to cause protein modifications and degradations, making it hard to deliver accurate quantitative results (17). In the ELISA technique, the quantification of allergens is based mainly on a single calibration curve done in a solvent or extracted matrix, no matter what kind of food matrix is to be analyzed (18). This means that matrix effects and thermal processes are usually not taken into account and leads to significant gaps between real and quantified amounts of allergens.
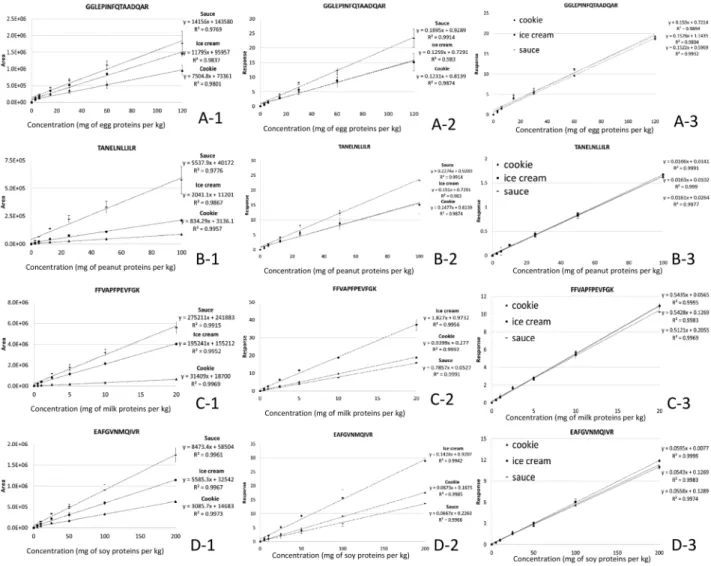
These considerations led us to examine the utility of using labeled peptides as internal standards in spiked and incurred materials to be analyzed by MS (Figure 3). First, such standards were introduced before extraction so as to test their ability to correct for matrix-related effects and steps of the protocol.
Figure 1. Chromatograms obtained for the most abundant multiple reaction monitoring (MRM) transition for egg peptide GGLEPINFQTAADQAR (844.4 > 666.3) in cookie matrix: (A-B) incurred samples containing 3 mg total egg proteins/kg cookie (NIST content) processed at 180°C for (A) 18 min or (B) 36 min; (C-D) spiked samples at a spiking level of 3 mg egg proteins/kg; however, this value refers to total proteins (NIST content) in panel C and to soluble proteins (BCA determination) in panel D.
Figure 2. Chromatograms obtained for the most abundant MRM transition for milk peptide FFVAPFPEVFGK (692.9 > 920.5) in spiked matrixes of (A) cookie, (B) ice cream, and (C) tomato sauce. The spiking level was 0.5 mg total milk proteins/kg food product (i.e., the LOQ determined in cookie matrix after processing at 180°C for 18 min; 12).
4
P
lanqueetal.:
Journalof aoaC InternatIonalVol.
100, no.
4, 2017As expected, the use of a labeled peptide did not allow correcting for the effect of heating. Nor did it allow the use of a single curve for ice cream, cookie, and tomato sauce matrixes. To see whether the use of labeled peptides as internal standards would allow correcting for
matrix-related effects occurring during purification/analysis, matrixes were extracted and digested before being spiked with digested allergens and labeled peptides. As shown in Figure 4, the calibration curves for cookie, tomato sauce, and ice cream matrixes were found to coincide. These results
Figure 4. Linear regression of the most abundant MRM transitions for (A) egg peptide GGLEPINFQTAADQAR (844.4 > 666.3), (B) peanut peptide TANELNLLILR (635.4 > 741.5), (C) milk peptide FFVAPFPEVFGK (692.9 > 920.5), and (D) soy peptide EAFGVNMQIVR (632.3 > 760.4), based on (A1–D1) peak areas, (A2–D2) responses with the labeled peptide correction (response = area of peptide ÷ area of labeled peptide internal standard), and (A3–D3) responses with the labeled peptide correction for digested matrixes spiked with digested peptides.
Figure 3. Linear regression of peptide peak areas and responses (most abundant MRM transition) for egg peptide GGLEPINFQTAADQAR (844.4 > 666.3) as a function of the concentration of egg proteins per kilogram of spiked: tomato sauce, ice cream, and cookie matrixes, as well as incurred cookie matrix processed at 180°C for 18 and 36 min (A) without internal standard and (B) with internal standard correction GGLEPINF (Ring-D5)QTAADQAR-NH2 (response = area of peptide ÷ area of internal standard).
are encouraging, but additional strategies are required for correcting extraction and digestion steps.
These results support the use of labeled peptides as internal standards, but correcting for effects occurring during extraction/digestion seems crucial to allowing the use of a single calibration curve to quantify an allergen in various foodstuffs. Pending a solution for achieving this, alternatives must be found. Currently, the method of standard addition seems the most appropriate for quantifying allergens by UHPLC-MS/MS.
Conclusions
The aim of the present study was to list and measure gaps in food allergen detection and quantification, using UHPLC-MS/MS. We have demonstrated the importance of determining method performance in different matrixes under conditions similar to those of industrial manufacturing in order to guarantee the detection of allergens in real food products. For global harmonization, reference materials should be tested and used by the different food allergen control laboratories. We have further found that for main egg, milk, soy, and peanut peptides, the use of labeled peptides does not correct for matrix effects linked to the extraction and digestion steps, but it does perfectly correct for matrix effects, purification, and UHPLC-MS/MS analysis. Therefore, right now, it seems that adding an allergen standard for each foodstuff is the best way to quantify allergens. With the aim to develop a quantitative method with a single calibration curve, concatenated labeled peptides will also be tested in the near future.
Acknowledgments
We would like to thank the AOAC INTERNATIONAL Technical Programming Committee for the poster presentation price and the opportunity to publish an extended abstract. We also thank Waters Corp., the Walloon Region (FirstDoCA project: Allermass convention 1217881), and the Technological Platform Mass Spectrometry Service (University of Namur, Belgium) for scientific discussions regarding this project.
References
(1) Manea, I., Ailenei, E., & Deleanu, D. (2016) Clujul Med. 89, 5–10. doi:10.15386/cjmed-513
(2) Hefle, S.L., & Taylor, S.L. (2004) Curr. Allergy Asthma Rep. 4, 55–59. doi:10.1007/s11882-004-0044-y
(3) Ward, R., Crevel, R., Bell, I., Khandke, N., Ramsay, C., & Paine, S. (2010) Trends Food Sci. Technol. 21, 619–625. doi:10.1016/j.tifs.2010.09.004
(4) Bucchini, L., Guzzon, A., Poms, R., & Senyuva, H. (2016) Food
Addit. Contam. Part A 33, 760–771. doi:10.1080/19440049.20
16.1169444
(5) Marchisotto, M.J., Harada, L., Blumenstock, J.A., Bilaver, L.A., Waserman, S., Sicherer, S., Boloh, Y., Regent, L., Said, M., Schnadt, S., Allen, K.J., Muraro, A., Taylor, S.L., & Gupta, R.S. (2016) Allergy 71, 1081–1085. doi:10.1111/all.12933
(6) Allen, K.J., Remington, B.C., Baumert, J.L., Crevel, R.W.R., Houben, G.F., Brooke-Taylor, S., Kruizinga, A.G., & Taylor, S.L. (2014) J. Allergy Clin. Immunol. 133, 156–164. doi:10.1016/j.jaci.2013.06.042
(7) Taylor, S.L., Baumert, J.L., Kruizinga, A.G., Remington, B.C., Crevel, R.W.R., Brooke-Taylor, S., Allen, K.J., & Houben, G. (2014) Food Chem. Toxicol. 63, 9–17. doi:10.1016/j. fct.2013.10.032
(8) Fu, T.-J., Maks, N., & Banaszewski, K. (2010) J. Agric. Food
Chem. 58, 4831–4838. doi:10.1021/jf903536z
(9) Downs, M.L., & Taylor, S.L. (2010) J. Agric. Food Chem. 58, 10085–10091. doi:10.1021/jf101718f
(10) Gomaa, A., & Boye, J. (2015) Food Chem. 175, 585–592. doi:10.1016/j.foodchem.2014.12.017
(11) Heick, J., Fischer, M., & Pöpping, B. (2011) J. Chromatogr. A
1218, 938–943. doi:10.1016/j.chroma.2010.12.067
(12) Planque, M., Arnould, T., Dieu, M., Delahaut, P., Renard, P., & Gillard, N. (2016) J. Chromatogr. A 1464, 115–123. doi:10.1016/ j.chroma.2016.08.033
(13) Paez, V., Barrett, W.B., Deng, X., Diaz-Amigo, C., Fiedler, K., Fuerer, C., Hostetler, G.L., Johnson, P., Joseph, G.,
Konings, E.J.M., Lacorn, M., Lawry, J., Liu, H., Marceau, E., Mastovska, K., Monteroso, L., Pan, S.-J., Parker, C., Phillips,M.M., Popping, B., Radcliffe, S., Rimmer, C.A., Roder,M., Schreiber, A., Sealey-Voyksner, J., Shippar, J., Siantar, D.P., Sullivan, D.M., Sundgaard, J., Szpylka,J., Turner, J., Wirthwine, B., Wubben, J.L., Yadlapalli, S., Yang, J., Yeung, J.M., Zweigenbaum, J., & Coates, S.G. (2016) J. AOAC
Int. 99, 1122–1124. doi:10.5740/jaoacint.SMPR2016.002
(14) Korte, R., Lepski, S., & Brockmeyer, J. (2016) Anal. Bioanal.
Chem. 408, 3059–3069. doi:10.1007/s00216-016-9384-4
(15) Monaci, L., Pilolli, R., De Angelis, E., Godula, M., & Visconti, A. (2014) J. Chromatogr. A 1358, 136–144. doi:10.1016/j.
chroma.2014.06.092
(16) Linacero, R., Ballesteros, I., Sanchiz, A., Prieto, N., Iniesto, E., Martinez, Y., Pedrosa, M.M., Muzquiz, M., Cabanillas, B., Rovira, M., Burbano, C., & Cuadrado, C. (2016) Food Chem.
202, 334–340. doi:10.1016/j.foodchem.2016.01.132
(17) Sathe, S.K., Teuber, S.S., & Roux, K.H. (2005) Biotechnol. Adv.
23, 423–429. doi:10.1016/j.biotechadv.2005.05.008
(18) Parker, C.H., Khuda, S.E., Pereira, M., Ross, M.M., Fu, T.-J., Fan, X., Wu, Y., Williams, K.M., DeVries, J., Pulvermacher, B., Bedford, B., Zhang, X., & Jackson, L.S. (2015) J. Agric. Food