Internal stability of a compacted core material of glacial
till subjected to horizontal seepage flow
Mémoire
Zhao Chen
Maîtrise en génie civil - avec mémoire
Maître ès sciences (M. Sc.)
Mémoire
Zhao Chen
Sous la direction de:
Résumé
La suffusion (instabilité interne) est une forme d'érosion interne qui est l'une des causes principales de ruptures des barrages en remblai. Les particules de la fraction fine sont érodées sélectivement par l’écoulement à travers les vides de la fraction grossière laissant seulement le squelette du sol. Cette thèse a l'intention d’étudier la susceptibilité à la suffusion des tills glaciaires. Deux essais d’infiltration horizontale ont été effectués sur les tills compactés sans cohesion, possédant une bonne granulométrie étendue, qui ont été soumis à des gradients hydrauliques à plusieurs étapes et à une pression de confinement verticale. Les tills sont utilisés comme matériaux du noyau dans le barrage de Romaine-3 au Québec.
Les résultats des essais montrent que les tills ont une grande capacité d'auto-filtration (capacité de bouchage). Le processus de suffusion à des gradients croissants peut se caractériser par six phases : 1. Les particules les plus petites (groupe-1) sont érodées continuellement; 2. Le bouchage; 3. Le début d'instabilité globale; 4. Les particules plus petites (groupe-2) sont érodées continuellement; 5. La stabilisation; 6. Les petites particules (groupe-3) sont érodées rapidement, ce qui pourrait provoquer une brèche.
Parfois le gradient hydraulique critique n'est pas une valeur exacte, mais un intervalle. Il faut aussi un gradient critique pour provoquer le bouchage. Généralement, le bouchage débute dans la zone milieu ou aval de l'échantillon, particulièrement la zone aval, ensuite il se développe vers l'amont, zone par zone, l’une après l’autre, au lieu de se produire partout simultanément. La zone amont est la plus érodable et une érosion importante se développe de l’amont à l'aval graduellement. Mais si la zone milieu a été bouchée sévèrement, la zone aval sera plus érodable. Durant la phase-5 (stabilisation), la zone amont et la zone aval pourraient encore continuer à perdre des particules fines pendant que les zones milieux deviennent stables avec perméabilité constante.
La contrainte effective verticale peut considérablement augmenter la stabilité interne du sol et 𝜎𝑣′=100kPa pourrait être une valeur critique pour provoquer un
bouchage inévitablement. La partie inférieure du noyau de barrage est plus résistante à la suffusion que la partie supérieure en raison de la contrainte effective qui est plus élevée.
La perméabilité diminue en baissant brusquement le gradient, ce qui signifie que le sol est toujours stable ayant assez de particules fines pour se guérir. Les critères géométriques pour évaluer la stabilité interne doivent être définis en dessous d’un gradient spécifique ou au-dessus d’une contrainte effective spécifique, au lieu d’être seulement basés sur la granulométrie, le degré de compactage ou la proportion de particules fines.
Une augmentation brusque du gradient hydraulique peut conduire à l'érosion continue des particules plus petites (phase-4) à un gradient plus faible que des augmentations graduelles, rendant le système plus instable. Le gradient critique pour déclencher le bouchage (phase-2) n'est presque pas affecté par le type d'augmentation de gradient (augmentation brusque ou graduelle).
Abstract
Suffusion (internal instability) is a form of internal erosion which is one of the main causes of dam failures. Finer particles are eroded selectively from the soil matrix by seepage forces, leaving behind a coarser soil skeleton. This thesis aims to investigate the susceptibility to suffusion of glacial till. Two horizontal seepage tests were performed on a compacted widely well-graded cohesionless till used as core materials in Quebec Romaine-3 dam, subjected to multi-stage hydraulic gradients and vertical confining pressure.
Test results show that glacial till has a great ability to self-filter (clog). Suffusion process under increasing multi-stage gradients involves six phases: 1.Continuous erosion of finest particles (group-1); 2.Clogging; 3.Onset of global instability; 4.Continuous erosion of finer particles (group-2); 5.Stabilization; 6.Rapid erosion of fine particles (group-3), which might develop into a breach.
Critical gradient sometimes is not an exact value but a range. Clogging also needs a critical gradient to be triggered, which usually starts in middle or downstream areas of the specimen, especially downstream area, and then develops to upstream, one zone after another, rather than occurring everywhere simultaneously. Upstream area is most erodible and significant erosion develops from upstream to downstream progressively. But if middle area had ever been clogged severely, downstream area would be more erodible. In phase-5, stabilization, the most upstream and most downstream areas might keep on losing fines with slow increase of permeability, while middle areas become stable with constant permeability.
Vertical effective stress can increase the soil’s internal stability greatly, and
𝜎𝑣′=100kPa might be a critical value for clogging to take place inevitably. Lower layer
of the dam core is more resistant to suffusion than upper layer due to the higher effective stress.
If permeability decreases when lowering the gradient sharply, this means the soil is still stable, having enough fines for self-healing. Geometric criteria for assessing
internal stability should be defined below a specific gradient or above a specific effective stress, instead of a single gradation, degree of compaction or fines content.
Sharp increase in hydraulic gradient can cause continuous erosion of finer particles (phase-4) to take place at a lower gradient than the gradual increase, making the system more unstable. The critical gradient to trigger clogging (phase-2) is almost not affected by the type of increase in gradient (sharp or gradual increase).
Table of contents
Table of Contents
Résumé ... iii
Abstract ... v
Table of contents ... vii
List of tables ... ix List of figures ... x Acknowledgment ... xiii Introduction ... 1 0.1 Motivation ... 1 0.2 Problem ... 3
0.3 Objectives and methodology ... 5
0.4 Thesis structure ... 5 1. Background ... 6 1.1 Embankment dam ... 6 1.2 Internal erosion ... 8 1.3 Glacial till ... 15 2. Literature review ... 19
2.1 Previous studies on internal instability ... 19
2.2 Geometric criteria ... 24
2.3 Hydraulic criteria ... 34
2.4 Stress criteria ... 44
3. Apparatus, test program and material ... 49
3.1 Test-1 ... 49
3.1.1 Permeameter device ... 49
3.1.2 Water supply and control system ... 49
3.1.3 Instrumentation ... 52
3.1.4 Data acquisition system ... 52
3.1.5 Test program ... 52
3.2 Test-2 ... 53
3.2.1 Permeameter device ... 53
3.2.2 Water supply and control system ... 55
3.2.3 Instrumentation ... 56
3.2.4 Data acquisition system ... 56
3.2.5 Test program ... 56
3.3 Test materials ... 57
3.3.1 Soils ... 57
4. Results and analysis ... 62
4.1 Test-1 ... 62
4.1.1 Hydraulic gradients and head losses in the permeameter ... 62
4.1.2 Volumetric flow rate ... 63
4.1.3 Water head distributions ... 63
4.1.4 Global permeability ... 64
4.1.5 Post-test gradation ... 66
4.1.6 Effective stress ... 67
4.1.7 Local permeability ... 68
4.2 Test-2 ... 71
4.2.1 Hydraulic gradients and head losses in the permeameter ... 71
4.2.2 Volumetric flow rate ... 72
4.2.3 Water head distributions ... 72
4.2.4 Global permeability ... 73 4.2.5 Post-test gradation ... 74 4.2.6 Erosion rate ... 76 4.2.7 Effective stress ... 78 4.2.8 Local permeability ... 78 5. Discussion ... 82
5.1 Critical hydraulic gradient ... 82
5.2 Suffusion process ... 84
5.2.1 Suffusion process in previous studies ... 84
5.2.2 Suffusion process in this study ... 86
5.2.3 Factors influencing the suffusion process ... 90
5.3 Clogging mechanism... 92
5.4 Behavior of spatial development of suffusion ... 94
5.4.1 Preferential locations of clogging and erosion in previous studies ... 94
5.4.2 Spatial development of clogging and erosion in this study ... 96
5.4.3 Behavior of spatial development of suffusion ... 97
5.5 Effect of confining pressure ... 99
5.6 Assessment of internal stability ... 100
5.7 Effect of the type of increase in gradient ... 102
Conclusion ... 104
Conclusions ... 104
Future work ... 105
List of tables
Table 0-1.Dam disasters caused by internal erosion (UK Environment 2011)………..……2
Table 1-1.Main mechanisms of internal erosion……….……...9
Table 1-2.Laboratory properties of the Quebec till (Malenfant-Corriveau 2016)……….………17
Table 2-1.Summary of previous investigations on internal instability……….…….20
Table 2-2.Geometric criteria for assessing soil’s internal stability……….….25
Table 2-3.Hydraulic conditions for the onset of internal instability……….…..…35
Table 2-4.Influence of stress on internal instability………45
Table 3-1.Test conditions of test-1 (horizontal seepage flow)………..53
Table 3-2.Test conditions of test-2 (horizontal seepage flow)………..…57
Table 3-3.Physical characteristics of the Romaine-3 till (0-5mm) used in this study……….…58
Table 4-1.Changes in mass, void ratio and permeability of test-1...67
Table 4-2.Changes in mass, void ratio and permeability of test-2...75
Table 5-1.Suffusion process of a well-graded till without a filter………..….….91
Table 5-2.Criteria for the onset and blow-away of clogging……….…….…….………92
Table 5-3.Almost all cases involving the clogging and erosion distributions (32 tests)……….95
List of figures
Fig.0-1 A view of the Romaine-3 dam, taken in 2017-09 (Hydro-Quebec)………1
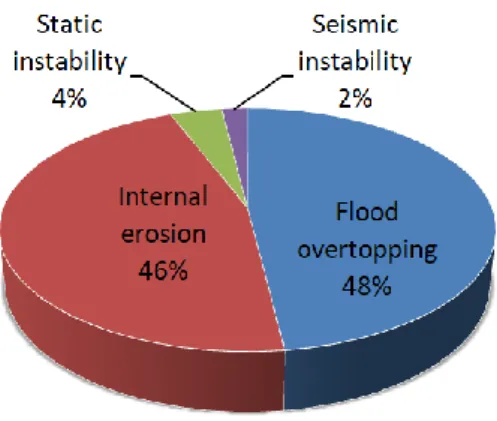
Fig.0-2 Statistics of embankment dam failures (ICOLD 2017)………2
Fig.0-3. 1976 Teton dam failure, Idaho, USA, due to internal erosion……….3
Fig.0-4. 2009 Situ Gintung dam failure, Cirendeu, Indonesia, due to internal erosion………….…..3
Fig.0-5 Potential mechanisms of internal erosion within embankment dam………....4
Fig.1-1 Categories of embankment dams (adapted after Narita 2000)………….……….6
Fig.1-2 Grain size distributions of fill materials in embankments (Narita 2000)………7
Fig.1-3 Distribution of dam types worldwide (ICOLD website)……….8
Fig.1-4 Concentrated leak erosion (adapted after US Reclamation 2015)……….…..8
Fig.1-5 Contact erosion………..10
Fig.1-6 Backward erosion (adapted after Koelewijn and Van Beek 2018)………..11
Fig.1-7 Global backward erosion, forming a sinkhole in sloping core (ICOLD 2017)………..….11
Fig.1-8 Progression of suffusion (adapted after Ziems 1969, Fell and Fry 2007)………..11
Fig.1-9 Progression of concentrated leak erosion through the embankment………....12
Fig.1-10 Progression of contact erosion (adapted after Beguin 2011)……….…….…..12
Fig.1-11 Progression of backward erosion (adapted after Van Beek et al. 2011)……….…12
Fig.1-12 Locations of backward erosion (Foster and Fell 1999)………....13
Fig.1-13 Soils susceptible to suffusion (Wan and Fell 2004)……….13
Fig.1-14 Suffosion and suffusion (adapted after Fannin and Slagnen 2014)………...13
Fig.1-15 Examples of breach due to internal erosion (FEMA 2015)………...14
Fig.1-16 Factors affecting the internal erosion (adapted after Garner and Fannin 2010)……..…14
Fig.1-17 Event Tree (adapted after US Reclamation 2015)……….….15
Fig.1-18 Surficial geology in Canada (Geological Survey of Canada 2014)………....15
Fig.1-19 Grain size distributions of Quebec till (ICOLD 1989)………..16
Fig.1-20 Sampling dam locations in Quebec (Malenfant-Corriveau 2016)………....17
Fig.1-21 Compaction curve under a standard Proctor test (adapted after Castonguay 2014)….18 Fig.1-22 Relation between water content and density of Quebec till (ICOLD 1989)……….……….17
Fig.1-23 Relation between permeability and fines content of Quebec till (Leroueil et al. 2002)………18
Fig.2-1 Istomina's stability criterion (Chang and Zhang 2013)………24
Fig.2-2 Lubochkov’s stability criterion (adapted after Kovacs 1981)………..24
Fig.2-3 Method of Kezdi 1979, De Mello 1975 and Sherard 1979 (Sherard 1979)…. ……….28
Fig.2-4 H: F shape curve for the method of Kenney and Lau 1985………..29
Fig.2-5 Boundary between stable and unstable soil gradations (adapted after Kenney and Lau 1986)………...29
Fig.2-6 Gradation types of broadly graded soils (Lafleur et al. 1989)………...30
Fig.2-7. Method for assessing internal stability (Burenkova 1993)………....30
Fig.2-8 Probability of internal instability (adapted after Wan and Fell 2004)………..31
Fig.2-9 Synthesis of Kezdi’s and Kenney and Lau’s methods (Li and Fannin 2008)………..31
Fig.2-10 Method for assessing internal stability (Wan and Fell 2008)………..32
Fig.2-11 Illustration of gap ratio (Chang and Zhang 2013)………...32
Fig.2-13 Method for assessing the suffusion susceptibility of till (silt-sand-gravel, Rönnqvist
2017).………..…33
Fig.2-14 Critical velocities for internal and external suffosion (Kovács and Ujfaludi 1983)……..34
Fig.2-15 Relation between critical gradient and (H/F)min (Adel et al. 1988, Li 2008)……….….41
Fig.2-16 Relation between critical gradient and (H/F)min (Skempton and Brogan 1994)…….41
Fig.2-17 Relation between α and (H/F)min (Li 2008)………...41
Fig.2-18 Relation between α and d85′ /O50 (Li 2008)………..41
Fig.2-19 Relation between seepage angle and critical velocity (Richards 2012)…..……….42
Fig.2-20 Relation between initial void ratio and critical velocity (Richards 2012)….………42
Fig.2-21 Relation between critical Darcy’s velocity and permeability (Konrad and Côté 2013).42 Fig.2-22 Relation between critical seepage velocity and permeability (Konrad and Côté 2013)..……….……43
Fig.2-23 Suffusion susceptibility classification (Marot et al. 2018) ……….43
Fig.2-24 Relation between critical gradient and effective stress (Moffat 2005, reworked by Li 2008)………...44
Fig.2-25 Relation between critical gradient and effective stress under upward flow (Li 2008)..46
Fig.2-26 Relation between critical gradient and confining pressure (Chang and Zhang 2011)...47
Fig.2-27 Relation between critical velocity and effective mean confining stress (Richards and Reddy 2012)………47
Fig.2-28 Relation between critical velocity and effective maximum principal stress (Richards and Reddy 2012)………..47
Fig.2-29 Relation between critical gradient and confining pressure (Luo et al. 2012)………..48
Fig.2-30 Relation between critical gradient and confining pressure (Jiang et al. 2013)…………...48
Fig.2-31 Force analysis on the particle (Jiang et al. 2013)………..48
Fig.2-32 Relation between critical gradient and confining pressure (Yang et al. 2014)………48
Fig.2-33 Relation between critical gradient and confining pressure (Zeng 2016)……….48
Fig.3-1 Permeameter and specimen of test-1 (unit: cm)………50
Fig.3-2 Apparatus of test-1 in the laboratory……….51
Fig.3-3 Permeameter cell of test-1……….…51
Fig.3-4 Actual hydraulic gradient and testing time (0-1682h) in test-1……….………..53
Fig.3-5 Permeameter and specimen of test-2 (unit: cm)………..……….…54
Fig.3-6 Apparatus of test-2 in the laboratory………..……….55
Fig.3-7 Data acquisition unit……….………...56
Fig.3-8 DASYlab32 interface…………..……….56
Fig.3-9 Actual hydraulic gradient and testing time (0-1719h) in test-2……….………57
Fig.3-10 Field construction of the Roamine-3 dam, taken in 2016-07 (Hydro-Quebec)…………..58
Fig.3-11 Standard Proctor compaction curve (0-5mm) of the Romaine-3 till……….59
Fig.3-12 Grain size distribution curve of the specimen (Romaine-3 till)……….59
Fig.3-13 Specimen within the permeameter cell of test-1………60
Fig.3-14 Specimen within the permeameter cell of test-2……….…….61
Fig.4-1 Externally imposed and actually measured hydraulic gradients in test-1………...62
Fig.4-2 Evolution of flow rate in test-1………63
Fig.4-3 Three types of water head distributions along the length of the specimen………...63
Fig.4-5 Evolution of global permeability in test-1…. ……….65
Fig.4-6 Grain size distribution after test-1………...66
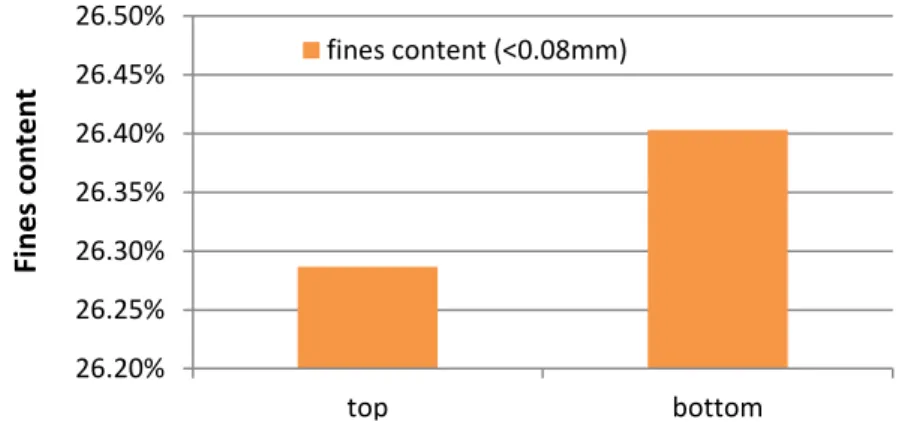
Fig.4-7 Fines content distribution along the length of the specimen after test-1..……….66
Fig.4-8 Fines content distribution along the depth of the specimen after test-1………....67
Fig.4-9 Vertical effective stress distributions in test-1……….68
Fig.4-10 Final k distribution along the length of specimen in test-1 (i=3, t=1682h)………….…68
Fig.4-11 Evolution of permeability distribution along the length of the specimen in test-1 (i=0.2-3, t=0-1682h) ………....70
Fig.4-12 Externally imposed and actually measured hydraulic gradients in test-2………..….…71
Fig.4-13 Evolution of flow rate in test-2………....72
Fig.4-14 Randomly selected water head distributions from test-2………....72
Fig.4-15 Evolution of global permeability in test-2……….73
Fig.4-16 Grain size distribution after test-2………....74
Fig.4-17 Fines content distribution along the length of the specimen after test-2……….75
Fig.4-18 Fines content distribution along the depth of the specimen after test-2………..75
Fig.4-19 Evolution of erosion rate in test-2………..76
Fig.4-20 Collected fines in the outlet at i=0.5 (finest particles)……….76
Fig.4-21 Collected fines at i=0.56-3.2 (finest particles, similar size to those collected at i=0.5)……….77
Fig.4-22 Collected fines at i=3.8 (finer particles, visibly coarser than those collected at i=0.5 and i=0.56-3.2)……….…77
Fig.4-23 Vertical effective stress distributions in test-2………..78
Fig.4-24 Final permeability distribution along the length of the specimen in test-2 (i=3.8, t=1719h)……….78
Fig.4-25 Evolution of permeability distribution along the length of the specimen in test-2 (top layer, i=0.5-3.8, t=0-1719h)………..…80
Fig.4-26 Evolution of permeability distribution along the length of the specimen in test-2 (bottom layer, i=0.5-3.8, t=0-1719h)………....81
Fig.5-1 Relation between hydraulic gradient and suffusion process……….82
Fig.5-2 Suffusion process (clogging—erosion—stabilization—rapid erosion) of Jiang et al. 2013………..84
Fig.5-3 Suffusion process (clogging—erosion—stabilization) of Rochim et al. 2017.……….85
Fig.5-4 Suffusion process (detachment—clogging—erosion—stabilization) of Silva 2019……….85
Fig.5-5 Suffusion process in test-1 (t=0-1682h, i=0.2~3, no filter).……….……87
Fig.5-6 Suffusion process in test-2 (t=0-1719h, i=0.5~3.8, no filter)………..87
Fig.5-7 Fines which can be washed out of the specimen in each phase of suffusion………....89
Fig.5-8 Internal and external suffusion………89
Fig.5-9 Particle groups involved in the suffusion process……….….93
Fig.5-10 Spatial development of clogging and erosion in this study………..………96
Fig.5-11 Spatial characteristics of suffusion within a specimen………...98
Fig.5-12 Spatial characteristics of suffusion at locations simulated in this study……….……….99
Acknowledgment
First, I would like to thank my supervisor Professor Jean-Marie Konrad for his patience and support. He gave me the time to overcome my difficulties and finish my thesis. His great character touches me deeply and inspires me.
Second, I wish to express sincere gratitude to the supervisor of the laboratory Mr. François Gilbert for helping me prepare the specimen and experiment, to Professor Jean Côté for giving me the chance to write a thesis as well as I can, and to Professor Denis Leboeuf for encouraging me with his own experience, helping me believe in myself.
Third, thanks are extended to the director of the residence service of Laval University Mr. Mathieu Gagnon for giving me a very quiet room to overcome my sleep problem, guaranteeing that I can finish this thesis with enough sleep and energy.
Finally, I gratefully thank my mother for her constant encouragement and support during the hard time.
Introduction
0.1 Motivation
Embankment dams are constructed to impound water, using an impervious core for various purposes including flood control, hydropower, water supply and irrigation. The Quebec Romaine-3 embankment dam and its reservoir are shown in Fig.0-1.
Fig.0-1 A view of the Romaine-3 dam, taken in 2017-09 (Hydro-Quebec)
In Canada, glacial till has been widely used as dam core materials from 1950’s, since it is economically available on-site or its borrow pit is nearby for the bulk of construction. In addition, till in Quebec is a non-plastic well-graded soil, which exhibits properties of low compressibility, high shear strength and relatively low permeability that are crucial to the function of dam core (Paré 1984, Watabe et al. 2000 and Leroueil et al. 2002).
Fig.0-2 Statistics of embankment dam failures (ICOLD 2017)
When impounding, seepage flow through the core might lead to internal erosion, i.e. soil particles within the dam or its foundation are carried downstream by seepage forces. Internal erosion is a major risk causing dam incidents and responsible for almost half of the embankment dam failures (ICOLD 2017, see Fig.0-2).
Furthermore, internal erosion is more dangerous because there may be no or only subtle reliable external evidence when it happens. Usually a sand boil can be found, but the boil might be hidden under water. A dam may breach within a few hours after the evidence becomes visible, so the failure could occur too rapidly to give time to protect lives and property downstream and might cause fatalities (see Table 0-1, Fig.0-3 and
Fig.0-4).
Table 0-1. Dam disasters caused by internal erosion (UK Environment 2011)
Dam Country Height (m) Reservoir (106m3) Built Failed Deaths
Whinhill UK 12 262 1828 1835 31
Bilberry UK 29 310 1845 1852 81
Dale Dyke UK 29 3,240 1863 1864 244
Baldwin Hills USA 71 1.1 1951 1963 5
Teton USA 93 308 1975 1976 11
Gouhou China 71 3 1989 1993 400
Situ Gintung Indonesia 16 2 1933 2009 100
Therefore, there is an urgent need to carry out investigation and scientific research to better understand internal erosion and its physical process. This has been recognized by dam owners, geotechnical engineers and researchers.
Fig.0-3. 1976 Teton dam failure, Idaho, USA, due to internal erosion. Loss: 11 people and 13000 cattle, $2 billion (U S Department of the Interior 1976).
Fig.0-4. 2009 Situ Gintung dam failure, Cirendeu, Indonesia, due to internal erosion. Loss: 100 people (flickr.com).
0.2 Problem
According to the different mechanisms of initiation, internal erosion can be classified into four forms (see Fig.0-5):
1. Concentrated leaks erosion usually occurs in plastic soils which are capable of sustaining an open crack, resulting in zones with zero effective stress.
2. Contact erosion often takes place around the interface between a coarse soil such as gravel and a fine soil, and water flow in the coarse soil which is parallel to the interface, erodes the fine soil.
3. Backward erosion could occur if no downstream filters are present or downstream materials could hold the roof for a pipe.
4. In the late 1970s, researchers came to understand another type of internal erosion, known as suffusion, occurring in gap or broadly graded soils. Finer particles are eroded selectively from the soil matrix by seepage forces, leaving behind a soil skeleton formed by the coarser particles, which does not require a crack, free surface or a roof holding (ICOLD 2017).
particles, is generally cohesionless even though some clayey fines might be present. Generally the Quebec glacial till is a widely well-graded (non-plastic or very low plastic) soil. In this study a well compacted cohesionless till sample with a 36.7% fines content held between two gravel transitions was subjected to multi-stage hydraulic gradients and vertical confining pressure, simulating the field conditions of a saturated till within the dam core.
Core
Filter
Contact erosion
Contact erosion
Backward piping Global backward erosion
Foundation Concentrated leaks (crack) Filter filtration by filter (clogging) suffusion suffusion Self-filtration of the
base soil (clogging)
Rock-fill shoulder Rock-fill shoulder
Migration
Fig.0-5 Potential mechanisms of internal erosion within embankment dam
Even if there is no filter, the likelihood to hold a crack or pipe roof within the till used in this laboratory work is only 0.02 (Fell et al. 2008 and Park 2005), thus, the probability of the first three erosion mechanisms is low for this study. Internal erosion of impervious till core occurred in many constructed dams where coarse filters were used, most of which were initiated by suffusion (Sherard 1979 and Kovacs 1981), since till is more vulnerable to suffusion (Lafleur 1989).
Susceptibility of glacial till to suffusion is still a relatively unexplored field, although this type of soil is widely used as dam core materials in the world. Therefore, this study will exclusively investigate the suffusion mechanism and process.
0.3 Objectives and methodology
Objectives:1. To investigate the susceptibility to suffusion of a typical glacial till with low fines content;
2. To determine the critical hydraulic gradient for internal instability; 3. To characterize the suffusion mechanism and process;
4. To characterize the spatial development of suffusion;
5. To evaluate the influence of confining pressure on internal stability; 6. To examine the effect of the type of increase in gradient.
Methodology:
A horizontal flow is imposed on a reconstituted compacted widely well-graded cohesionless glacial till in a permeameter, and its upstream water head increases step by step until internal instability (suffusion) occurs and is able to develop continuously. A vertical confining pressure between 25 and 150 kPa is applied.
0.4 Thesis structure
This thesis consists of Introduction, Chapter 1 to 5 and Conclusion as follows:
Introduction gives a brief introduction to internal erosion and suffusion, and
proposes objectives and methodology of this study.
Chapter 1 gives background knowledge of embankment dam, internal erosion and
Quebec till.
Chapter 2 provides an overview of previous studies and makes a comprehensive
literature review for internal instability.
Chapter 3 describes the apparatus, test procedures and materials. Chapter 4 presents test results of both test-1 and test-2.
Chapter 5 discusses the critical gradients, suffusion process, clogging
(self-filtration) mechanism, behavior of spatial development of suffusion, effect of confining pressure, assessment of internal stability and effect of the type of increase in gradient.
1. Background
1.1 Embankment dam
A dam is a barrier constructed to hold back water and raise its level, forming a reservoir used for irrigation, hydropower, water supply, flood control, recreation, navigation and fish farming. Dams with a height above 15 m, impounding more than 3 million m3 are called large dam. More than 70% of the registered large dams (14000 in total) are embankment dams (ICOLD website), which are built of earth or a combination of earth and rocks. Embankments are classified into two major types according to the construction materials: homogeneous earth-fill dam and rock-fill dam. The latter one further can be categorized into central core, inclined core and facing by dam configurations (Narita 2000, see Fig.1-1).
Dam type is determined not only by topography and geology of the site, but also by quality and quantity of available construction materials. Zoned dams are usually constructed in areas where several types of materials are available, such as clay, silt, sand, gravel and rock, taking advantage of the best properties of these different materials by placing them in different zones most beneficially, and the poor properties are mitigated. The material grain size increases from the core towards outer zones, as illustrated in Fig.1-2.
Fig.1-2 Grain size distributions of fill materials in embankments (Narita 2000) In earth-fill dams, the body with a drainage should have both structural and seepage resistance against failure. In rock-fill dams, the main body has a structural resistance against failure, consisting of rock-fill shell and transition zones. The zoning of dam is important in preventing erosion from continuing. Core and facing zones have a role to minimize leakage through the embankment. Filter zone on foundation and in other vulnerable locations should be provided in any type of rock-fill dams to prevent the loss of soil particles from the core and foundation due to seepage flow. In others, there may be no formal filter zones, but the zoning should include transition zones that may act as filters to the vulnerable zones (ICOLD 2017). The inclined core is sometimes adopted instead of the central core, in cases where the dam foundation has a steep inclination along the river, where different construction processes are required to
place core and rock-fill materials and where a blanket zone is provided in the pervious foundation to be connected with the impervious core (Narita 2000).
Thus, the embankment dam is popular (see Fig.1-3) due to: 1. using materials available within short haul;2. accommodating to various foundation conditions;3. least cost when compared to other dam types (USSD 2011).
Fig.1-3 Distribution of dam types worldwide (ICOLD website)
1.2 Internal erosion
Internal erosion involves seepage-induced soil particles detachment and transport within dam, levee, or its foundation. Its main mechanisms and developing processes are summarized in Table 1-1.
Fig.1-4 Concentrated leak erosion (adapted after US Reclamation 2015)
Table 1-1. Main mechanisms of internal erosion
Concentrated leak erosion: soil particles are detached through a pre-existing path (crack) in the
embankment or foundation (seeFig.1-4).
• Occurs when: 1. There exists a crack below the reservoir level;
2. Water seepage drag force is sufficient to detach soil particles from the lateral surfaces of the crack and to transport them downstream.
• Location: a crack, flaw or hole in the dam core or foundation. • Most susceptible material: cohesive soils.
• Potential progression (see Fig.1-9):
1. Crack →pipe forming →gross enlargement →roof collapse →settlement;
2. Or, roof collapse→ outflow exceeding rock-fill capacity →unraveling of downstream face.
Contact erosion: fines of finer layer are eroded from the contact with a coarser layer (see Fig.1-5). • Occurs when: 1. Pores of the coarser layer are large enough to allow fines to pass through;
2. Flow velocity is sufficient to remove the fine particles. • Location: all interfaces parallel to the flow, between two different materials. • Most susceptible material: both cohesive and non-cohesive soils.
• Potential progression (see Fig.1-10):
1. Cavity→ repeated roof collapse→ fallen materials being progressively eroded→ vertical sinkhole; 2. Cavity→ downstream cavity is held open→ backward piping→ gross enlargement→ overtopping; 3. Enough seepage→ slope steepening progressively to upstream→ downstream sloughing/sliding; 4.Permeable layer clogging→ pore pressure↑→hydraulic fracture→ dam toe uplift→ slope instability
Backward erosion: soil particles are detached when the seepage exits from an unfiltered surface,
leading to retrogressively growing pipes and sand boils (see Fig.1-6).
• Occurs when: 1. Reaching a critical gradient; 2. Seepage exits from an unfiltered surface; 3. Erodible materials exist within the flow path; 4. Continuously stable roof allows pipe to form. • Location (see Fig.1-12): a free seepage exit on the downstream side of foundation or embankment. • Most susceptible material: non-plastic soils.
• Potential progression (see Fig.1-11):
1. Channels reaching the reservoir→ piping→ gross enlargement→ roof collapse→ settlement; 2. Or, roof collapse→ outflow exceeding rock-fill capacity →unraveling of downstream face.
Global backward erosion: a near-vertical pipe develops in the core of embankment (see Fig.1-7). • Occurs when:
1.The core is not properly protected by filters or a transition zone;
2. The core is narrow or even reasonably wide sloping or partially sloping;
3. Gradient is relatively high, except when the core consists of cohesionless, internally unstable soils subject to suffusion or when large cavities exist in contact with the core.
• Location: within a narrow sloping dam core.
• Most susceptible material: non-plastic broadly graded silt sand gravel, such as glacial till. • Potential progressions:
1. Repeated collapse of pipe roof→ general downward movement of particles above due to gravity and seepage (backward erosion)→progressively collapse→ sub-vertical sinkhole through the core; 2. Repeated roof collapse occurring in the downstream slope→ slope getting over-steepened→
Suffusion: finer particles are eroded selectively from the soil matrix by seepage forces, leaving
behind a coarser soil skeleton, and there is very little or no volume change (see Fig 1-8). • Occurs when: three adverse conditions are satisfied (Garner and Fannin 2010, see Fig.1-16):
1. Geometric: the eroded fine particles should be smaller than the size of constrictions between coarser particles which form the basic skeleton.
2. Stress: effective stress is transferred by the coarser particles only, and some fine particles are not confined and free to move, i.e. “free fines”.
3. Hydraulic: flow velocity through the soil matrix must provide a high enough drag force to overcome the particle weight and the resistance of surrounding soils imposed on that particle. • Location: dam core, filter or foundation.
• Susceptible material (see Fig.1-13):internally unstable soils, namely, either broadly graded (i.e. with wide range of particle sizes – cobbles and gravels with sands, silts and clays) or gap graded (i.e. missing mid-sized particles) non-plastic soils, especially the soils with excessive fines content such as glacial till and colluvium.
• Potential progressions (see Fig 1-8):
1. Fines are eroded →permeability ↑→ accelerating the suffusion → substantial fines are carried away → collapse of the coarser soil skeleton →crest settlement→ overtopping.
2. Substantial detached soil particles are clogged at the toe→ permeability↓→ pore pressure ↑ →hydraulic fracture/ heave →slope instability of the downstream shoulder →sloughing/ unraveling.
Note (US Reclamation 2015): 1. Usually, no pipe is formed;
2. The probability of breach for suffusion is relatively low;
3. A filter constructed with internally unstable materials may be potentially eroded by suffusion, rendering the filter coarser and less effective in protecting core materials;
4. Suffosion (see Fig.1-14): very similar to suffusion, also occurs within internally unstable soils, but results in volume change, because the coarser particles are not in point-to-point contact. Suffosion is less likely to occur under the stress conditions or the gradients typically found in embankment dams. Examples of breach are shown in Fig.1-15.
An Event Tree is given in Fig.1-17 to better understand the internal erosion process.
Fig.1-5 Contact erosion, A- Section diagram of contact erosion (Fell and Fry 2007), B- Overtopping-induced contact erosion (adapted after Dionne 2015)
Regular level Overtopping level
Fig.1-6 Backward erosion (adapted after Koelewijn and Van Beek 2018)
Fig.1-7 Global backward erosion, forming a sinkhole in sloping core (ICOLD 2017)
Fig.1-9 Progression of concentrated leak erosion through the embankment
Fig.1-10 Progression of contact erosion (adapted after Beguin 2011)
Through the embankment Embankment to foundation Through the foundation
Fig.1-12 Locations of backward erosion (Foster and Fell 1999)
Fig.1-13 Soils susceptible to suffusion (Wan and Fell 2004)
1. Gross pipe enlargement, but reservoir drained out before the collapse of crest
2. Sloughing that was nearly breached, Fontenelle Dam, Wyoming
3. Sinkhole, in the crest of a dam, global backward erosion, Montana
4. Seepage-induced downstream slope instability, little Washita, Oklahoma Fig.1-15 Examples of breach due to internal erosion (FEMA 2015)
Reservoir loading at or above threshold level
Flaw exists – Continuous crack, poorly compacted or high permeability zone, etc. Initiation – Particle detachment
Continuation – Unfiltered or inadequately filtered exit exists Progression – Continuous stable roof or sidewalls
Progression – Constriction or upstream zone fails to limit flows Progression – No self-healing
Unsuccessful detection and intervention
Dam breaches (uncontrolled release of reservoir)
Fig.1-17 Event Tree (adapted after US Reclamation 2015)
1.3 Glacial till
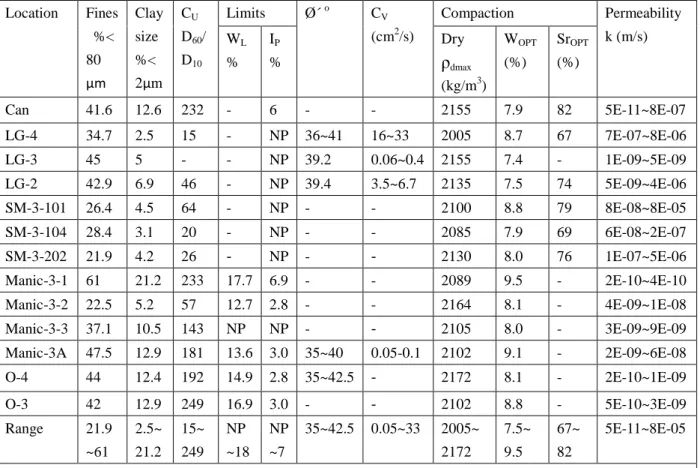
Till is abundant in Canada (see Fig.1-18), which has been used extensively, especially in northern countries, as fill materials for impervious core of embankment or for the main body of earth dam. The main advantages of till are low hydraulic conductivity, low compressibility and high shear strength, when compared to other natural fine materials. These desirable properties result from its broad grain size distribution (from fines to large boulders) together with its relatively high fines content. But, on the other hand, broadly graded cohesionless soils such as glacial till are sometimes vulnerable to suffusion (ICOLD 2017). Fig.1-19 gives a few gradation curves of Quebec till, whose properties and locations are shown in Table 1-2 and
Fig.1-20.
Fig.1-19 Grain size distributions of Quebec till (ICOLD 1989)
For compaction, the curve of dry density and water content of a standard Proctor compaction test and a diagram of compacted soil structures are illustrated in Fig.1-21. The suction in compacted soil at dry side is much higher than that at wet side, and it helps the particles more aggregated, resulting in more macro-pores (at dry side) and higher permeability (Delage et al. 1996 and Vanapalli et al. 1999). Fig.1-22 shows the density of till first increases with water content and then decreases, and Fig.1-23 shows the permeability of till decreases with fines content.
Table 1-2. Laboratory properties of the Quebec till (Malenfant-Corriveau 2016) Location Fines %< 80 μm Clay size %< 2μm CU D60/ D10 Limits Ø´ o CV (cm2/s) Compaction Permeability k (m/s) WL % IP % Dry ρdmax (kg/m3) WOPT (%) SrOPT (%) Can 41.6 12.6 232 - 6 - - 2155 7.9 82 5E-11~8E-07 LG-4 34.7 2.5 15 - NP 36~41 16~33 2005 8.7 67 7E-07~8E-06 LG-3 45 5 - - NP 39.2 0.06~0.4 2155 7.4 - 1E-09~5E-09 LG-2 42.9 6.9 46 - NP 39.4 3.5~6.7 2135 7.5 74 5E-09~4E-06 SM-3-101 26.4 4.5 64 - NP - - 2100 8.8 79 8E-08~8E-05 SM-3-104 28.4 3.1 20 - NP - - 2085 7.9 69 6E-08~2E-07 SM-3-202 21.9 4.2 26 - NP - - 2130 8.0 76 1E-07~5E-06 Manic-3-1 61 21.2 233 17.7 6.9 - - 2089 9.5 - 2E-10~4E-10 Manic-3-2 22.5 5.2 57 12.7 2.8 - - 2164 8.1 - 4E-09~1E-08 Manic-3-3 37.1 10.5 143 NP NP - - 2105 8.0 - 3E-09~9E-09 Manic-3A 47.5 12.9 181 13.6 3.0 35~40 0.05-0.1 2102 9.1 - 2E-09~6E-08 O-4 44 12.4 192 14.9 2.8 35~42.5 - 2172 8.1 - 2E-10~1E-09 O-3 42 12.9 249 16.9 3.0 - - 2102 8.8 - 5E-10~3E-09 Range 21.9 ~61 2.5~ 21.2 15~ 249 NP ~18 NP ~7 35~42.5 0.05~33 2005~ 2172 7.5~ 9.5 67~ 82 5E-11~8E-05
Note: for dam names, Caniapiscau= Can; La Grande= LG; Sainte-Marguerite= SM; Manicouagan= Manic; Outardes= O; NP= non-plastic; Ø´=Friction angle
Fig.1-20 Sampling dam locations in Quebec (Malenfant-Corriveau 2016)
Fig.1-22 Relation between water content and density of Quebec till (ICOLD 1989)
Fig.1-21 Compaction curve under a standard Proctor test (adapted after
Castonguay 2014)
Fig.1-23 Relation between permeability and fines content of Quebec till (Leroueil et al. 2002)
2. Literature review
2.1 Previous studies on internal instability
Internal instability is one of the main mechanisms of internal erosion, i.e. finer particles are eroded selectively from the soil matrix by seepage forces, leaving behind a coarser soil skeleton. “Suffusion” typically involves little or no change in volume of the soil since the larger particles are in grain to grain contact. But “Suffosion” is associated with particles movement causing a reduction in total volume because the coarser particles are not in grain to grain contact (Richards and Reddy 2007). Soils susceptible to suffusion or suffosion are described as internally unstable. Internally unstable soils are usually widely-graded with particles from clay to silt and gravel, whose size distribution curves are upward concave, or gap-graded. Most of the researchers prefer “internal instability” to “suffusion” or “suffosion” due to the confusion when using them.
Internal instability occurring in the foundation or embankment will result in a coarser soil structure, leading to an increased permeability and flow rate, progressive deterioration, likely settlement or toe instability. A filter constructed of internally unstable materials might lose finer particles, rendering the filter coarser and less effective (Wan and Fell 2008). In addition, internal instability may lead to self-filtration (clogging) of the base soil, where pores get clogged by the detached finer particles, which will close or reduce the erosion.
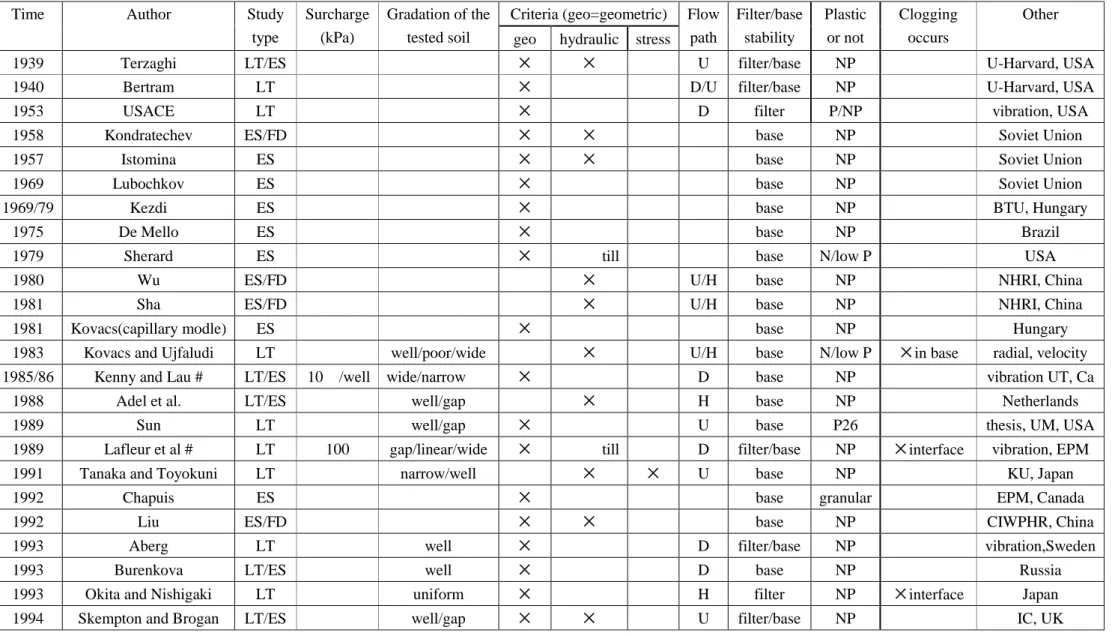
Internal instability of soils under upward, downward or horizontal seepage flow has been studied by a number of investigators. Garner and Fannin 2010 reported the main conditions for suffusion to occur with a diagram including three components: material susceptibility, critical hydraulic load and critical stress condition (see Fig.1-16). Likewise, Fry Jean-Jacques 2012 proposed three criteria for suffusion to occur: geometric criterion, hydraulic criterion and stress criterion. Almost all studies on internal instability are summarized in Table 2-1, including laboratory tests and empirical studies, to show what have done in this area and facilitate future researchers.
Table 2-1. Summary of previous investigations on internal instability
Time Author Study
type
Surcharge (kPa)
Gradation of the tested soil
Criteria (geo=geometric) Flow path Filter/base stability Plastic or not Clogging occurs Other geo hydraulic stress
1939 Terzaghi LT/ES × × U filter/base NP U-Harvard, USA
1940 Bertram LT × D/U filter/base NP U-Harvard, USA
1953 USACE LT × D filter P/NP vibration, USA
1958 Kondratechev ES/FD × × base NP Soviet Union
1957 Istomina ES × × base NP Soviet Union
1969 Lubochkov ES × base NP Soviet Union
1969/79 Kezdi ES × base NP BTU, Hungary
1975 De Mello ES × base NP Brazil
1979 Sherard ES × till base N/low P USA
1980 Wu ES/FD × U/H base NP NHRI, China
1981 Sha ES/FD × U/H base NP NHRI, China
1981 Kovacs(capillary modle) ES × base NP Hungary
1983 Kovacs and Ujfaludi LT well/poor/wide × U/H base N/low P ×in base radial, velocity
1985/86 Kenny and Lau # LT/ES 10 /well wide/narrow × D base NP vibration UT, Ca
1988 Adel et al. LT/ES well/gap × H base NP Netherlands
1989 Sun LT well/gap × U base P26 thesis, UM, USA
1989 Lafleur et al # LT 100 gap/linear/wide × till D filter/base NP ×interface vibration, EPM
1991 Tanaka and Toyokuni LT narrow/well × × U base NP KU, Japan
1992 Chapuis ES × base granular EPM, Canada
1992 Liu ES/FD × × base NP CIWPHR, China
1993 Aberg LT well × D filter/base NP vibration,Sweden
1993 Burenkova LT/ES well × D base NP Russia
1993 Okita and Nishigaki LT uniform × H filter NP ×interface Japan
Time Author Study type Surcharge (kPa) Gradation of the tested soil
Criteria (geo=geometric) Flow path Filter/base stability Plastic or not Clogging occurs Other geo hydraulic stress
1996 Honjo et al. LT 0.9 gap/broad × D base NP ×in base vibration, MIT
1997/00 Tomlinson and Vaid LT 50~400 narrow/uniform × × D filter/base NP ×in filter thesis, UBC, Ca
1998 Monnet ES/FD × filter/base NP France
2002 Tang et al. ES/FD well/gap × × U base NP U-Tongji, China
2002 Garner and Sobkowicz LT 600 gap × till U base NP ×in base Canada
2003 Khan # LT 25, 50 gap × × × D base NP thesis, UBC, Ca
2004a Wan and Fell LT/ES well/gap/wide × × U/D base N/low P UNSW,Australia
2004. Liu and Miao ES/FD well/gap × base NP ×in base ZU, China
2005 Mao ES/FD × × base NP NHRI, China
2005 Moffat # LT 25~175 well/gap × × D/U base NP ×in base thesis, UBC, Ca
2006 Liu LT well/gap × × U base NP thesis, SU,China,
2007 Lafleur and Nguyen LT wide × till D filter/base NP EPM, Canada
2007 Perzlmaier (velocity) ES × base NP TIWAG, Austria
2008 Wan and Fell # ( hole) LT/ES well/gap/wide × × U/D base N/low P thesis,UNSW,Au
2008 Bendahmane et al. LT 100~250 × × × D base P22 ×in base U-Nantes, Fr
2008 Kokusho and Fujikura LT well/poor × × U base N/low P velocity, Japan
2008 Zhou et al. # LT well/gap × × U base NP U-Tongji, China
2008 Li # LT/ES 0~200 well/gap/wide × × × D/U base NP ×in base thesis, UBC, Ca
2008 Li and Fannin (Kezdi’s) ES × base NP Kenney-Lau’s
2009 Mao et al. ES/FD × base NP NHRI China
2009 Yao et al. # LT gap × U base NP ×in base U-Tongji, China
2009 Goltz et al. (velocity) ES/FD × D/U filter/base NP UI, Austria
2010 Semar et al. ES × filter/base NP BUW, Germany
2011 Sail et al. LT gap × D base NP ×in base U-Nantes, Fr
Time Author Study type Surcharge (kPa) Gradation of the tested soil
Criteria (geo=geometric) Flow path Filter/base stability Plastic or not Clogging occurs Other geo hydraulic stress
2011a/b Chang and Zhang # LT/ES 50~100 gap × × × D base NP HKUST China
2012 Richards and Reddy LT 42, 60.5 wide/gap × × × H base P/NP velocity, USA
2012 Ke and Takahashi # LT gap × × U base NP TIT, Japan
2012 Liu and Xie LT/ES wide/well/gap × base Low P CIWPHR, China
2012 Marot et al. LT 100 gap × D base P22 ×in base angularity, Fr
2012 Chen et al. # LT gap × × U base NP ×in base U-Hohai, China
2012 Luo et al. (cut-off wall) LT 0~800 gap, × × U/D base NP ×in base U-Hohai, China
2013 Luo et al. # LT 200,400 gap × × D base NP ×in base U-Hohai, China
2013 Jiang et al. # LT/FD 100~900 gap × × U base NP ×in base CUST, China
2013 Chang and Zhang ES × base N/low P HKUST, China
2013 Konrad and Côté ES critical velocity × base N/low P U-Laval Canada
2013 Li and Fannin(capillary) ES × base NP UBC, Canada
2014 Fleshman et al. LT well × × U base NP USU, USA
2014b Ke and Takahashi # LT 50~200 gap × × D base NP ×in base TIT, Japan
2014 Benamar and Bennabi LT wide/well/gap × ×till U base N/low P ×in base UH, France
2014 Yang et al. LT 0~600 gap × × D base NP ×in base U-Hohai, China
2014 Moraci et al.(Simulfiltr) ES × base NP Butterfly, Italy
2015 Liang et al. LT gap × × U Base NP CJU, China
2015 Andrianatrehina et al. # LT/ES well/gap/wide × D/U base NP ENISE, France
2015/17 Rönnqvist # LT/ES well/gap/wide × till D base NP thesis, LUT, Swe
2015 Gustafsson # LT wide/well/gap × till D base NP ×base/filter thesis, LUT, Swe
2015 Luc et al. LT 25 gap × D base NP U-Nantes, Fr
2016 Marot et al. # LT gap/wide × D base NP/P14 ×in base U-Nantes, Fr
2016 Azirou et al (hole test) LT well graded silt × × H/D filter P20 ×in filter angularity,UH,Fr
2016 Ahmed and Ahmed LT/NS × H base NP ×in base clog, UH, Fr
Time Author Study type Surcharge (kPa) Gradation of the tested soil
Criteria (geo=geometric) Flow path Filter/base stability Plastic or not Clogging occurs Other geo hydraulic stress
2016 Zeng LT 10~40 gap × × × U base NP thesis,CJU,China
2017a/b Liang et al. LT 10~40 gap × × U base NP CJU, China
2017 Correia dos Santos et al. LT coarse/gap × × U base N/P14 LNEC, Portugal
2017 Tuffa # LT well/wide × till D base NP ×base/filter thesis, LUT, Swe
2017 Marot et al. # LT well × D base NP ×in base U-Nantes, Fr
2017 Rochim et al. # LT gap/wide × D base NP ×in base U-Nantes, Fr
2018 Zhong et al. # LT 2.5, 8.4 well/gap/wide × D base P/NP ×in base U-Nantes, Fr
2018 Douglas et al. LT well/gap/wide till D base N/low P ×in base UNSW, Au
2019 Marot et al LT well/gap/wide × H/D base N/low P ×in base U-Nantes, Fr
2019 Silva # LT well/wide × ×till D filter/base NP ×base/filter thesis, LUT, Swe
2020 Chen (this study) LT 10~50 well/wide ×till × H base NP ×in base thesis, Ulaval, Ca
Note Interface= interface between base soil and filter NP= Non-plastic FD= Formula derivation NS= Numerical simulation LT= Laboratory test # = A difference exists in mass loss along the specimen low P= low plastic ES= Empirical study MM= Mathematical model
2.2 Geometric criteria
Geometric condition for internal instability to occur is that the size of finer particles must be smaller than the size of the constrictions between coarser particles which form the basic soil skeleton. Thus, geometric criteria (material susceptibility) concerns porosity, void ratio, uniformity, relative density, degree of compaction, particle size distribution, fines content, angularity and plasticity.
A number of laboratory tests and empirical studies to examine the boundary between stable and unstable gradations have been done by other researchers. The most widely used methods to assess the internal stability are summarized in Table 2-2. The attractiveness of these geometric criteria in engineering practice is that they can be easily used without much time and effort (Konrad and Côté 2013).
Fig.2-1 Istomina's stability criterion (Chang and Zhang 2013)
Table 2-2. Geometric criteria for assessing soil’s internal stability
Reference Geometric criteria 1957-Istomina
(Soviet Union), sandy gravel, (ES) in Russian
Effect of uniformity (see Fig.2-1) If 𝐶𝑢≤ 10,the soil is internally stable; uniformity coefficient: 𝐶𝑢 = 𝑑60/𝑑10 If 𝐶𝑢≥ 20,the soil is internally unstable;
If 10 ≤ 𝐶𝑢≤ 20,transitional condition. 1969-Lubochkov (Soviet Union), cohesionless, (ES) in Russian
Effect of uniformity (see Fig.2-2) Lubochkov 1969 (see Kovacs 1981) proposed boundaries between stable and suffusive soils, with the factor of uniformity 𝐶𝑢,
where 𝑑𝑖
𝑑𝑚𝑎𝑥 = 𝑓(𝑝𝑖, 𝐶𝑢) , respectively 𝑑𝑖
𝑑𝑚𝑖𝑛= 𝑓(𝑝𝑖, 𝐶𝑢) 𝑝𝑖−percetage by weight passing the diameter 𝑑𝑖
𝑑𝑚𝑎𝑥, 𝑑𝑚𝑖𝑛− respectively maximum and minimum grain size diameter 1969/1979-Kezdi (Hungary) 1975-De Mello (Brazil) 1979-Sherard (USA), broadly graded till,(ES), cohesionless
Effect of grain size distribution (see Fig.2-3) Self-filtering method: a soil grain size distribution can be divided into a coarser part and a finer part in which the coarser part acts as a filter to the finer component. For each combination of coarse and fine split, stability criterion of Terzaghi 1939 is checked with I𝑟=D15C/D85F < 4 or 5, where I𝑟 < 5 from Sherard 1979 or I𝑟 < 4 from Kezdi 1969 is deemed potentially stable. D15C=diameter of the 15% mass passing in the coarser fraction; D85F=diameter of the 85% mass passing in the finer fraction. 1985/1986-
Kenney and Lau (Canada), cohesionless granular soils, (LT, ES)
Effect of grain size distribution
At any point of the particle size distribution curve, F is denoted corresponding to the percentage of "mass fraction smaller than a particle diameter D”, the mass fraction H is measured between the particle sizes D and 4D, and is plotted against F, as shown in part a of Fig.2-4.
This procedure is repeated for different points on the grading curve until sufficient points are obtained to establish an H: F “shape curve”. The point representing the coarse end of the grading curve falls on the line F+H = 1, as shown in part b of Fig.2-4. The “shape curve” is independent of grain size and only depends on the geometric form of grading curve.
If the minimum H/F value of the soil in that “shape curve” is smaller than 1, the soil is deemed potentially unstable (see Fig.2-5), namely:
(H/F)min< 1, internally unstable; (H/F)min≥ 1, internally stable.
Applied range of this “shape curve (H/F)min” rule: F=0~0.2 for widely graded soils (Cu>3);
F=0~0.3 for narrowly graded soils (Cu<3). 1989-
Lafleur et al. (Canada), broadly graded cohesionless till,
Classification of gradation curves (see Fig.2-6) Gradation curves of broadly graded soils are grouped into 3 types based on the internal stability:
• Linearly graded soils (curve 1 and curve 2): internally stable.
(LT) with fine particles uniformly distributed. In this latter soil, very few coarse particles (≈20% in mass) are distributed within a matrix of fine particles such that they do not intervene in the filtration process; the coarse portion of the gradation curve can be neglected.
• Gap-graded soils (curve 3): need further analysis and evaluation.
Some particles within a range of sizes are missing, i.e. the plateau in curve 3. • Internally unstable soils (curve 4)
Finer particles are susceptible to migrate within the coarse particles skeleton. 1992-Liu (China), cohesionless, (ES, LT) in Chinese Effect of compaction D0> 𝑑5,internally unstable; D0< 𝑑3,internally stable; D0= 𝑑3~𝑑5,transitional condition.
D0: average pore diameter;D0= 0.63. 𝑛. 𝑑20, n—porosity 1993-Burenkova
(Russia), cohesionless, (LT, ES)
Effect of uniformity (see Fig.2-7) Soil’s stability can be evaluated by the ratio 𝑑90/𝑑60.
Internally stable condition: 0.76 log (𝑑90
𝑑15) + 1 < 𝑑90 𝑑60< 1.86 log ( 𝑑90 𝑑15) + 1 2004-Wan and Fell (Australia), both cohesive and cohesionless, well graded soils, (LT, ES)
Effect of fines content; Effect of plasticity; Effect of compaction; Effect of uniformity
• There is no obvious relationship between the fines content and internal stability of silt-sand-gravel and clay-silt-sand-gravel mixtures. However, sand-gravel soils with less than 10% non-plastic fines are more likely to be internally unstable than silt-sand-gravel soils.
• There is no significant influence of fines plasticity on the internal stability of clay-silt-sand-gravel mixtures up to the limits: clay-sized fraction < 10%, and plasticity index < 12%.
• Burenkova’s method is modified for broadly and gap-graded silt-sand-gravel and clay-silt-sand-gravel mixtures with limited plasticity and clay content: 𝐼p ≤ 12 and clay-size fraction <10% (i.e. percentage passing 0.002mm). • Probability equation of instability is presented: 𝑃I = 𝑒𝑧/(1 + 𝑒𝑧), e=void ratio
For silt-sand-gravel soils and clay-silt-sand-gravel soils with limited clay and plasticity: Z = 2.378. log (d90 d15 ) − 3.648d90 d60 + 3.701 For sand-gravel soils with less than 10% non-plastic fines:
Z = 3.875. log (d90
d15) − 3.591 d90
d60+ 2.436
• Contours for equal probability of internal instability are shown in Fig.2-8. Points falling out of the contours are classified as stable.
2005-Mao (China), cohesionless, (ES)
in Chinese
Effect of uniformity; Effect of compaction; Effect of gradation
Internally unstable: Pf < 0.25/(1 − n); Internally stable: Pf ≥ 0.25/(1 − n) The soil is divided into two parts: a finer fraction and a coarser fraction.Pf= finer fraction by mass (%), as the division point on gradation curve; n=porosity; For gap-graded soils, 𝑃𝑓=mass passing the gap location (%);
For well-graded soil, 𝑃𝑓=mass passing the division diameter 𝑑𝑓 = 1.3√𝑑85𝑑15 2008-Li and Fannin (Canada) , cohesionless granular soils, (LT, ES)
Effect of grain size distribution (see Fig.2-9) • Two commonly used methods (i.e. Kézdi 1979 and Kenney and Lau 1985) are
combined for assessing the susceptibility to internal instability. • For gap-graded soils, Kezdi’s method is more successful.
For widely graded soils, Kenney and Lau’s method is more successful. • Kenney and Lau’s method is more conservative at F > 15%; but Kezdi’s
method is more conservative at F < 15%, F is from (H/F)min 2008-Wan and
Fell (Australia), cohesionless, (LT,ES)
Effect of grain size distribution; Effect of uniformity (see Fig.2-10) For widely graded silt-sand-gravel soils, based on a function of 𝑑90/𝑑60 and 𝑑20/𝑑5, boundaries for internal instability are proposed.
Note: this method is not applicable for gap-graded soils. 2010-Semar et al.
(Germany), cohesionless, (ES)
Effect of grain size distribution; Effect of uniformity
Characteristics of stable soils are summarized: • Soils with a factor of uniformity Cu= d60/d10≈ 1.
• Soils with a rather linear grain size distribution in semi-logarithmic scale with Cu< 10, irrespective of density index ID.
• Non-uniform soils with Cu > 10 and ID > 0.6.
• Steady curved grain size distribution with Cu < 8, irrespective of ID
• Non-uniform soils with ID= 0.3 to 0.6, Lubochkov 1969 method is applicable. Note: 1. All aspects of transport and clogging phenomena are mixed up.
2. Soils with slight cohesion cannot be analyzed with the common criteria, because the size of eroded aggregates is unknown. But the resistance against erosion increases dramatically with cohesion.
2011-Chang and Zhang (China), cohesionless, (LT, ES) in Chinese 2013-Chang and Zhang in English
Gradation Fines content Criteria
Well graded 𝑃𝑓< 10% d90/d60 d20/d10> 1.05,internally stable d90/d60 d20/d10< 0.52,internally unstable 0.52 <d90/d60 d20/d10< 1.05,transitional condition 10% <𝑃𝑓< 20% (H/F)𝑚𝑖𝑛 > -0.04𝑃𝑓+0.8,internally stable 𝑃𝑓> 20% internally stable Gap graded 𝑃𝑓< 10% 𝐺𝑟<3.0,internally stable 10% <𝑃𝑓< 35% 𝐺𝑟<3𝑃𝑓,internally stable 𝑃𝑓> 35% internally stable
2012- Liu and Xie (China), cohesionless, (ES, LT) in Chinese
Effect of fines content
P ≤ 0.9P𝑜𝑝,internally unstable (or if P < 25% in engineering practice); P > 1.1P𝑜𝑝,internally stable (or if P > 35%);
P = 0.9P𝑜𝑝~1.1P𝑜𝑝,transitional condition (or if 25% < P < 35%).
The soil is divided into two components: a finer fraction and a coarser fraction. The soil is deemed potentially stable if the finer particles fully occupy void spaces formed by the coarser particles. P=finer fraction by mass (%), given as the division point on gradation curve.
P𝑜𝑝—optimal fines content, P𝑜𝑝=
0.28+3𝑛2−𝑛
1−𝑛 × 100%, n—porosity. For gap-graded soils, P=mass passing the gap location (%);
For well-graded soils, P=mass passing the division diameter 𝑑𝑓 = √𝑑70𝑑10 2015/2017-
Rönnqvist (Sweden), cohesionless till, (LT, ES)
Effect of grain size distribution
• An empirical method to assess the internal instability of glacial till used as dam core materials is proposed based on fines content and sands content (see Fig.2-12).
• A transitional zone 0.68 ≤ H/F < 1.0 based on the method of Li and Fannin 2008 is defined by testing the glacial till (silt-sand-gravel, see Fig.2-13). LT= Laboratory Tests ES= Empirical Study FD= Formula Derivation NP= Non-Plastic
Fig.2-4 H: F shape curve for the method of Kenney and Lau 1985
Fig.2-5 Boundary between stable and unstable soil gradations (adapted after Kenney and Lau 1986)
Fig.2-6 Gradation types of broadly graded soils (Lafleur et al. 1989)
Fig.2-8 Probability of internal instability (adapted after Wan and Fell 2004)
Fig.2-10 Method for assessing internal stability (Wan and Fell 2008)
Fig.2-12 Method for assessing the suffusion susceptibility (Rönnqvist 2017)
Fig.2-13 Method for assessing the suffusion susceptibility of till (silt-sand-gravel,
2.3 Hydraulic criteria
Hydraulic condition for internal instability to occur is related to hydraulic force, rendering the migration of finer particles. Velocity of flow through the soil matrix must impose a high enough force to overcome the weight of finer particles and to move them through the constrictions between larger particles (Wan and Fell 2007). Kovacs 1981
indicated that failing to satisfy a geometric criterion “does not imply high susceptibility to suffusion, because the forces at the points of contact of the fine grains hinder their movement and, therefore, a relatively high gradient is necessary to initiate movement”, thus embankments constructed of potentially unstable materials may be acceptable where hydraulic gradients are not considered problematic in practice (Li 2008).
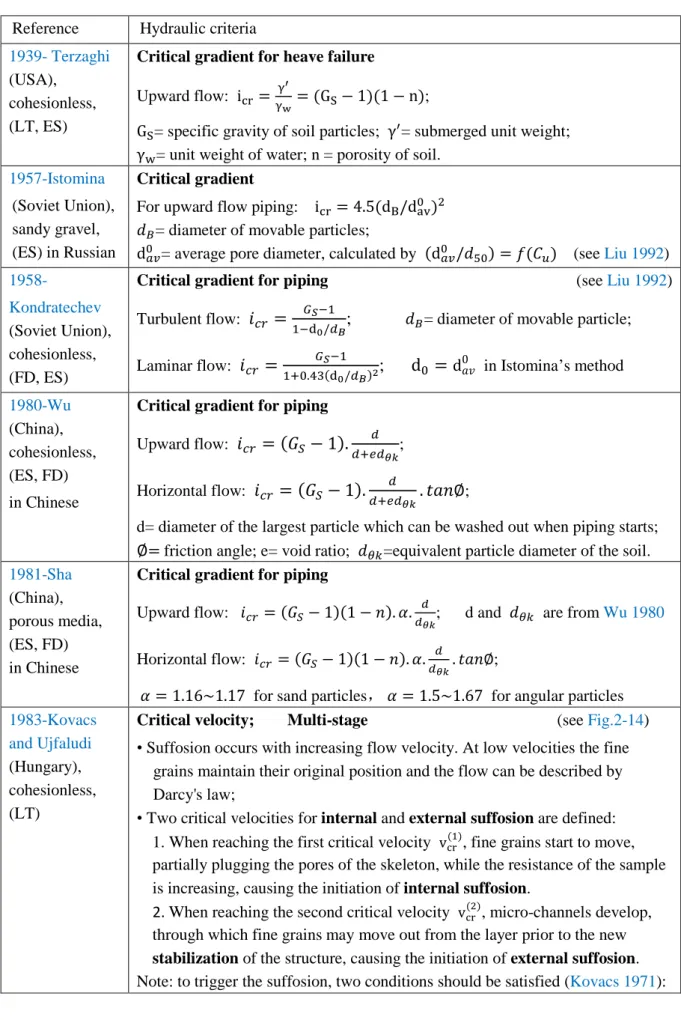
Hydraulic criteria play an important role in evaluating the likelihood of suffusion, even though they are less established than the geometric criteria (Perzlmaier 2007). Hydraulic criteria can be characterized with critical gradient, velocity, shear stress, gas presence, flow direction, duration of seepage, cyclic water head and type of increase in gradient. It seems that most of the previous studies about hydraulic criteria always involve some geometric factors (material properties) such as fines content, void ratio, plasticity, relative density and particle size distribution. Findings in previous studies of hydraulic conditions for the onset of internal instability are summarized in Table 2-3
Fig.2-14 Critical velocities for internal and external suffosion (Kovács and Ujfaludi 1983)
Table 2-3. Hydraulic conditions for the onset of internal instability
Reference Hydraulic criteria 1939- Terzaghi
(USA), cohesionless, (LT, ES)
Critical gradient for heave failure
Upward flow: icr= γ′
γw= (GS− 1)(1 − n);
GS= specific gravity of soil particles; γ′= submerged unit weight; γw= unit weight of water; n = porosity of soil.
1957-Istomina (Soviet Union), sandy gravel, (ES) in Russian
Critical gradient
For upward flow piping: icr= 4.5(dB/dav0 )2 𝑑𝐵= diameter of movable particles;
d𝑎𝑣0 = average pore diameter, calculated by (d𝑎𝑣0 /𝑑50) = 𝑓(𝐶𝑢) (see Liu 1992) 1958-
Kondratechev (Soviet Union), cohesionless, (FD, ES)
Critical gradient for piping (see Liu 1992) Turbulent flow: 𝑖𝑐𝑟 = 𝐺𝑆−1
1−d0/𝑑𝐵; 𝑑𝐵= diameter of movable particle;
Laminar flow: 𝑖𝑐𝑟 = 𝐺𝑆−1 1+0.43(d0/𝑑𝐵)2; d0 = d𝑎𝑣 0 in Istomina’s method 1980-Wu (China), cohesionless, (ES, FD) in Chinese
Critical gradient for piping
Upward flow: 𝑖𝑐𝑟 = (𝐺𝑆− 1). 𝑑 𝑑+𝑒𝑑𝜃𝑘;
Horizontal flow: 𝑖𝑐𝑟 = (𝐺𝑆− 1). 𝑑
𝑑+𝑒𝑑𝜃𝑘. 𝑡𝑎𝑛∅;
d= diameter of the largest particle which can be washed out when piping starts;
∅= friction angle; e= void ratio; 𝑑𝜃𝑘=equivalent particle diameter of the soil. 1981-Sha
(China), porous media, (ES, FD) in Chinese
Critical gradient for piping
Upward flow: 𝑖𝑐𝑟 = (𝐺𝑆− 1)(1 − 𝑛). 𝛼. 𝑑
𝑑𝜃𝑘; d and 𝑑𝜃𝑘 are from Wu 1980
Horizontal flow: 𝑖𝑐𝑟 = (𝐺𝑆− 1)(1 − 𝑛). 𝛼. 𝑑
𝑑𝜃𝑘. 𝑡𝑎𝑛∅;
𝛼 = 1.16~1.17 for sand particles, 𝛼 = 1.5~1.67 for angular particles 1983-Kovacs
and Ujfaludi (Hungary), cohesionless, (LT)
Critical velocity; Multi-stage (see Fig.2-14) • Suffosion occurs with increasing flow velocity. At low velocities the fine
grains maintain their original position and the flow can be described by Darcy's law;
• Two critical velocities for internal and external suffosion are defined: 1. When reaching the first critical velocity vcr
(1)
, fine grains start to move, partially plugging the pores of the skeleton, while the resistance of the sample is increasing, causing the initiation of internal suffosion.
2. When reaching the second critical velocity vcr (2)
, micro-channels develop, through which fine grains may move out from the layer prior to the new
stabilization of the structure, causing the initiation of external suffosion.