Injured Axons Instruct Schwann Cells
to Build Constricting Actin Spheres
to Accelerate Axonal Disintegration
Adrien Vaquie´,1Alize´e Sauvain,1Mert Duman,1,7Gianluigi Nocera,1,7Boris Egger,1,3Felix Meyenhofer,1,2,3
Laurent Falquet,1,2,4Luca Bartesaghi,5Roman Chrast,5Christophe Maurice Lamy,2Seokyoung Bang,6Seung-Ryeol Lee,6 Noo Li Jeon,6Sophie Ruff,1and Claire Jacob1,7,8,*
1Department of Biology, University of Fribourg, Fribourg, Switzerland 2Department of Medicine, University of Fribourg, Fribourg, Switzerland
3Bioimage Light Microscopy Facility, University of Fribourg, Fribourg, Switzerland
4Bioinformatics Core Facility, University of Fribourg and Swiss Institute of Bioinformatics, Fribourg, Switzerland 5Departments of Neuroscience and Clinical Neuroscience, Karolinska Institutet, Stockholm, Sweden
6School of Mechanical and Aerospace Engineering, Seoul National University, Seoul, South Korea 7Department of Biology, Johannes Gutenberg University Mainz, Mainz, Germany
8Lead Contact
*Correspondence:[email protected]
SUMMARY
After a peripheral nerve lesion, distal ends of injured
axons disintegrate into small fragments that are
sub-sequently cleared by Schwann cells and later by
macrophages. Axonal debris clearing is an early
step of the repair process that facilitates
regenera-tion. We show here that Schwann cells promote
distal cut axon disintegration for timely clearing. By
combining cell-based and
in vivo models of nerve
lesion with mouse genetics, we show that this
mech-anism is induced by distal cut axons, which signal to
Schwann cells through PlGF mediating the activation
and upregulation of VEGFR1 in Schwann cells. In
turn, VEGFR1 activates Pak1, leading to the
forma-tion of constricting actomyosin spheres along
un-fragmented distal cut axons to mediate their
disinte-gration. Interestingly, oligodendrocytes can acquire
a similar behavior as Schwann cells by enforced
expression of VEGFR1. These results thus identify
controllable molecular cues of a neuron-glia
cross-talk essential for timely clearing of damaged axons.
INTRODUCTION
Although neurons in the peripheral nervous system (PNS) can regenerate after lesion, regeneration in the central nervous sys-tem (CNS) is mostly inefficient (Brosius Lutz and Barres, 2014; Jessen and Mirsky, 2016). This is due largely to the different types of glial cells present in these two systems: axonal regrowth is pro-moted by Schwann cells (SCs) in the PNS but is inhibited by oligodendrocytes (OLs) and the formation of a glial scar in the CNS (Brosius Lutz and Barres, 2014). Indeed, after lesion, SCs actively demyelinate and convert into repair cells that stimulate axonal regrowth and later remyelinate regenerated axons (
Jes-sen and Mirsky, 2016; Cattin and Lloyd, 2016). In contrast, OLs remain inactive or die after a CNS lesion, and their myelin that contains growth inhibitory factors prevents axonal regrowth (Brosius Lutz and Barres, 2014). In addition, peripheral and cen-tral neurons have different intrinsic regenerative properties. After a PNS lesion, peripheral neurons activate a regeneration program by upregulating a set of genes designated as regeneration-associated genes (RAGs). Some of these RAGs can promote neurite outgrowth and potentially also axonal regrowth (reviewed inHuebner and Strittmatter, 2009). In comparison, central axons upregulate RAGs to a lower extent, indicating lower intrinsic capacity of regeneration (Huebner and Strittmatter, 2009).
Degeneration of injured axons also occurs faster in the PNS than in the CNS. Distal ends of injured axons separated from the neuron soma (distal cut axons) degenerate rapidly in the PNS after lesion (Wong et al., 2017; Vargas and Barres, 2007): within 2 days following a PNS lesion, virtually all axons distal to the lesion site have disintegrated into small fragments (Beirowski et al., 2005). This allows fast clearing of distal cut axons and creates, together with demyelination, a favorable environment for axonal regrowth (Wong et al., 2017; Vargas and Barres, 2007). Indeed, persistent axon fragments directly repel regenerating axon branches (Martin et al., 2010), and delayed axonal degeneration in Wldsmutant mice leads to de-layed axonal regrowth (Brown et al., 1992; Chen and Bisby, 1993) in the PNS. In the CNS, degeneration of distal cut axons also occurs after spinal cord injury or stroke lesions, but this process is a lot slower than in the PNS: although a fraction of injured axons exhibiting an early rise of [Ca2+]
i disintegrate rapidly distal to the lesion site, a large fraction of distal cut axons remain for a longer time (Williams et al., 2014), up to 14 days post-lesion (dpl) in the spinal cord (Buss et al., 2005). Importantly, delaying the disintegration of distal cut axons in the CNS reduces the extent of axonal sprouting and thereby the potential for spontaneous axonal regeneration (Collyer et al., 2014). Understanding the mechanisms that con-trol axonal disintegration after lesion may make it possible to
http://doc.rero.ch
Published in "Cell Reports 27(11): 3152-3166.e7, 2019"
which should be cited to refer to this work.
accelerate this process, which could have a positive impact on PNS and CNS regeneration.
Because degeneration of distal cut axons occurs rapidly after lesion in the PNS, we asked in this study whether SCs influence the disintegration of distal cut axons after lesion. SCs can pro-mote the regeneration of both PNS and CNS axons (Bunge, 2016), thus elucidating the mechanisms that control SC behavior after lesion could uncover strategies to induce SC-like behavior in OLs and thereby stimulate CNS plasticity after lesion. To visu-alize SC behavior after lesion, identify SCs’ underlying mecha-nisms, and test the potential to induce SC-like behavior in OLs, we established models of nervous system lesion in microfluidic devices with co-cultures of dorsal root ganglia (DRG) neurons and either SCs or OLs. We show that these models recapitulate the PNS regeneration process with similar timing as in vivo and CNS regeneration failure. By using these models, we identified the activation by distal cut axons of a VEGFR1-Pak1 pathway in SCs, which induces the formation of constricting actomyosin spheres leading to SC-mediated breakdown of distal cut axons. Indeed, in vivo-specific inactivation of VEGFR1 or SC-specific ablation of Flt1 (Vegfr1) after lesion leads to a decrease of axonal breakdown mediated by SCs in the distal part of the injured nerve. In addition, we show that OLs can acquire a similar behavior by enforced expression of VEGFR1.
RESULTS
In Vitro Lesion Models Recapitulate PNS and CNS Distinct Regeneration Capacities
In this study, we investigated early SC plasticity mechanisms and tested whether these mechanisms can be used to increase OL plasticity after lesion. For this purpose, we first established lesion models in microfluidic devices constituted of two cham-bers connected by microgrooves, in which we cultured primary DRG neurons with SCs (Br€ugger et al., 2015) or OLs (Chen et al., 2007). To obtain neuron/SC cultures, dissociated DRG ex-plants are plated in chamber 1, in which neuronal cell bodies remain because of their large diameter, but their axons grow through microgrooves and invade chamber 2 (Figures 1A and 1B). SCs migrate to interact with and myelinate axons in the mi-crogrooves and chambers (Figures 1A and 1C). This myelinated co-culture system displays high density of myelination with 147 ± 27 (n = 3) internodes per square millimeter in chamber 2 ( Fig-ure 1C). To obtain neuron/OL cultures, we first purify DRG neu-rons and then add primary OLs in chamber 2, which interact with and myelinate axons in microgrooves and in chamber 2 ( Fig-ures 1B and 1D). For live-cell imaging, we label neurons with DsRed and SCs or OLs with GFP (Figures 1A, 1B, and 1E). In the neuron/SC model, microgrooves are filled with SCs ( Fig-ure 1F, red asterisks marking SC nuclei). To follow one-to-one re-lationships between axons and SCs, we use a small amount of GFP-expressing lentiviruses. We then carry out axonal lesions by laser axotomy in microgrooves.
We show that the neuron/SC model recapitulates the main steps of the PNS regeneration process, while the neuron/OL model displays regeneration failure similar to CNS lesions (Figures 2A–2C). In the neuron/SC model, axons have degenerated and SCs have changed their morphology at 1 dpl (Figure 2A). Although
SCs remain present in the chamber as shown by bright-field im-ages, myelin basic protein (MBP) signal is discontinued at 1 dpl and absent at 5 dpl (Figure 2B), suggesting that SCs undergo demyelination. Indeed, bright-field images show degenerated myelin (open pink arrowheads) at 1 dpl and absence of myelin at 5 dpl (Figure 2B). Next, SCs extend a long process contacting axon growth cones to guide axonal regrowth (Figure 2A;Video S1). When axons have regrown, SCs re-interact with and remye-linate regenerated axons (Figures 2A and 2B), as indicated by the reformation of myelin internodes at 30 dpl (MBP staining in Fig-ure 2B), exhibiting the typical shape of SC internodes (Figure 2B, magnification of region highlighted by white box).
SCs do not undergo major apoptosis or proliferation after lesion in our model (Figure S1A) but dedifferentiate, as shown by the upregulation of the major inducer of SC dedifferentiation, cJun (Figure S1B). In vivo, SC proliferation that occurs after lesion but is not required for regeneration (Yang et al., 2008) may be induced by macrophages (Stratton and Shah, 2016), which are absent from these models. In contrast, OLs remain apparently inactive (Figure 2C;Video S2A) or die (Figure 2C; Videos S2B–S2D; Figure S1C) after lesion in the neuron/OL model, and OLs continue to express myelin proteins, as shown by the MBP signal surrounding distal cut axons until at least 15 dpl (Figure 2B). Although neurons alone regrow approxi-mately to a similar extend after lesion when cultured in SC or OL culture media (Figure S2), the presence of SCs increases axonal regrowth extent after lesion, whereas axonal regrowth is impaired in the presence of OLs in our models (Figure S2). SCs Promote Distal Cut Axon Disintegration
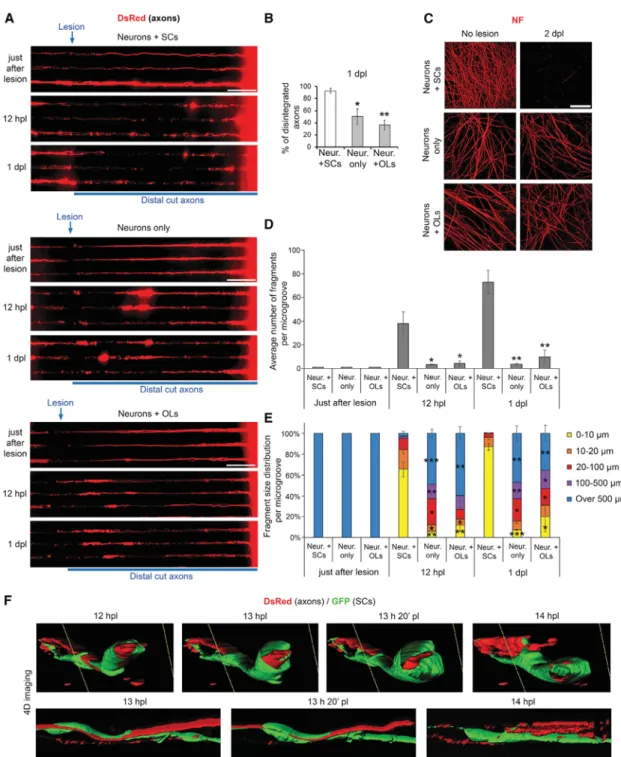
Interestingly, whereas the majority of distal cut axons are disin-tegrated (Video S3illustrates axonal disintegration) at 1 dpl in the neuron/SC model (Figures 2B,3A, and 3B), distal cut axons persist for several days when neurons are cultured alone or in the presence of OLs (Figures 2B, 2C, and3A–3C;Figure S2), indi-cating that SCs accelerate distal cut axon disintegration after lesion. In addition, we show that there is a large number of individual axonal fragments at 12 h post-lesion (hpl) and 1 dpl in microgrooves of neuron + SC cultures (Figures 3A and 3D) and that the large majority of these fragments are of very small size (Figures 3A and 3E). In contrast, there is a small number of individual axonal fragments in neurons only and neuron + OL cultures (Figures 3A and 3D), and a large part of these fragments are long unfragmented distal cut axons (Figures 3A and 3E). Taken together, these results indicate that SCs accelerate the fragmentation of long distal cut axons into small debris.
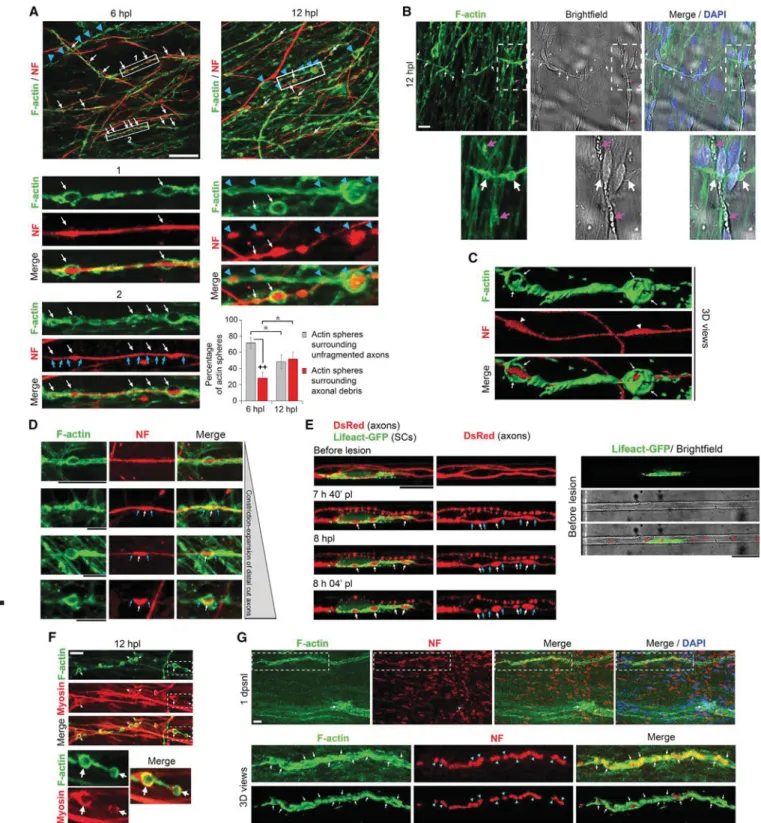
Three-dimensional (3D) live-cell imaging analysis of GFP-labeled SCs and DsRed-GFP-labeled axons after lesion shows that axonal fragmentation is associated with motility of SCs around distal cut axons (Figure 3F;Video S4). Thus, we hypothesized that actin dynamics is involved in axonal fragmentation mediated by SCs. Indeed, we show in our models (Figures 4A–4F;Video S5) and in mouse sciatic nerves (Figure 4G) that after lesion, but not before (Figures S3A and S3B), SCs form strings of actin spheres around distal cut axons. We found that a large majority of actin spheres surround unfragmented distal cut axons at 6 hpl (Figure 4A, white arrows and graph), a time point when most distal cut axons remain unfragmented. This demonstrates that
actin spheres are formed around axons before axonal fragmen-tation and disintegration. After lesion, SCs can also form a fun-nel-shaped actin structure, which has been described to be necessary for the formation and elongation of myelin ovoids (Jung et al., 2011). Myelin ovoids were also suggested to induce axonal fragmentation (Catenaccio et al., 2017). We show here that although funnel-shaped actin does co-localize with degen-erated myelin (Figure 4B, pink arrows), actin spheres do not co-localize with these structures (Figure 4B, white arrows), indi-cating that actin spheres formed by SCs upon lesion are distinct from funnel-shaped actin found at myelin ovoids. Interestingly, we observed a change in the morphology of axons surrounded by actin spheres: axon diameter progressively expanded within the spheres (Figure 4C, white arrowheads, andFigure 4D, white arrows) and simultaneously shrunk at the contact points with actin (Figures 4A and 4D, blue arrows), suggesting that actin spheres mediate mechanical constriction-expansion of distal cut axons. Indeed, by live-cell imaging of F-actin dynamics in SCs using LifeAct-GFP (Riedl et al., 2008;Figure S3C) and of
DsRed-labeled axons, we confirm that actin spheres constrict distal cut axons at their contact points (Figure 4E, blue arrows) and lead to the expansion of the portions of axon surrounded by actin spheres (Figure 4E, white arrows) until axonal disintegra-tion, either in non-myelinating SCs (Figure S3D) or myelinating SCs (Figure S3E). Of note, other SCs, which are not labeled with LifeAct-GFP, are present in microgrooves (Figure 4E, red asterisks) and contribute to the disintegration of distal cut axons together with LifeAct-GFP-labeled SCs. Consistent with live-cell imaging analysis, we found a higher percentage of actin spheres that surrounded axonal debris at 12 hpl compared with 6 hpl ( Fig-ure 4A, blue arrowheads and graph). Commonly, circular actin structures that exert contractile functions are composed of actin filaments and myosin motors (Schwayer et al., 2016). Indeed, our data suggest that lesion-induced constricting actin spheres in SCs are also composed of myosin heavy chain 1 (Figure 4F, ar-rows), a myosin subtype mostly present in skeletal muscle, but which has also been described in other tissues (https://www. genecards.org). Interestingly, we also detected the formation Figure 1. Neuron/SC and Neuron/OL Culture Models in Microfluidic Chambers
(A and B) Schematic representations of dual-color models of DRG neurons myelinated by SCs (A) or OLs (B) and live-cell imaging of chamber 2 and microgrooves showing the distribution of DsRed-labeled axons and GFP-labeled SCs (A) or OLs (B). Large images are wide-field mosaic images. Smaller images show different 3D surface-rendering views of regions highlighted by a blue box on the left image (z series projection). White scale bars, 25mm; black scale bars, 250 mm. (C and D) Co-immunofluorescence of neurofilament (NF) and myelin basic protein (MBP) in chamber 2 showing myelinated axons by SCs (C) or OLs (D). Large images show the single-optical section displaying the highest signal intensity. Smaller images show two different 3D surface-rendering views of the region highlighted by a blue box on the left images (z series projection). White scale bars, 25mm; black scale bars, 250 mm.
(E) Co-immunofluorescence of NF and MBP, GFP fluorescence and DAPI (nuclei) labeling in GFP-labeled myelinating SC. Three-dimensional surface-rendering views of the region highlighted by the dashed box on the upper image shows close apposition of GFP and MBP surface rendering. Representative images of multiple cells are shown. Scale bar, 10mm.
(F) Bright-field pictures of three microgrooves of neuron/SC cultures. Red asterisks on the lower pictures indicate SC nuclei. Scale bar, 25mm. Representative images of three different chambers for each type of culture (neuron/SC and neuron/OL) are shown.
of strings of actin spheres in mouse sciatic nerves at 1 day post-sciatic nerve crush lesion (dpsnl) (Figure 4G, white arrows), which surrounded constricted-expanded axons (Figure 4G, blue arrowheads).
Taken together, these data show that after axonal lesion, SCs form strings of constricting actomyosin spheres along unfrag-mented distal cut axons, which correlates with the consecutive breakdown of distal cut axons into small fragments.
Distal Cut Axons Upregulate PlGF to Activate VEGFR1-Dependent Actin Dynamics
To identify the mechanism by which SCs form actin spheres after lesion, we started by analyzing gene regulation in SCs after lesion. We used chamber 2, which contains mainly SC RNA ( Fig-ure S1D), for gene expression analyses at 1 dpl compared with unlesioned conditions. Actin polymerization is initiated by the Arp2/3 complex, which is activated by effectors that are acti-vated by Rho GTPases (Arnold et al., 2017), themselves activated by guanine nucleotide exchange factors (GEFs). GEF activity can
be triggered through phosphatidylinositol-3 kinase (PI3K), phos-phatidylinositol trisphosphate (PtdIns[3,4,5]P3), and phospholi-pase C (PLC) (Swanson, 2008). PI3K and PLC are activated by tyrosine kinase receptors. The only tyrosine kinase receptor that we found upregulated in our RNA sequencing (RNA-seq) was Vegfr1 (Flt1), while the related receptors Vegfr2 (Flk1 or Kdr) and Nrp1 were downregulated (Table S1, Tab A). We thus hypothesized that VEGFR1 induces actin dynamics in SCs after lesion. Other genes involved in actin-myosin dynamics were also regulated (Table S1, Tab A). In addition to genes involved in actin dynamics, Gene Ontology analysis revealed regulation of other genes involved in metabolism, transport, development, differentiation and myelination, proliferation, im-mune reaction and chemokine production, extracellular matrix assembly and adhesion, cell-cell interaction, migration and guid-ance, apoptosis, and cell death and survival (Table S1, Tab B). Regulation of these different biological functions illustrates the well-known plastic behavior of SCs after lesion (Brosius Lutz and Barres, 2014; Jessen and Mirsky, 2016).
Figure 2. Lesion Models RecapitulateIn Vivo PNS Regeneration Process and CNS Regeneration Failure
(A) Live-cell imaging (wide-field) of a DsRed-labeled axon myelinated by a GFP-labeled SC (among non-labeled axons and SCs) in microgroove before lesion and at different time points after lesion, showing the main steps of the PNS regeneration process. The dashed box shows the same GFP-labeled SC that was imaged at different time points after lesion. See alsoVideo S1.
(B) Co-immunofluorescence of neurofilament (NF) and MBP in neuron/SC and neuron/OL models in unlesioned conditions (no lesion) or at different time points after lesion. Blue arrowheads show remaining distal cut axons after lesion. Bright-field images in neuron/SC cultures at 1 and 5 dpl show the presence of SCs while myelin degenerates. Open pink arrowheads show degenerated myelin. The image on the bottom right (row 30 dpl) of the neuron/SC model is a magnification of the region highlighted by a white box in the image on the left. Single optical sections displaying the highest signal intensity are shown. See alsoFigure S1. (C) Live-cell imaging of GFP-labeled OLs interacting with DsRed-labeled axons in microgrooves before lesion and at 1 dpl and 3D surface rendering views corresponding to the regions highlighted by white boxes on the left images (z series projections). Three-dimensional views labeled ‘‘1’’ and ‘‘2’’ correspond to two different regions on the left image. See alsoVideo S2.
Scale bars, 10mm (A and B) and 25 mm (C). Representative images of at least three chambers for each type of culture (neuron/SC and neuron/OL) at each time point are shown.
Figure 3. SCs Induce Distal Cut Axons Fragmentation Shortly after Lesion
(A) Live-cell imaging (wide-field) of DsRed-labeled axons in microgrooves of neuron + SC, neuron-only, or neuron + OL cultures within 10 min after lesion (just after lesion), at 12 hpl, and at 1 dpl.
(B) Quantification showing the percentage of disintegrated axons (axon disintegration illustrated byVideo S3) at 1 dpl in microgrooves of neurons + SCs, neurons only, or neurons + OLs. Disintegration was quantified using time-lapse imaging. N = 3 chambers per group, axons of 50–100 microgrooves quantified per chamber.
(C) Immunofluorescence images of neurofilament (NF) in cultures of neurons + SCs, neurons only, or neurons + OLs in unlesioned conditions (no lesion) and at 2 dpl. Single optical sections displaying the highest signal intensity are shown.
(D and E) Graphs showing the number of axonal fragments (D) and the percentage of fragments of different sizes (E) per microgroove in neuron + SC, neuron only, and neuron + OL models just after lesion, at 12 hpl, and at 1 dpl. N = 3 chambers per group, 9–27 microgrooves quantified per chamber.
(legend continued on next page)
To test whether VEGFR1 is involved in the control of actin dy-namics in SCs after lesion, we first validated Vegfr1 upregulation by qRT-PCR in chamber 2 (Figure 5A) and found VEGFR1 protein levels already upregulated in most SCs (93%± 1%, n = 3 cham-bers) at 12 hpl in our lesion model (Figure 5B). VEGFR1 was also upregulated in SCs at 1 and 2 dpsnl in mice (Figures 5C, 5D, and S4A), with 74%± 10% VEGFR1-positive SCs (n = 3 animals), suggesting important functions after lesion. Interestingly, the activated form of VEGFR1 (phospho-VEGFR1) co-localized with strings of actin spheres (Figure 5E), suggesting a potential involvement of VEGFR1 activation in the formation of actin spheres. Consistently, phospho-VEGFR1 levels were increased in vivo in SCs at 1 dpsnl (Figure S4B). We thus blocked VEGFR1 activation by using a specific VEGFR1-neutralizing antibody. This led in neuron/SC cultures to impaired formation of constrict-ing actin spheres in SCs (Figure 5F), impaired SC-mediated axonal fragmentation (Figure 5G), and decreased extent of axonal regrowth (Figure S5A). To strengthen our data, we tested the effect of the specific VEGFR1-neutralizing peptide GNQWFI (Bae et al., 2005; Selvaraj et al., 2015) on axonal fragmentation after lesion. We confirm impaired SC-mediated axonal fragmen-tation by using this second approach to inactivate VEGFR1 in SCs (Figure S5B). Consistently, overexpressing VEGFR1 in SCs accelerated the formation of strings of constricting actin spheres and SC-mediated axonal fragmentation (Figure S5C; Figure 5H;Video S6), demonstrating that VEGFR1 controls the formation of constricting actin spheres in SCs, which mediate axonal fragmentation.
Next, we aimed to elucidate how VEGFR1 is activated in SCs after lesion. We hypothesized that a VEGFR1 agonist produced by neurons upon lesion binds to VEGFR1 at the SC surface and activates it. VEGFR1 can be activated by VEGFA, VEGFB, or PlGF. To identify which VEGFR1 agonist activates VEGFR1 af-ter lesion, we measured using ELISA the levels of each agonist released in the medium of neurons only cultures at 1 dpl and compared them with unlesioned conditions. We found increased PlGF release at 1 dpl compared to unlesioned conditions, whereas the release of VEGFA and VEGFB was not significantly increased after lesion (Figure 5I). For this reason, we focused on the potential functions of PlGF on VEGFR1 activation after lesion. PlGF is known to be expressed in central and peripheral axons (Beck et al., 2002; Chaballe et al., 2011). Although PlGF can be soluble, it has been shown that a large fraction is retained at the plasma membrane (Clegg and Mac Gabhann, 2017). Thus, we investigated the presence of PlGF on the axolemma after lesion. We show here that cell surface PlGF is strongly increased at 12 hpl in distal cut axons compared with unlesioned axons (chamber 2) or to the proximal part (chamber 1) of injured axons (Figure 5J), whereas PlGF was not detected in SCs in unlesioned conditions, at 12 hpl or at 1 dpl in our models (data not shown). Importantly, inactivating PlGF with a specific neutralizing anti-body impaired constricting actin sphere formation (Figure 5F)
and SC-mediated axonal fragmentation (Figure 5K) and decreased the extent of axonal regrowth (Figure S5A). We also tested the effect of PlGF downregulation by short hairpin RNA (shRNA) in axons (Figure S5D). We show that this second approach to inactivate PlGF in distal cut axons also leads to reduced SC-mediated axonal fragmentation (Figure S5E). Local translation in distal cut axons begins 10 min after axonal lesion (Verma et al., 2005), thereby allowing rapid de novo protein expression. Indeed, by blocking translation using cyclohexi-mide, we prevented PlGF upregulation at the axonal surface ( Fig-ure 5L), suggesting lesion-induced local translation of PlGF in distal cut axons. We next asked whether PlGF could modulate VEGFR1 expression. Indeed, we show that treatment with 250 ng/mL PlGF for 24 h induces robust VEGFR1 upregulation in purified rat SCs cultured under conditions mimicking SC dedif-ferentiation after lesion (Br€ugger et al., 2017;Figure 5M).
To link PlGF-mediated VEGFR1 activation to actin sphere for-mation in SCs, we hypothesized that VEGFR1 activates Pak1, a major inducer of actin dynamics (Kumar et al., 2006; Vadlamudi et al., 2004; Edwards et al., 1999). Indeed, PlGF treatment increased phospho-Pak1 (active Pak1) levels in SCs cultured under dedifferentiation conditions (Figure 5N). Interestingly, we found that phospho-Pak1 is highly concentrated inside actin spheres (Figure 5O), suggesting an important function in the for-mation of these actin structures. Indeed, we show that inhibition of Pak1 using a Pak1-specific inhibitor (10mM IPA-3) impaired constricting actin sphere formation (Figure 5F) and SC-mediated axonal fragmentation after lesion (Figure 5P). Consistently, we found that phospho-Pak1 levels increased in vivo in SCs at 1 dpsnl (Figures S4C and S4D). Pak1 is an activator of the Arp2/3 complex (Kumar et al., 2006; Vadlamudi et al., 2004), which initiates actin polymerization. We show here that the specific Arp2/3 complex inhibitor CK666 (100mM) also leads to impaired SC-mediated axonal fragmentation after lesion (Figure S5B), indicating an involvement of the Arp2/3 complex in this mechanism.
To validate our findings in vivo, we first treated adult mice immediately after sciatic nerve crush lesion with the VEGFR1-neutralizing peptide, which decreased VEGFR1 activation (phos-phorylation) compared with vehicle treatment in sciatic nerves (Figure 6A) and decreased Pak1 activation (Figure 6B). Consis-tent with our in vitro findings, treatment with the VEGFR1-neutralizing peptide strongly reduced the formation of actin spheres at 1dpsnl compared with vehicle treatment and many axonal fragments distal to the lesion site persisted at 2 dpsnl (Figures 6C and 6D). Also similar to our cell culture findings, PlGF was upregulated early in distal cut axons, already at 3 h post-sciatic nerve crush lesion (hpsnl) (Figures 6E and 6F). At this time point, SCs did not express PlGF, as shown by double labeling of PlGF and MBP (used here as SC surface marker) and 3D reconstruction (Figure 6E). PlGF is, however, upregulated in SCs at 1 dpsnl (Chaballe et al., 2011, and data not shown), where it may amplify SC reaction toward distal cut axons, or
(F) Selected 3D time-lapse photos of GFP-labeled SCs and DsRed-labeled distal cut axons a few hours after lesion (starting at 12 hpl for upper time-lapse and at 13 hpl for lower time-lapse) when breakdown of DsRed-labeled distal cut axons occurs. Entire time-lapse starting at 20 min after lesion is shown inVideo S4. Scale bars, 100mm. Representative images of three chambers per condition are shown. Unpaired two-tailed Student’s t test compared with neurons + SCs: *p < 0.05, **p < 0.01, and ***p < 0.001; values are means; error bars denote SEM.
See alsoFigure S2.
Figure 4. SCs Form Strings of Constricting Actomyosin Spheres after Lesion
(A) F-actin labeling (phalloidin) and neurofilament (NF) immunofluorescence in chamber 2 of neuron + SC model at 6 and 12 hpl and percentage of actin spheres surrounding unfragmented distal cut axons (white arrows) and actin spheres surrounding axonal debris (blue arrowheads). Unpaired two-tailed (black crosses) or one-tailed (gray asterisks) Student’s t test: *p < 0.05 and ++p < 0.01; n = 3 chambers per time point (6 hpl, 218–314 counted spheres per chamber; 12 hpl, 79–96 counted spheres per chamber); values are means; error bars denote SEM. Lower images are magnifications of the regions highlighted by white boxes on the upper images. Blue arrows indicate the constriction points on axons at the contact with actin spheres.
(legend continued on next page)
control SC proliferation and/or macrophage recruitment, as pre-viously proposed (Chaballe et al., 2011).
Importantly, to determine whether VEGFR1 expression is required in SCs for distal cut axon disintegration after sciatic nerve crush lesion, we ablated Flt1 (Vegfr1) specifically in adult SCs. Mice expressing a tamoxifen-inducible Cre recombinase under the control of the Plp promoter (Plp-CreERT2; Leone et al., 2003) were crossed with mice carrying floxed Flt1 alleles (Flt1fl/fl;Ho and Fong, 2015). At 3 months of age, Vegfr1 was ab-lated in SCs by tamoxifen injection. To avoid potential compen-satory mechanisms previously reported (Ho et al., 2012), we used Plp-CreERT2-positive;Flt1fl/wtheterozygous mutants (Flt1 mt) and Plp-CreERT2-negative;Flt1fl/wt littermates as controls (Ct). Ablating one Flt1 allele was sufficient to block the upregula-tion of VEGFR1 in SCs after lesion (Figures 6G and 6H), indi-cating that a minimum threshold level of VEGFR1 expression must be reached to allow upregulation after lesion. Furthermore, ablation of one Flt1 allele significantly reduced phospho-Pak1 levels at 1 dpsnl (Figure 6I). Consistent with our above findings, the formation of actin spheres was strongly reduced at 1dpsnl in Flt1 mt compared with control nerves (Figure 6J) and many axonal fragments distal to the lesion site persisted at 2 dpsnl (and at least until 5 dpsnl; data not shown) in the distal crushed nerve of Flt1 mt but not of control mice (Figures 6K and 6L). To determine whether axonal regrowth is affected in Flt1 mt sciatic nerves, we used the marker of axonal regrowth growth-associ-ated protein 43 (GAP43). We show here that GAP43 levels are strongly reduced at 2 dpsnl in the distal crushed nerve of Flt1 mt compared with controls (Figures 6M and 6N), indicating reduced axonal regrowth in Flt1 mt sciatic nerves and suggest-ing that the persistence of distal axonal fragments in Flt1 mt nerves slows down axonal regrowth, as expected from previous studies (Wong et al., 2017; Vargas and Barres, 2007; Beirowski et al., 2005; Martin et al., 2010; Brown et al., 1992; Chen and Bisby, 1993). Consistent with slower axonal regrowth, functional recovery of toe sensitivity was slower in Flt1 mt mice compared with controls (Figure 6O).
Taken together, these results indicate that injured axons instruct SCs to induce their disintegration by actin constriction through a VEGFR1-Pak1-dependent pathway.
VEGFR1 Overexpression in OLs Promotes Distal Cut Axon Disintegration
In contrast to SCs, VEGFR1 was not detected in OLs after lesion in our lesion models or in unlesioned chambers (data not shown). Consistent with this, mature (CC1+) OLs do not express VEGFR1 or at very low levels (Figure S6A) and do not upregulate VEGFR1 after a spinal cord lesion (Figure S6B). However, PlGF was upregulated in central axons after a spinal cord lesion (Figure S6C), suggesting that OLs do not upregu-late VEGFR1 in the presence of PlGF. Indeed, PlGF did not induce VEGFR1 expression in mature OLs (CC1+;Figure S6D). We thus hypothesized that VEGFR1 may enable OLs to react similarly as SCs in the presence of PlGF. Indeed, whereas GFP-expressing mature OLs (primary cultures) did not activate Pak1 in response to PlGF treatment, enforced expression of VEGFR1 by lentiviral vector allowed Pak1 activation (as shown by phosphorylated Pak1 signal) in the presence of 250 ng/mL PlGF for 1 h in mature OLs (Figure 7A). In addition, overexpres-sion of VEGFR1 also increased phospho-Pak1 levels in the presence of PlGF in the Oli-neu OPC cell line differentiated into mature OLs (Figure 7B). Consistent with this, VEGFR1 overexpression in primary OLs promoted distal cut axon disin-tegration within 1 dpl, compared with the disindisin-tegration of distal cut axons in the presence of primary OLs transduced with a control lentivirus (Figures 7C and 7D). Three-dimensional time-lapse imaging of GFP-labeled processes of primary OLs overexpressing VEGFR1 showed that these processes enwrap distal cut axons after lesion until their disintegration (Figure 7E). Consistently, time-lapse imaging of F-actin (labeled by LifeAct-GFP) of primary OLs overexpressing VEGFR1 showed increased actin polymerization in OLs after lesion around unfragmented distal cut axons until their disintegration (Figures 7F and 7G; Video S7). Constriction of axons at the contact points with F-actin until their disintegration indicates that OLs overexpressing VEGFR1 are capable, similarly to SCs, of promoting distal cut axon disintegration by actin constriction. Consistent with faster distal cut axon disintegra-tion, the extent of axonal regrowth was significantly increased in the presence of primary OLs expressing VEGFR1 compared with GFP control OLs (Figure S2).
(B) F-actin labeling (phalloidin) and bright-field images at 12 hpl in neuron/SC cultures. Pink arrows point to funnel-shaped actin accumulation at myelin ovoids (Jung et al., 2011) visible in bright field, while white arrows indicate actin spheres. Note that strings of constricting actin spheres are distinct from funnel-shaped actin and are not localized at degenerated myelin. Lower images are magnifications of the regions highlighted by dashed boxes on the upper images. Single optical sections are shown.
(C) Three-dimensional reconstruction of F-actin surface rendering and NF at 12 hpl showing actin spheres (white arrows) surrounding an unfragmented axon that is expanded (white arrowheads) in the actin spheres. See alsoVideo S5.
(D) F-actin co-labeling with NF in chamber 2 of neuron/SC cultures after lesion showing different axonal morphology inside actin spheres, illustrating the constriction-expansion of distal cut axons. White arrows point to expanded axons inside actin spheres and blue arrows to constricted axonal regions at the contact points with actin spheres.
(E) Time-lapse imaging of DsRed-labeled axons and LifeAct-GFP-labeled SC in microgroove. White arrows indicate the formation of actin spheres and blue arrows the constriction points on the axon. Other unlabeled SCs present in the microgroove are shown by red asterisks.
(F) F-actin co-labeling with myosin heavy chain 1 (white arrows show actomyosin spheres). Lower images are magnifications of the region highlighted by dashed boxes on the upper images.
(G) F-actin co-labeling with NF in cryosections of mouse sciatic nerve at 1 dpsnl showing expanded-constricted axons (blue arrowheads) surrounded by actin spheres (white arrows). Images are z series projections or 3D views (upper 3D view images show the staining and lower images are 3D surface rendering).
Scale bars, 25mm (A) and 10 mm (B and D–G). Representative images of three chambers per condition or of three animals are shown. See alsoFigures S3andS4.
Figure 5. Axonal PlGF Activates VEGFR1-Dependent Actin Dynamics in SCs, Leading to Distal Cut Axon Fragmentation
(A) Vegfr1 mRNA levels quantified by qRT-PCR in SCs (chamber 2) showing increased levels at 1dpl compared with unlesioned conditions (Ctrl). (B) VEGFR1 immunofluorescence and DAPI labeling (nuclei) in chamber 2 of neuron/SC model at 12 hpl and in unlesioned conditions.
(C) VEGFR1 and F4/80 (macrophage marker) co-immunofluorescence and DAPI (nuclei) labeling in unpermeabilized conditions in crushed and contralateral uninjured mouse sciatic nerves at 1 dpsnl.
(D) Western blot of VEGFR1 and GAPDH (loading control) in lysates of crushed (Cr) compared with unlesioned contralateral (Co) mouse sciatic nerves at 12 hpsnl and 1, 2, and 5 dpsnl and quantification normalized to GAPDH.
(E) F-actin (phalloidin) and phospho-VEGFR1 (activated VEGFR1) co-labeling in neurons + SCs at 6 hpl showing co-localization of phospho-VEGFR1 with actin spheres (white arrows) and actin between spheres (blue arrowheads).
(F) F-actin and neurofilament (NF) co-labeling and percentage of axons with actin spheres (axons with at least one actin sphere) in neuron + SC model at 12 hpl showing expanded axons (blue arrowheads) within constricting actin spheres (white arrows) in the presence of a PlGF neutralizing or a VEGFR1-neutralizing antibody, a Pak1-specific inhibitor, or the vehicle added to the culture medium 1 h before lesion.
(G) DsRed-labeled neurons (cultured with SCs) treated with the VEGFR1-neutralizing antibody or IgG control 1 h before lesion and quantification at 12 hpl of remaining distal cut axons compared with control.
(H) Time-lapse images 10 min after lesion, 6 and 9 hpl of DsRed-labeled axons and LifeAct-GFP-labeled SCs (see alsoFigure S5andVideo S6) expressing endogenous levels of VEGFR1 (control) or overexpressing VEGFR1 (VEGFR1over) by lentiviral vector and graph showing the percentage of axons disintegrating at each hour from 5 to 13 hpl (no axon disintegrated before 5 hpl).
(I) PlGF, VEGFA, and VEGFB levels determined as fold increase at 1 dpl compared with unlesioned conditions (Ctrl; set to 1) by ELISA on supernatants of microfluidic chambers containing purified neurons. PlGF concentration range, 1–10 pg/mL; VEGFA concentration range, 100–400 pg/mL; VEGFB concentration range, 4–18 pg/ml. The contents of three chambers were pooled for each n.
(J and L) PlGF immunofluorescence in purified neurons at 12 hpl in chamber 1 (axons proximal to the lesion site) or chamber 2 (distal cut axons) merged with bright field in untreated conditions (J) or treated with cycloheximide (CHX) or its vehicle in chamber 2 just before lesion (L).
(K and P) NF immunofluorescence in neuron + SC cultures treated 1 h before lesion with the PlGF-neutralizing antibody or control IgG (K) or with the Pak1-specific inhibitor IPA-3 or its vehicle (P) and quantification of remaining distal cut axons using NF signal and Cell Profiler 2.0.
(M and N) Western blots of VEGFR1 (M) or phospho-Pak1 (N) in primary dedifferentiated SCs treated with 250 ng/mL PlGF or vehicle for 24 h and quantification normalized to GAPDH. Dashed lines indicate that samples were run on the same gel but not on consecutive lanes.
(O) F-actin and phospho-Pak1 co-labeling in neurons + SCs at 6 hpl showing clustering of phospho-Pak1 signal inside actin spheres (white arrows). In (B) and (C), arrows point to SCs and arrowheads to macrophages. Scale bars: white, 10mm; black, 250 mm. Unpaired (A, F, H, M, and N) or paired (D, G, and I) two-tailed (black asterisks) or one-tailed (gray asterisks) Student’s t test: *p < 0.05, **p < 0.01, and ***p < 0.001; values are means; error bars denote SEM (A, D, F–H, K, M, N, and P: n = 3 per group; I: n = 3–7 per group). Representative images of three independent experiments are shown.
Figure 6. Specific Inactivation or Genetic Ablation of VEGFR1 Impairs Distal Cut Axon Disintegration after Sciatic Nerve Crush Lesion
(A) Phospho-VEGFR1, S100 (SC marker), and F4/80 (macrophage marker) co-immunofluorescence and DAPI (nuclei) labeling at 2 dpsnl in crushed sciatic nerves of mice treated with the VEGFR1-neutralizing peptide compared with crushed sciatic nerves of vehicle-treated mice. Arrows point to SCs and arrowheads to macrophages.
(B–D) Phospho-Pak1 western blot and quantification normalized to GAPDH (B) and F-actin (phalloidin) labeling (C) or neurofilament (NF) immunofluorescence (D) together with DAPI labeling in crushed sciatic nerves of VEGFR1-neutralizing peptide-treated compared with vehicle-treated mice collected at 1 dpsnl (B and C) or at 2 dpsnl (D).
(E and F) PlGF co-immunofluorescence with MBP (E) or NF (F) and DAPI at 3 hpsnl in crushed and contralateral mouse sciatic nerves. Three-dimensional view: region highlighted by dashed box on left image.
(legend continued on next page)
DISCUSSION
To identify and modulate plasticity mechanisms of the nervous system after lesion, it is of utmost importance to use models al-lowing the measurement of dynamic cell plasticity parameters and to analyze at the molecular level the contribution of each cell type involved. Models currently available comprise various in vivo paradigms of PNS and CNS lesions, which are instru-mental to study regeneration and functional recovery at the or-ganism level but imply limitations: in vivo live imaging is restricted in depth or limited to non-mammalian organisms, and system-atic analyses such as RNA-seq are difficult to interpret because of the cellular complexity of the nervous system. State-of-the-art in vitro myelinated regeneration models allow compartmentali-zation of neuronal soma, axons, and glial cells (Taylor et al., 2005; Park et al., 2006) but are currently restricted to the evalu-ation of axonal regrowth density and neuron transcript analyses in the absence of glial cells. Here we developed lesion models of myelinated mammalian systems for the study of plasticity mech-anisms after lesion and the design of strategies to increase plas-ticity and improve regeneration of the PNS and CNS (i.e., drug screening for regenerative medicine). We show that these models allow high-resolution time-lapse imaging of neuron-glial cell interactions after lesion and transcriptomic analyses in pure or highly enriched neuron or glial cell populations. We also demonstrate that these lesion models recapitulate each step of the regeneration process in the PNS with similar timing as in vivo and regeneration failure occurring in the CNS after lesion. In addition, flux isolation and dual-color imaging allow separately modulating gene expression in neurons and glial cells and iden-tify plasticity mechanisms to test strategies enhancing regener-ation of the nervous system after lesion. These systems can thus be used to speed up the discovery of potential treatments to be afterward tested in vivo.
Importantly, by using these models, we demonstrate that shortly after lesion, SCs promote distal cut axon disintegration to accelerate their clearing. SCs are known to phagocytose axonal debris and digest their own myelin after lesion (Jessen and Mirsky, 2016; Wong et al., 2017), but axons need first to be disintegrated into small fragments to be phagocytosed. Distal cut axon disintegration is thought to be an axon-inherent mech-anism (Raff et al., 2002), but we show here that this process is slow in the absence of SCs and that SCs induce the breakdown of distal cut axons within a few hours after axonal lesion. We demonstrate that SC-dependent disintegration of axons is
induced by VEGFR1 activation in SCs. Indeed, after axonal lesion, VEGFR1 is rapidly upregulated and activated in SCs by the VEGFR1 agonist PlGF, which is locally translated in distal cut axons upon lesion. Local protein translation in distal cut axons is a process that has been previously shown to begin 10 min after axonal lesion (Verma et al., 2005). We show that axonal lesion induces a modest but significant extracellular release of PlGF and a strong increase of PlGF at the outer surface of distal cut axons but not at the surface of proximal cut axons attached to the neuron soma. In addition, we show that antago-nizing PlGF impairs SC-mediated distal cut axon disintegration. These findings indicate that PlGF instructs SCs to induce distal cut axons disintegration. It has been shown that PlGF is also up-regulated in SCs at 1 dpsnl (Chaballe et al., 2011), an observation that we also made. However, PlGF is upregulated earlier in distal cut axons, already at 3 hpsnl, a time point when PlGF expression is not detected in SCs. Furthermore, in our lesion models, we could not detect PlGF expression in SCs in unlesioned condi-tions, at 12 hpl or at 1 dpl, a time point when VEGFR1 is already upregulated in SCs and when SC-dependent axonal disintegra-tion through VEGFR1 activadisintegra-tion has already taken place. PlGF upregulation at 1 dpsnl in SCs may amplify SC reaction toward distal cut axons by an autocrine mechanism. Alternatively, PlGF upregulation in SCs may control SC proliferation and/or macrophage recruitment after lesion, as previously suggested (Chaballe et al., 2011). However, in our lesion models, SCs do not proliferate after lesion, and macrophages are absent; thus SC proliferation and/or macrophages do not contribute to SC-dependent axonal disintegration.
In addition, we demonstrate that VEGFR1 activation in SCs leads to the activation of Pak1, a major activator of actin dy-namics that acts through the activation of the Arp2/3 complex (Kumar et al., 2006; Vadlamudi et al., 2004) and LIM kinases ( Ed-wards et al., 1999). We also show that Pak1 activation is required for SC-dependent axonal fragmentation. The signals by which axonal lesion induces SC responses are partially understood. Here, we identify a molecular mechanism by which distal cut axons signal to SCs and which is required to activate SC-depen-dent disintegration of distal cut axons.
Interestingly, we show that the PlGF/VEGFR1/Pak1 axis leads to the formation of strings of actin spheres in SCs along unfrag-mented axons, which constrict distal cut axons at their points of contact with axons, thereby leading to axonal expansion within the spheres until complete axonal disintegration. We show that SC actin spheres form independently of myelin ovoids. It has
(G and H) Western blot of VEGFR1 and GAPDH loading control (G) and co-immunofluorescence of VEGFR1, S100, and F4/80 together with DAPI labeling (H) in the crushed (Cr) or uninjured contralateral (Co) sciatic nerve of Flt1 mt mice compared with control littermates (Ct) at 2 dpsnl.
(I, K, and M) Western blots of phospho-Pak1 (I), NF (K), or GAP43 (M) and GAPDH loading control and quantification of phospho-Pak1, NF, and GAP43 normalized to GAPDH in sciatic nerves of Flt1 mt mice compared with Ct at 1 dpsnl (phospho-Pak1) or at 2 dpsnl (NF and GAP43; values were normalized to the uninjured contralateral nerve [‘‘Co’’] of each animal).
(J, L, and N) F-actin labeling (phalloidin) (J), NF (L), or GAP43 (N) immunofluorescence and DAPI labeling in distal crushed nerves of Flt1 mt mice and Ct at 1 dpsnl (J) or at 2 dpsnl (L and N).
(O) Quantification of sensory function recovery by toe pinch test at 12, 15, and 20 dpsnl in Flt1 mt and control mice.
In (G) and (I), the dashed lines indicate that samples were run on the same gel but not on consecutive lanes. In (C) and (J), arrowheads point to strings of actin spheres. Scale bars: 10mm (A, E, F, and H), 20 mm (C), 50 mm (J), 250 mm (N), and 500 mm (D and L). Unpaired (M and O) or paired (B, I, and K) one-tailed (gray asterisk) or two-tailed (black asterisks) Student’s t test: *p < 0.05 and **p < 0.01; values are means; error bars denote SEM. In (A) and (N), n = 3 animals per group; in (O), n = 4–9 animals per group (n = 9 for Ct and n = 6 for Flt1 mt at 12 and 15 dpsnl, n = 6 for Ct and n = 4 for Flt1 mt at 20 dpsnl). Representative images (z series projections or 3D views) of three animals per group for each experiment are shown.
been previously shown that funnel-shaped F-actin is present at Schmidt-Lantermann incisures in intact peripheral nerves and is necessary for the formation of myelin ovoids after lesion (Jung et al., 2011). VEGFR1-dependent actin spheres that we identify here are dedicated to the disintegration of distal cut axons and are not involved in myelin ovoid formation. Interest-ingly, three key genes for the formation of myosin filaments
and myosin contraction were upregulated in our RNA-seq ana-lyses in SCs at 1 dpl: Myh1, Myom1, and Casq2. Indeed, we found that myosin heavy chain 1 co-localized with F-actin at the spheres in SCs after lesion, indicating the formation of con-stricting actomyosin spheres. The formation of such structures (spheres or rings) has been previously described to serve other cellular processes, including cytokinesis, wound closure, and Figure 7. Enforced Expression of VEGFR1 in OLs Promotes Distal Cut Axon Disintegration
(A) Phospho-Pak1, CC1 (mature OL marker, false-colored in green), and DAPI (nuclei) co-labeling in primary OLs cultured under differentiation conditions, transduced with a control lentivirus or a lentivirus expressing VEGFR1 and treated with 250 ng/mL PlGF for 1 h. Arrows show CC1+ cells. Representative images of three independent experiments are shown.
(B) Western blot of phospho-Pak1 in Oli-neu cells differentiated into mature OLs and transduced with GFP or VEGFR1-expressing lentiviruses and treated with PlGF for 1 h and quantification normalized to GAPDH. Three independent experiments were carried out per condition.
(C and D) Live-cell imaging of DsRed-labeled axons and GFP-labeled OLs transduced with a VEGFR1-expressing or a control (GFP) lentiviral vector (C) and graph showing the percentage of disintegrated axons at 1dpl (D). The course of axon disintegration was followed by time-lapse imaging, 6–23 axons were followed for each time-lapse, and three to five time-lapses per condition were used for quantification.
(E–G) Live-cell imaging of DsRed-labeled axons and (E) GFP-labeled or (F and G) LifeAct-GFP-labeled OLs transduced with a VEGFR1-expressing or a control (empty) lentiviral vector.
In (C) and (E)–(G), OLs were first transduced with high-titer VEGFR1-expressing lentiviruses or control lentiviruses and 3 days later with high-titer GFP-expressing lentiviruses (C and E) or high-titer LifeAct-GFP lentiviruses (F and G). Images shown are z series projections (A, C, and F) and time-lapse 3D surface rendering (E and G). Arrows show OL processes (E) or F-actin (F and G) enwrapping DsRed-labeled axons. Blue arrowheads indicate constriction points by actin on axons. Scale bars, 10mm. Unpaired two-tailed Student’s t tests: *p < 0.05 and **p < 0.01; values are means; error bars denote SEM.
See alsoFigure S6andVideo S7.
epithelial cell extrusion (Schwayer et al., 2016). In addition, non-constricting actin ring-like structures are used for cell-cell contacts (Schwayer et al., 2016). We demonstrate here that constricting actin spheres are also instrumental for the disin-tegration of damaged axons, as a result of a collaborative crosstalk between distal cut axons and SCs. Interestingly and reminiscent of the pro-disintegrating functions of SCs on distal cut axons after lesion,Han et al. (2014)showed in Drosophila that epidermal cells, rather than just internalizing disintegrated dendrite pieces, wrap degenerating dendrites with actin-rich membrane structures to facilitate dendrite breakdown (Han et al., 2014).
In contrast to SCs, OLs do not exhibit plasticity behaviors after axonal lesion. Instead, they remain at their myelinating state in the lesion site or die, and their myelin, which contains growth-inhibitory factors, is not cleared and prevents axonal regrowth (Brosius Lutz and Barres, 2014). We show that OLs do not upre-gulate VEGFR1 after axonal lesion, despite the upregulation of PlGF at the surface of CNS axons after spinal cord injury. However, enforced expression of VEGFR1 in OLs using lentiviral vectors induces distal cut axons fragmentation to a similar level as in neuron/SC cultures after lesion and promotes axonal regrowth in our in vitro lesion models: similar to SCs but in contrast to wild-type OLs, OLs overexpressing VEGFR1 ex-hibited motility around distal cut axons after lesion, encircling distal cut axons with F-actin until their disintegration. However, OLs overexpressing VEGFR1 did not form the same actin sphere morphology as SCs. It is possible that the different inherent cellular morphology of SCs and OLs and their different abilities to interact with axons lead to the formation of different actin structures to mediate axonal disintegration after lesion.
In summary, this study identifies a mechanism of SC plasticity that occurs within a few hours following axonal lesion and that is essential for rapid disintegration of distal cut axons. This mech-anism, which is triggered by distal cut axons upregulating PlGF after lesion and thereby activating VEGFR1 in SCs, can be ac-quired by OLs through enforced expression of VEGFR1. This work thus provides a proof of concept for a strategy to help modulating SC and OL plasticity in the PNS and CNS and thereby opens potential avenues to enhance regeneration of the PNS and CNS after injury.
STAR+METHODS
Detailed methods are provided in the online version of this paper and include the following:
d KEY RESOURCES TABLE
d CONTACT FOR REAGENT AND RESOURCE SHARING
d EXPERIMENTAL MODEL AND SUBJECT DETAILS
B Animals
B DRG neurons/SC cultures
B DRG neurons/primary OL cultures
B Primary rat SC cultures
B Oli-neu cultures d METHOD DETAILS
B Western blot
B Set up and optimization of microfluidic models
B Live cell microscopy and image processing of lesion models B Generation of lentiviruses B Laser axotomy B Immunofluorescence B EdU assay B RNA isolation
B RNA sequencing and data analysis
B qRT-PCR
B ELISA
B Toe pinch test
d QUANTIFICATION AND STATISTICAL ANALYSIS
d DATA AND SOFTWARE AVAILABILITY SUPPLEMENTAL INFORMATION
Supplemental Information can be found online athttps://doi.org/10.1016/j. celrep.2019.05.060.
ACKNOWLEDGMENTS
Plp-CreERT2 mice have been used in collaboration with Dr. Ueli Suter. We thank Dr. Edward M. Callaway for the pLV-LSyn-RFP construct, Dr. Olivier Pertz for the LifeAct-GFP construct, Dr. Jacqueline Trotter for the Oli-neu cell line, Dr. Frank Pfrieger for comments on the manuscript, and the Lausanne Genomic Technologies Facility of the University of Lausanne for the RNA sequencing. C.J. acknowledges support from the Swiss National Science Foundation (grants PP00P3_1139163, PP00P3_163759, and 31003A_173072), the Interna-tional Foundation for Research in Paraplegia, OPO-Stiftung (grant IRP-P147), and the Novartis Foundation for Medical-Biological Research (grant 15C191). N.L.J. acknowledges support from the Basic Science Research Program through the National Research Foundation of Korea (NRF) funded by the Minis-try of Science and Technology (NRF 2018R1A2A1A05019550).
AUTHOR CONTRIBUTIONS
A.V. and C.J. conceived and designed the experiments. A.V., A.S., M.D., G.N., and S.R. performed the experiments. A.V., A.S., M.D., G.N., L.F. (bioinformat-ics analysis of RNA sequencing), and C.J. analyzed the data. F.M. wrote the image processing macros. F.M., B.E., and C.M.L. contributed to the spin-ning-disk and laser lesion setup and to image processing. L.B. and R.C. de-signed the microfluidic chamber dimensions and started the cultures. N.L.J., S.B., and S.-R.L. created the microfluidic chamber master molds. A.V. and C.J. wrote the manuscript. All authors commented on the manuscript.
DECLARATION OF INTERESTS
The authors declare no competing interests. Received: January 7, 2019
Revised: April 11, 2019 Accepted: May 17, 2019 Published: June 11, 2019
REFERENCES
Arnold, T.R., Stephenson, R.E., and Miller, A.L. (2017). Rho GTPases and actomyosin: partners in regulating epithelial cell-cell junction structure and function. Exp. Cell Res. 358, 20–30.
Bae, D.G., Kim, T.D., Li, G., Yoon, W.H., and Chae, C.B. (2005). Anti-flt1 peptide, a vascular endothelial growth factor receptor 1-specific hexapeptide, inhibits tumor growth and metastasis. Clin. Cancer Res. 11, 2651–2661.
Beck, H., Acker, T., P€uschel, A.W., Fujisawa, H., Carmeliet, P., and Plate, K.H. (2002). Cell type-specific expression of neuropilins in an MCA-occlusion
model in mice suggests a potential role in post-ischemic brain remodeling. J. Neuropathol. Exp. Neurol. 61, 339–350.
Beirowski, B., Adalbert, R., Wagner, D., Grumme, D.S., Addicks, K., Ribches-ter, R.R., and Coleman, M.P. (2005). The progressive nature of Wallerian degeneration in wild-type and slow Wallerian degeneration (WldS) nerves. BMC Neurosci. 6, 6.
Benjamini, Y., and Hochberg, Y. (1995). Controlling the false discovery rate: a practical and powerful approach to multiple testing. J. R. Stat. Soc. B 57, 289–300.
Brosius Lutz, A., and Barres, B.A. (2014). Contrasting the glial response to axon injury in the central and peripheral nervous systems. Dev. Cell 28, 7–17.
Brown, M.C., Lunn, E.R., and Perry, V.H. (1992). Consequences of slow Wal-lerian degeneration for regenerating motor and sensory axons. J. Neurobiol.
23, 521–536.
Br€ugger, V., Engler, S., Pereira, J.A., Ruff, S., Horn, M., Welzl, H., M€unger, E., Vaquie´, A., Sidiropoulos, P.N., Egger, B., et al. (2015). HDAC1/2-dependent P0 expression maintains paranodal and nodal integrity independently of myelin stability through interactions with neurofascins. PLoS Biol. 13, e1002258.
Br€ugger, V., Duman, M., Bochud, M., M€unger, E., Heller, M., Ruff, S., and Jacob, C. (2017). Delaying histone deacetylase response to injury accelerates conversion into repair Schwann cells and nerve regeneration. Nat. Commun. 8, 14272.
Bunge, M.B. (2016). Efficacy of Schwann cell transplantation for spinal cord repair is improved with combinatorial strategies. J. Physiol. 594, 3533–3538.
Buss, A., Pech, K., Merkler, D., Kakulas, B.A., Martin, D., Schoenen, J., Noth, J., Schwab, M.E., and Brook, G.A. (2005). Sequential loss of myelin proteins during Wallerian degeneration in the human spinal cord. Brain 128, 356–364.
Catenaccio, A., Llavero Hurtado, M., Diaz, P., Lamont, D.J., Wishart, T.M., and Court, F.A. (2017). Molecular analysis of axonal-intrinsic and glial-associated co-regulation of axon degeneration. Cell Death Dis. 8, e3166.
Cattin, A.L., and Lloyd, A.C. (2016). The multicellular complexity of peripheral nerve regeneration. Curr. Opin. Neurobiol. 39, 38–46.
Chaballe, L., Close, P., Sempels, M., Delstanche, S., Fanielle, J., Moons, L., Carmeliet, P., Schoenen, J., Chariot, A., and Franzen, R. (2011). Involvement of placental growth factor in Wallerian degeneration. Glia 59, 379–396.
Chen, S., and Bisby, M.A. (1993). Impaired motor axon regeneration in the C57BL/Ola mouse. J. Comp. Neurol. 333, 449–454.
Chen, Y., Balasubramaniyan, V., Peng, J., Hurlock, E.C., Tallquist, M., Li, J., and Lu, Q.R. (2007). Isolation and culture of rat and mouse oligodendrocyte precursor cells. Nat. Protoc. 2, 1044–1051.
Clegg, L.E., and Mac Gabhann, F. (2017). A computational analysis of in vivo VEGFR activation by multiple co-expressed ligands. PLoS Comput. Biol. 13, e1005445.
Collyer, E., Catenaccio, A., Lemaitre, D., Diaz, P., Valenzuela, V., Bronfman, F., and Court, F.A. (2014). Sprouting of axonal collaterals after spinal cord injury is prevented by delayed axonal degeneration. Exp. Neurol. 261, 451–461.
Dobin, A., Davis, C.A., Schlesinger, F., Drenkow, J., Zaleski, C., Jha, S., Batut, P., Chaisson, M., and Gingeras, T.R. (2013). STAR: ultrafast universal RNA-seq aligner. Bioinformatics 29, 15–21.
Edwards, D.C., Sanders, L.C., Bokoch, G.M., and Gill, G.N. (1999). Activation of LIM-kinase by Pak1 couples Rac/Cdc42 GTPase signalling to actin cytoskeletal dynamics. Nat. Cell Biol. 1, 253–259.
Ghosh, A., Sydekum, E., Haiss, F., Peduzzi, S., Zo¨rner, B., Schneider, R., Baltes, C., Rudin, M., Weber, B., and Schwab, M.E. (2009). Functional and anatomical reorganization of the sensory-motor cortex after incomplete spinal cord injury in adult rats. J. Neurosci. 29, 12210–12219.
Gokhan, S., Marin-Husstege, M., Yung, S.Y., Fontanez, D., Casaccia-Bonnefil, P., and Mehler, M.F. (2005). Combinatorial profiles of oligodendrocyte-selec-tive classes of transcriptional regulators differentially modulate myelin basic protein gene expression. J. Neurosci. 25, 8311–8321.
Han, C., Song, Y., Xiao, H., Wang, D., Franc, N.C., Jan, L.Y., and Jan, Y.N. (2014). Epidermal cells are the primary phagocytes in the fragmentation and clearance of degenerating dendrites in Drosophila. Neuron 81, 544–560.
Ho, V.C., and Fong, G.H. (2015). Vasculogenesis and angiogenesis in VEGF receptor-1 deficient mice. Methods Mol. Biol. 1332, 161–176.
Ho, V.C., Duan, L.J., Cronin, C., Liang, B.T., and Fong, G.H. (2012). Elevated vascular endothelial growth factor receptor-2 abundance contributes to increased angiogenesis in vascular endothelial growth factor receptor-1-defi-cient mice. Circulation 126, 741–752.
Huebner, E.A., and Strittmatter, S.M. (2009). Axon regeneration in the periph-eral and central nervous systems. Results Probl. Cell Differ. 48, 339–351.
Jacob, C., Grabner, H., Atanasoski, S., and Suter, U. (2008). Expression and localization of Ski determine cell type-specific TGFbeta signaling effects on the cell cycle. J. Cell Biol. 182, 519–530.
Jessen, K.R., and Mirsky, R. (2016). The repair Schwann cell and its function in regenerating nerves. J. Physiol. 594, 3521–3531.
Jung, M., Kra¨mer, E., Grzenkowski, M., Tang, K., Blakemore, W., Aguzzi, A., Khazaie, K., Chlichlia, K., von Blankenfeld, G., Kettenmann, H., and Trotter, J. (1995). Lines of murine oligodendroglial precursor cells immortalized by an activated neu tyrosine kinase show distinct degrees of interaction with axons in vitro and in vivo. Eur. J. Neurosci. 7, 1245–1265.
Jung, J., Cai, W., Lee, H.K., Pellegatta, M., Shin, Y.K., Jang, S.Y., Suh, D.J., Wrabetz, L., Feltri, M.L., and Park, H.T. (2011). Actin polymerization is essential for myelin sheath fragmentation during Wallerian degeneration. J. Neurosci.
31, 2009–2015.
Kumar, R., Gururaj, A.E., and Barnes, C.J. (2006). p21-activated kinases in cancer. Nat. Rev. Cancer 6, 459–471.
Leone, D.P., Genoud, S., Atanasoski, S., Grausenburger, R., Berger, P., Metzger, D., Macklin, W.B., Chambon, P., and Suter, U. (2003). Tamoxifen-inducible glia-specific Cre mice for somatic mutagenesis in oligodendrocytes and Schwann cells. Mol. Cell. Neurosci. 22, 430–440.
Love, M.I., Huber, W., and Anders, S. (2014). Moderated estimation of fold change and dispersion for RNA-seq data with DESeq2. Genome Biol. 15, 550.
Martin, S.M., O’Brien, G.S., Portera-Cailliau, C., and Sagasti, A. (2010). Waller-ian degeneration of zebrafish trigeminal axons in the skin is required for regen-eration and developmental pruning. Development 137, 3985–3994.
Nathanson, J.L., Yanagawa, Y., Obata, K., and Callaway, E.M. (2009). Prefer-ential labeling of inhibitory and excitatory cortical neurons by endogenous tropism of AAV and lentiviral vectors. Neuroscience 161, 441–450.
Park, J.W., Vahidi, B., Taylor, A.M., Rhee, S.W., and Jeon, N.L. (2006). Micro-fluidic culture platform for neuroscience research. Nat. Protoc. 1, 2128–2136.
Preibisch, S., Saalfeld, S., and Tomancak, P. (2009). Globally optimal stitching of tiled 3D microscopic image acquisitions. Bioinformatics 25, 1463–1465.
Raff, M.C., Whitmore, A.V., and Finn, J.T. (2002). Axonal self-destruction and neurodegeneration. Science 296, 868–871.
Riedl, J., Crevenna, A.H., Kessenbrock, K., Yu, J.H., Neukirchen, D., Bista, M., Bradke, F., Jenne, D., Holak, T.A., Werb, Z., et al. (2008). Lifeact: a versatile marker to visualize F-actin. Nat. Methods 5, 605–607.
Schwayer, C., Sikora, M., Slova´kova´, J., Kardos, R., and Heisenberg, C.-P. (2016). Actin rings of power. Dev. Cell 37, 493–506.
Selvaraj, D., Gangadharan, V., Michalski, C.W., Kurejova, M., Sto¨sser, S., Srivastava, K., Schweizerhof, M., Waltenberger, J., Ferrara, N., Heppenstall, P., et al. (2015). A functional role for VEGFR1 expressed in peripheral sensory neurons in cancer pain. Cancer Cell 27, 780–796.
Stratton, J.A., and Shah, P.T. (2016). Macrophage polarization in nerve injury: do Schwann cells play a role? Neural Regen. Res. 11, 53–57.
Swanson, J.A. (2008). Shaping cups into phagosomes and macropinosomes. Nat. Rev. Mol. Cell Biol. 9, 639–649.
Taylor, A.M., Blurton-Jones, M., Rhee, S.W., Cribbs, D.H., Cotman, C.W., and Jeon, N.L. (2005). A microfluidic culture platform for CNS axonal injury, regen-eration and transport. Nat. Methods 2, 599–605.
Vadlamudi, R.K., Li, F., Barnes, C.J., Bagheri-Yarmand, R., and Kumar, R. (2004). p41-Arc subunit of human Arp2/3 complex is a p21-activated kinase-1-interacting substrate. EMBO Rep. 5, 154–160.
Vargas, M.E., and Barres, B.A. (2007). Why is Wallerian degeneration in the CNS so slow? Annu. Rev. Neurosci. 30, 153–179.
Verma, P., Chierzi, S., Codd, A.M., Campbell, D.S., Meyer, R.L., Holt, C.E., and Fawcett, J.W. (2005). Axonal protein synthesis and degradation are necessary for efficient growth cone regeneration. J. Neurosci. 25, 331–342.
Williams, P.R., Marincu, B.N., Sorbara, C.D., Mahler, C.F., Schumacher, A.M., Griesbeck, O., Kerschensteiner, M., and Misgeld, T. (2014). A recoverable
state of axon injury persists for hours after spinal cord contusion in vivo. Nat. Commun. 5, 5683.
Wong, K.M., Babetto, E., and Beirowski, B. (2017). Axon degeneration: make the Schwann cell great again. Neural Regen. Res. 12, 518–524.
Yang, D.P., Zhang, D.P., Mak, K.S., Bonder, D.E., Pomeroy, S.L., and Kim, H.A. (2008). Schwann cell proliferation during Wallerian degeneration is not necessary for regeneration and remyelination of the peripheral nerves: axon-dependent removal of newly generated Schwann cells by apoptosis. Mol. Cell. Neurosci. 38, 80–88.
STAR
+METHODS
KEY RESOURCES TABLEREAGENT or RESOURCE SOURCE IDENTIFIER
Antibodies
Rabbit anti-VEGFR1 Abcam Cat#ab32152; RRID:AB_778798
Rabbit anti- phospho(S204)-PAK1 Abcam Cat#ab79503; RRID:AB_1658891
Rabbit anti-Neurofilament Millipore Cat#AB1987: RRID:AB_91201
Rabbit anti-GAP43 Abcam Cat#ab75810; RRID:AB_1310252
Mouse anti-GAPDH Genetex Cat#GTX28245; RRID:AB_370675
Rabbit anti-cJun Abcam Cat#ab32137; RRID:AB_731608
Rat anti-MBP Serotec Cat#MCA409S; RRID:AB_325004
Rabbit anti-Sox10 DCS Innovative Diagnostik-Systeme Cat#SI058C01; RRID:AB_2313583
Mouse anti-CC1 Millipore Cat#OP80; RRID:AB_2057371
Rat anti-F4/80 Genetex Cat#GTX26640; RRID:AB_385952
Rabbit anti-cleaved Caspase 3 Cell Signaling Cat#9661; RRID:AB_2341188
Rabbit anti-PlGF Abcam Cat#ab196666
Rabbit anti-phospho-VEGFR1 (Tyr1213) Millipore Cat#07-758; RRID:AB_492649 Mouse anti-Myosin heavy chain 1, fast, 2x Developmental Studies
Hybridoma Bank
Cat#6H1; RRID:AB_1157897
Rat anti-PlGF (neutralizing antibody) Novus Cat#NBP2-21953
Mouse anti-VEGFR1 (neutralizing antibody) R&D Systems - Bio-techne Cat#AF471; RRID:AB_355379 Mouse anti-IgG R&D Systems - Bio-techne Cat##AB-108-C; RRID:AB_354267 Bacterial and Virus Strains
Lentivirus: pLV-LSyn-RFP Nathanson et al., 2009 Addgene construct#22909
Lentivirus: LentiLox 3.7 [pLL3.7] ATCC ATCCâ VRMC39
Lentivirus: Lifeact-GFP Dr. Olivier Pertz, University of Bern, Switzerland
N/A
Lentivirus: Lenti-ORF clone of FLT1 (mGFP-tagged)-Human fms-related tyrosine kinase 1
Origene Cat#RC224406L2
Lentivirus: PlGF shRNA Sigma Cat#SHCLNG, TRCN0000065844
Lentivirus: Control shRNA Sigma Cat#PLK0.1
Chemicals, Peptides, and Recombinant Proteins
anti-Flt1 peptide: GNQWFI Bio-Synthesis 10581-01
Tamoxifen Sigma T5648
IPA-3 (Pak1 inhibitor) Selleckchem Cat#S7093
CK666 (Arp2/3 complex inhibitor) Sigma Cat#SML0006
Recombinant Mouse PlGF-2 Protein R&S Systems 465-PL-010 Phalloidin-iFluor 488 Reagent – CytoPainter Abcam Cat#ab176753
Rhodamine Phalloidin ThermoFisher Cat#R415
Critical Commercial Assays
Click-iT Plus EdU Alexa Fluor 647 Imaging Kit Life Technologies Cat#C10640 Rat Vascular Endothelial Growth Factor A ELISA Kit MyBioSource.com Cat#MBS748119 Placenta Growth Factor ELISA kit MyBioSource.com Cat#MBS727112 Vascular Endothelial Growth Factor B (VEGF-B) ELISA kit MyBioSource.com Cat#MBS269676 Deposited Data
RNaseq data This study ENA: PRJEB32448
(Continued on next page)
CONTACT FOR REAGENT AND RESOURCE SHARING
Further information and requests for resources and reagents should be directed to and will be fulfilled by the Lead Contact, Claire Jacob ([email protected]).
EXPERIMENTAL MODEL AND SUBJECT DETAILS Animals
Mice were housed in individually ventilated cages and had free access to water and food. We used adult mice of mixed background backcrossed several times to C57BL/6J. Sciatic nerve crush lesions were carried out on 3 to 4-month old male and female mice, as previously described (Br€ugger et al., 2017). No randomization method was used, but experimenters were blinded to the experimental group (treatment) and received only the animal number given at birth by the animal caretaker. As control vehicle mice, we used litter-mate mice of the same sex. Treatments: 100ml of 1 mg/ml VEGFR1 neutralizing peptide (GNQWFI, Bio-Synthesis) or its vehicle (6% DMSO, 0.01% acetate/PBS) were injected in the pelvic cavity after wound closure. Spinal cord hemisections were carried out at T8 level on 3 to 4-month old male and female mice as described (Ghosh et al., 2009). Mice heterozygous for Flt1 floxed allele (Ho and Fong, 2015, The Jackson Laboratory) were crossed with mice expressing tamoxifen-inducible Cre recombinase under control of the SC-specific Plp promoter (Leone et al., 2003). To ablate VEGFR1, mice received daily injections of 2 mg tamoxifen (Sigma) for five consecutive days and lesions were done 3 weeks post tamoxifen injections. Genotypes were determined by PCR on genomic DNA. Animal use was approved by the Veterinary office of the Canton of Fribourg.
DRG neurons/SC cultures
DRG explants were collected from embryonic day (E) 14.5-15.5 Wistar rat embryos and dissociated as previously described (Br€ugger et al., 2015). The detailed culture protocol is described below in the section entitled ‘‘Set up and optimization of microfluidic models.’’ In some cases, cells were treated with 100mM cycloheximide (only in chamber#2, just before lesion) to inhibit mRNA translation into protein. In other cases, cells were treated with PlGF neutralizing antibody (43.75mg/ml, Novus, cat. #NBP2-21953), VEGFR1 neutral-izing antibody (43.75mg/ml, R&D Systems - Bio-techne, cat. #AF471-SP) or IgG control (43.75 mg/ml, R&D Systems - Bio-techne, cat. #AB-108-C) or with the specific Pak1 inhibitor IPA-3 (10mM, Selleckchem, cat. #S7093) or with the specific Arp2/3 complex inhibitor CK666 (100mM, Sigma, cat. # SML0006) or with the VEGFR1 neutralizing peptide GNQWFI (1 mg/ml, Bio-Synthesis) or their vehicle 1 h before lesion. In other cases, neurons were transduced with lentiviral vectors carrying either a PlGF shRNA (Sigma, mission Continued
REAGENT or RESOURCE SOURCE IDENTIFIER
Experimental Models: Cell Lines
Rat dorsal root ganglia dissociated explant culture This study N/A Primary rat dorsal root ganglia neuron This study N/A DRG neurons/Primary rat oligodendrocyte cultures This study N/A
Primary rat Schwann cell cultures This study N/A
Oli-neu cell line Jung et al., 1995 N/A
Experimental Models: Organisms/Strains Mouse: C57BL/6J Plp-CreERT2+;Flt1fl/wtmutant: PLP-CreERT2;Flt1tm1.1Fong
Leone et al., 2003; Ho and Fong, 2015 (The Jackson Laboratory)
N/A
Mouse: C57BL/6J Plp-CreERT2-;Flt1fl/wtControl: Flt1tm1.1Fong Ho and Fong, 2015(The Jackson Laboratory)
N/A
Oligonucleotides
rat Vegfr1-Forward: 50-GTGTCTATAGGTGCCGAGCC-30 Microsynth N/A rat Vegfr1-Reverse: 50-GGGTGATCAGCTCCAGGTTT-30 Microsynth N/A rat Gapdh-Forward: 50-GTATCCGTTGTGGATCTGACAT-30 Microsynth N/A rat Gapdh-Reverse: 50-GCCTGCTTCACCACCTTCTTGA-30 Microsynth N/A Software and Algorithms
vaquiea/VisiView_Stack-Assembler v1.0 This study https://zenodo.org/record/844628
Fiji Preibisch et al., 2009 N/A
STAR 2.5.0b Dobin et al., 2013 N/A
Imaris 9.3 https://imaris.oxinst.com/products/ imaris-single-full
N/A