HAL Id: hal-00587248
https://hal.archives-ouvertes.fr/hal-00587248
Preprint submitted on 19 Apr 2011
HAL is a multi-disciplinary open access
archive for the deposit and dissemination of
sci-entific research documents, whether they are
pub-lished or not. The documents may come from
teaching and research institutions in France or
abroad, or from public or private research centers.
L’archive ouverte pluridisciplinaire HAL, est
destinée au dépôt et à la diffusion de documents
scientifiques de niveau recherche, publiés ou non,
émanant des établissements d’enseignement et de
recherche français ou étrangers, des laboratoires
publics ou privés.
Flowers in flour: avalanches in cohesive granular matter.
Eric Freyssingeas, Marie-Julie Dalbe, Jean-Christophe Géminard
To cite this version:
Eric Freyssingeas, Marie-Julie Dalbe, Jean-Christophe Géminard. Flowers in flour: avalanches in
cohesive granular matter.. 2011. �hal-00587248�
E. Freyssingeas, M.-J. Dalbe and J.-C. G´eminard
Universit´e de Lyon, Laboratoire de Physique, Ecole Normale Sup´erieure de Lyon, CNRS, 46 All´ee d’Italie, 69364 Lyon cedex 07, France.
We report on the intermittent dynamics of the free surface of a cohesive granular material during a silo discharge. In absence of cohesion, one observes the formation and the growth of a conical crater whose angle is well-defined and constant in time. When the cohesion is involved, the free surface exhibits a complex dynamics and the crater, resulting from a series of individual avalanches, is no longer axi-symmetric. However, in spite of the intermittent behavior of the free surface, the flow-rate is observed to remain constant throughout the discharge.
INTRODUCTION
The flow of granular media through an orifice, because of its practical importance, has been intensely studied in the last 50 years [1–11]. The phenomenon also presents some interesting fundamental features. For instance, what mainly differentiates the discharge of a container filled with granular matter from one filled with a vis-cous liquid is that the mass flow rate does not depend on the height of material above the outlet. The explana-tion most frequently used for this independence is based on the Janssen effect: the distribution of the weight of the material onto the silo walls, due to the friction forces, leads to a saturation of the pressure at the bottom, which results in a constant flow rate [12]. As we shall see, even if the conditions for the Janssen effect to be involved are not fulfilled, the flow rate remains constant because it is independent of the pressure in the outlet region [13]. In general, the discharge of a silo through an orifice can present three regimes: a continuous flow, an intermittent flow, or a complete blockage of the flow due to arching depending on the ratio of the typical grain diameter d to the aperture diameter D [14–16]. However, for a large outlet, in the continuous regime, the mass flow rate Q is satisfactorily accounted for by the empirical Beverloo law which, for instance, predicts that Q∝ D5/2[1, 17].
In addition, adding even minute amounts of liquid can change dramatically the mechanical properties of the granular matter. For instance, during the building of sand castles, one observes a transformation from a fluid-like to a sticky and deformable material with increasing water content. Indeed, at very low water content, the formation of partially developed capillary bridges leads to a fast increase of tensile strength whereas, for large enough fluid content, tensile strength is nearly constant [18]. Cluster formation was identfied as the main mech-anism responsible of such a behavior [19]. Depending on the granular system, the cohesion can be due to electro-static interactions and van der Waals forces, magnetic interactions [20], and even solid bonds [21, 22]. The co-hesion has been lately proven to give rise to puzzling surface patterning when the material is deformed [23].
Suprizingly, among the broad litterature about the silo
discharge, only a few studies were dedicated to the case of cohesive materials and the dynamics of the free sur-face has not yet been reported. In the present article, we report a study of the surface dynamics during the con-tinuous discharge of a weakly cohesive material and show that it exhibits a complex and interesting behavior.
EXPERIMENTAL TECHNIQUES Experimental principle
We aim at assessing the deformation of the free surface of a granular material during a silo discharge. To do so, we consider the flow a granular material through an orifice pierced at the base of a cylindrical container. The flow-rate is measured and the free surface is observed so as to determine its geometry.
First, it is a common observation that the discharge leads to a significant deformation of the free surface only when the height of the granular column compares with the diameter of the container. In our experimental condi-tions, the diameter of the container is always larger than the depth of the granular bed. We note that, in this limit, the granular column is not subjected to any dynamical version of the usual static Janssen effect [3] and the pres-sure at the outlet thus continuously decreases during the discharge [24]. Second, it has long been identified that fluctuations of the outflow and, even, blockages are ob-served if the diameter of the outlet is too small, typically less than ten times the grains diameter [25]. In order to avoid system blockages, the diameter of the aperture is at least ten times the diameter of the grains in our ex-perimental conditions. At last, we consider the case of slightly cohesive granular matter, meaning that the an-gle of avalanche is less than 90 degrees. The cohesion is tuned by considering various grain sizes, whereas the typical atmospheric conditions remain constant. The co-hesion is accounted for by the measurement of the angle of avalanche [26, 27].
Thus, in brief, the experiment consists in studying the discharge of a wet granular material through a hole pierced at the bottom of a bucket.
2
Experimental setup
The experimental setup (Fig. 1) consists of a cylin-drical container with a hole at the bottom. The upper surface is observed thanks to two CCD cameras whereas the flow-rate is measured by means of a scale placed un-derneath. granular material open aperture scale 1 2 cameras lig h t sh e e t X X
LED ring LED ring
FIG. 1. Experimental setup – The experimental setup
consists of a cylindrical container with a hole at the bottom. The mass of the falling grains is measured by means of a scale placed underneath whereas the deformations of the free surface are observed thanks to two CCD cameras. A ring of LEDs is used to obtain a good contrast in the images from above. A LASER diode is used to produce a light sheet which makes possible to report the surface profile in a vertical, ra-dial, plane. Two thin lamina, located at the base of the con-tainer are used to tune the size of the aperture and to open the container (see text for details).
The container is made of a Plexiglas cylinder (inner diameter 15 cm, height 15 cm) glued on a Plexiglas plate (Fig. 1) supported by four vertical legs. A large orifice (diameter 1 cm) is drilled in the plate at the center. Two additional lamina sliding in a slot (width 2 cm) are used to tune (Fig. 1, aperture) the diameter D of outlet (2, 4, 6 or 8 mm) and to suddenly initiate the flow (Fig. 1,
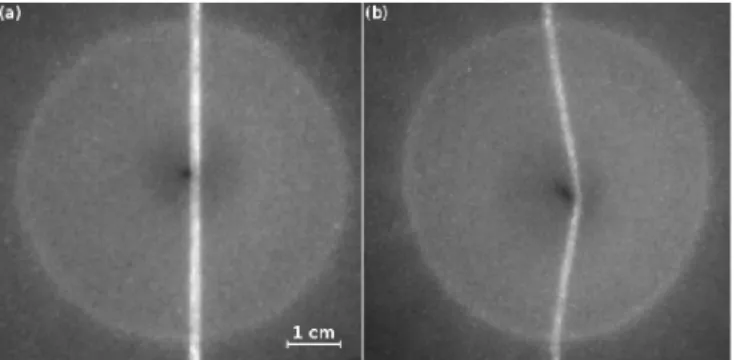
FIG. 2. Images of the free surface – (a) Top view –
A good contrast is obtained by the use of an annular light source providing an homogeneous grazing light. The bright line is from the vertical light sheet casted onto the surface. (b) Side view – The deformation of the bright line, observed from the side thanks to the second camera makes it possible to reconstruct the surface profile along one radial direction (d = 45− 90 µm, D = 6 mm)
.
open).
An electronic scale (KERN 440-51N) placed under the container measures the mass M of the deposited grains with an accuracy to within 0.1 g. The temporal reso-lution of the measurements is achieved by means of an RS-232 connection to a PC, which makes it possible to record the mass as a function of time at 2 Hz.
The free surface is imaged by means of 2 CCD cameras (JAI CB-080 GE, monitored by CVB 10.0 software from STEMMER IMAGING S.A.S.). The first camera (Fig. 1, camera 1) images the free surface from the top, along the vertical (Fig. 2a). We are interested in observing the ver-tical deformation of the free surface: A good contrast is achieved by the use of a ring of LEDs, placed slightly above the level of the free surface, which produces an homogeneous grazing light. The second camera (Fig. 1, camera 2) is used to obtain the profile of the free sur-face in one radial direction. To do so, the latter camera makes an angle of about 30◦ with respect to the verti-cal whereas a vertiverti-cal light-sheet from a LASER diode and a glass cylinder is casted onto the granular surface. In this latter configuration, the profile of the free surface can reconstructed from the deformation of the bright line visible in the image (Fig. 2b). The images from both cameras are recorded during the container discharge and subsequently analyzed with ImageJ [28].
The granular material
The granular material consists of sodosilicate glass beads (Matrasur, sodosilicate glass, density 2200 kg/m3). In order to probe different situations, experiments are carried out on seven different granular batches (Table I). For all batches, the measured density of the granular
ma-terial is ρ = (1510± 20) kg/m3, corresponding to a com-pacity of about 0.68±0.02. Using these different batches we expect to observe different behaviors. Indeed, on the one hand, for batches 4 to 7, the granular material flows easily and does not exhibit cohesion. In other words, the beads do not stick significantly to each other. On the other hand, for batches 1 and 2, the granular material is strongly cohesive and any attempt to make the mate-rial flow leads to the appearance of fractures. For these batches, the adhesion force between the grains is signif-icant. Finally, batch 3 exhibits an intermediate state (a weak cohesion between beads).
1 2 3 4 5 6 7
0-45 45-90 75-150 150-200 180-300 250-425 425-600
◦ ◦ ◦/• • • • •
88 56 34 22 22 22 22
TABLE I. Granular batches – Seven different batches, con-sisting of glass spheres, were used in the experiments. Small grains clearly exhibit cohesion whereas large grains do not exhibit any apparent cohesive behavior. Batch 3 is an inter-mediate case (Top: batch number. Center : diameter range in µm. Center : ◦ cohesion; • no apparent cohesion. Bottom : lateral slopes angle θc.)
Several reasons can explain the cohesion in batches made of small grains. It may originate from capillary bridges between beads due to room humidity [26, 27], or from Van der Walls interactions as well [29, 30]. In our experimental conditions, both reasons are likely to be in-volved in the cohesion. Whatever the physical origin of the cohesion, it will be accounted for by the measurement of the angle of avalanche, θa, which indeed depends on the adhesion force between the grains [31].
Experimental procedures
The experiment is prepared by filling, without any spe-cific care, the container with the granular material up to a height of about 15 cm and by subsequently levelling the free surface in order to start from a flat surface and a well-defined granular height. Acquisitions of the images and of the deposited weight are started a few seconds before the aperture is opened. The experiment finishes once the grains stop flowing. Acquisitions are stopped a few seconds later.
EXPERIMENTAL RESULTS Cohesionless material
In the case of cohesionless material, the discharge pro-cess in entirely reproducible involving a discharge at con-tinuous flow-rate and a regular shape of the crater. We
thus first report experimental results obtained for batches 4 to 7, therefore for grain diameters larger than 150 µm typically.
Discharge rate
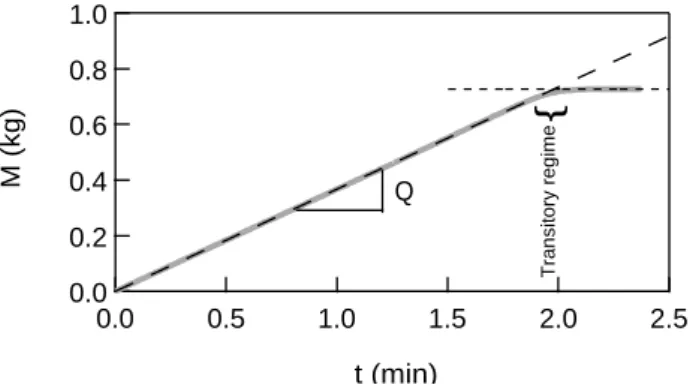
For large grains, one observes a linear increase of the deposited mass M as a function of time t (Fig 3), and thus a constant flow-rate Q, thourough the entire discharge: We mention that, on the one hand, the stationary regime is reach immediately after the outlet is opened. On the other hand, a short transitory regime is observed just before the flow stops, at end of the reservoir drainage. Its duration, a few seconds, much less than the duration of the entire discharge, depends on the flow-rate.
In the final state an annular pile remains around the outlet. 1.0 0.8 0.6 0.4 0.2 0.0 M (kg) 2.5 2.0 1.5 1.0 0.5 0.0 t (min) Q
{
Transitory regimeFIG. 3. Deposited mass M vs. time t – For cohesionless materials, the deposited mass M increases linearly with time t thourough the entire discharge. The permanent regime is reached immediately after the outlet is opened and the flow-rate Q can be accuflow-rately determined from the slope. The final transitory regime, during typically 10 seconds in this example, corresponds to the fall of the last grains along the granular slopes that remain around the outlet in the final state (d = 250− 425 µm, D = 6 mm).
In the whole experimental range of the aperture diam-eter D, the experiments are reproducible and the flow rate Q only depends on the diameters d and D of the beads and outlet, respectively. It is particularly interest-ing to note that the flow-rate Q is constant even if the granular height above the outlet is smaller than the con-tainer diameter: even if the Janssen effect cannot insure that the pressure at the outlet is constant, the flow-rate remains constant [13]. Considering various choices of d and D (Fig. 4), we recover that the mass flow-rate Q is indeed given by the Beverloo law [1, 17]:
Q = A ρ g12(D − k d) 5
2 (1)
where ρ = 1510 kg/m3 denotes the density of the gran-ular material and g the acceleration due to the gravity.
4
From the interpolation of the experimental data we de-termine the prefactor A = 0.63± 0.06. As expected from simple geometrical arguments, the size of the aperture is effectively reduced by a constant length of the order of the grain diameter d and we estimate k = 1.0± 0.1.
1 10 k 600 400 200 0 d (µm) 5 4 3 2 1 0 Q* ( 10 -6 m 5/2 ) 8 6 4 2 0 D (mm) 0-45 µm 45-90 µm
FIG. 4. Reduced flow-rate Q∗ vs. D – We report the reduced flow-rate Q∗ ≡ Q/[ρ√g(1 − d/D)2.5] as a function of the aperture diameter D (The symbol size is proportional to the grain diameter d). We observe that, for cohensionless materials (larger grains, batches 4 to 7), the flow-rate is satis-factorily given by Beverloo law (Eq. 1) with k = 1.0± 0.1 and A = 0.63± 0.06 (continuous line). For cohesive grains, the flow-rate varies a lot from one experimental run to another (typically up to 30% in the case of batch 2 and up to 50% for batch 1). In average, the flow-rate is smaller, given by Bev-erloo law with A = 0.63± 0.06 and larger values of k that are reported in the inset (error bars of about 10%, barely visible in the log-lin scale used to point out that k is about 1 for the cohesionless materials).
Dynamics of the free surface
For cohesionless materials, soon after the reservoir is opened, a crater forms at the free surface at the ver-tical of the outlet. The crater is axi-symmetric and the contour observed from above is a circle of radius
R(t). For all experimental conditions, we observe that
the slopes make a constant angle θc with the horizontal. The grains avalanching continuously along the slope, we deduce that the experimental angle θc equals, by defini-tion, the dynamical angle of avalanche θa. We measure to be θa= (21.5± 1) deg (Fig. 5). Finally, after the dis-charge, when the lateral piles are at rest, we measure that
θc is slightly smaller, corresponding then, by definition, to the angle of repose θr= (19.5± 1) deg.
One can easily account for the temporal evolution of the radius of the crater, R(t), by considering that the volume of the crater corresponds to the volume of the deposited mass M that increases linearly with the time
t. Taking into account the flow-rate Q, the density of the
material ρ and the dynamical angle of avalanche θd, one
-6 -4 -2 0 2 4 6
r (cm)
θc
FIG. 5. Vertical profile at various times t – We re-port the profile of the crater in a vertical plane of symme-try every 5 seconds. We observe that the angle θc that the
slopes make with the horizontal is constant throughout the entire discharge (Thick lines: grey, profile of the initial sur-face; black, t = 25 s. Thin lines: from light grey to black, t = 5 s to 20 s . d = 425− 600 µm, D = 6 mm).
obtains after simple algebra:
R3(t) = 3 Q
πρ tan(θc)
t, (2)
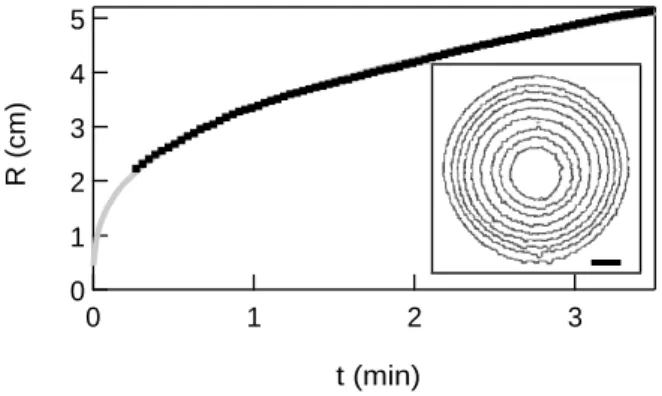
in good agreement with the experimental data (Fig. 6).
5 4 3 2 1 0 R (cm) 3 2 1 0 t (min)
FIG. 6. Radius R vs. time t – In agreement with Q
constant and simple geometrical arguments, R scales like t1/3 [Black dots, experimental data; grey line, Eq. (2)]. Inset: contours of the crater in the horizontal plane at different, equally-spaced (2.5 sec), times t (The scale bar is worth 2 cm. d = 150− 250 µm, D = 6 mm).
In the next section, we will consider the behavior of the flow-rate as well as that of the free surface when the cohesion is involved in the discharge process. We will make use of the results previously reported for the cohensionless material to analyze the phenomenon in the same framework.
Cohesive material
For small grains (batches 1 and 2), typically smaller than 100 µm, when cohesion plays a role, one observes
that the discharge leads to the formation of an irreg-ular crater which results from a sequence of indepen-dent avalanches. In this case, the experiments are not, strictly speaking, reproducible. From one experiment to another, the discharge process may vary a lot. In partic-ular, the quantity of granular material that fell through the orifice during the reservoir drainage can be very dif-ferent for two experiments performed in the same ex-perimental conditions (same grains and same outlet di-ameter D). In practice, we note variations of the av-erage flow rate Q of about 30% in the case of batch 2 (d = 45− 90 µm) and of about 50% for the smallest grains (batch 1, d = 0− 45 µm), from one experimen-tal run to another. This may come from the difficulty of preparing identical initial states. Indeed, the way the beads are poured in the tank significantly affects the ini-tial compaction, and thus the discharge process, of cohe-sive granular materials. Nevertheless, the typical behav-ior of the material during the discharge exhibits several common features that we report in the present section.
Discharge rate
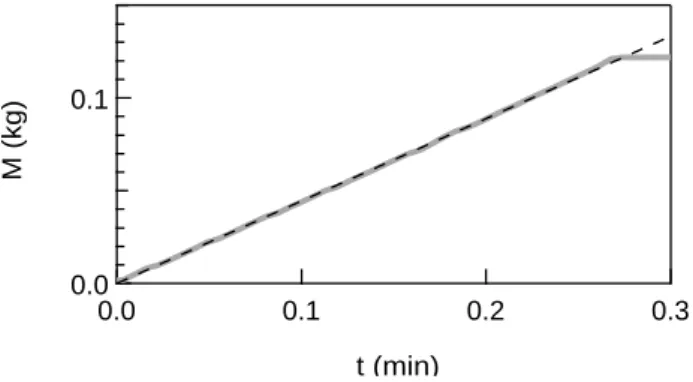
Although the dynamics is intermittent at the free sur-face, the mass of granular material flowing out through the hole still exhibits a linear increases, with little fluc-tuations, as a function of time thorough the entire dis-charge (Fig. 7). Therefore, as for cohesionless material,
Q is constant. In this case again, the flow rate, which
depends on the diameters d and D of the grains and of the outlet respectively, is independent of the amount of material above. 0.1 0.0 M (kg) 0.3 0.2 0.1 0.0 t (min)
FIG. 7. Deposited mass M vs. time t – For cohesive
materials, the deposited mass M increases linearly with time t thorough the entire discharge in spite of the intermittent avalanche process occurring in the container (d = 45−90 µm, D = 6 mm).
It is particularly interesting to point out that, surpris-ingly, the flow rate is constant in spite of the intermittent dynamics of the avalanche process above. The explana-tion of such behavior is found by direct observaexplana-tion of
the crater. Indeed, one easily observes that the drainage involves two different processes. First, the grains that de-tach from the lateral slopes fall down in the crater. This fluidized material flows continuously through the outlet. Second, the decrease of the height of fluidized material in the crater leads to a destabilization of the lateral walls of the crater. The resulting avalanches feed, in turn, the fluidized region above the outlet. The flow rate which does not depend on the height of grains above the outlet remains constant.
For cohesive grains, the experimental flow-rate Q is observed to be significantly smaller than that expected with the values A = 0.63 and k = 1 (cohesionless sam-ples) in Beverloo law (Fig. 4). However, the experimental data from the cohesive samples are correctly accounted for by Eq. 1 with A = 0.63± 0.06 (∀d), but with k in-creasing with the cohesive nature of the material (small grain size, Fig. 4, inset). This might be because the co-hesion is only partially destroyed when the grains flow. Due to the remaining cohesion, grain aggregates, rather than individual grains, flow out through the aperture. In this case, the effective diameter deff of the falling grains is larger than the individual grain diameter d, leading to a smaller effective outlet diameter [ie to a larger value of
k in Berverloo law (1)].
It is particularly interesting to comment here the mea-surements of the flow rate, even if they were not the scope of the present article. Indeed, the fact that the Q is con-stant throughout a silo discharge is not an obvious result. In the litterature, the constancy of Q has been often im-plicitely assumed to be a result of the so-called Janssen effect, a saturation of the pressure at the base of a static silo. Indeed, in this case, the pressure in the outlet region would be constant, independant of the height of material above. Even if the authors generally did not explicitely state that there was a relation between the constancy of the flow-rate and the Janssen effect, they made erro-neously think that the flow-rate was constant because the pressure in the outlet region was constant. Note first that the Janssen effect is a static effect and that there is no reason for the pressure to be constant when the material is flowing. We now know that, indeed, the pressure is not constant during the discharge, as proven by direct mea-surements of the forces exerted by the material on the container [24, 32]. Moreover, in Ref. [32], the authors show that the flow rate is not altered by vibrations of the container that avoid static arching. Independently, it has been proven in a horizontal system (a conveyor belt) that the flow-rate does not depend on the pressure and obeys Beverloo law, the typical velocity at the outlet to consider in this case being the belt velocity instead of the free fall velocity √gD [13]. Our experiment
inter-estingly provides an additional experimental proof of the same assertion, the flow-rate being constant even if the height of the granular column is never larger than the radius of the container. The pressure surely varies
dur-6
ing the discharge but Q is constant and accounted for by Beverloo law. Furthermore, we observe that the cohesion mainly alters, k, thus the typical size of the particles to be considered; the size of grain aggregates rather than the diameter of individual grains.
The physical process leading to the reduction of the flow rate being out of the scope of the present article, we do not discuss further this point and focus now on the dynamics of the crater.
Dynamics of the free surface
For cohesive material, the crater geometry and dynam-ics are noticeably different than those reported for the cohesionless case.
First, we observe a significant delay between the be-ginning of the discharge and the appearance of a crater at the free surface. Because of the cohesion, the mate-rial can sustain a cavity at the vertical of the outlet and the deformation of the free surface result from the gran-ular flow at the bottom only when a significant amount of grains has flown out. Once the crater appears at the free surface, the angle that the lateral slopes make with the horizontal is large (Fig. 8). Note that, as the grains at the lateral slopes are not flowing, the crater angle θc does not correspond to the dynamical angle of avalanche anymore. We also point out that the crater angle does not depend on the diameter D of the outlet. However, contrary to what is observed for non-cohesive grains, the angle depends on the grain size d, i.e. on the cohesion (Table I): From the vertical profiles of the crater (Fig. 8), we obtain, for instance, θc= (88± 2) deg for batch 1 (0 - 45 µm) and θc = (56± 1) deg for batch 2 (45 - 90
µm). In agreement with the expectation of a larger
ef-fect of the cohesion force on the smaller grains, the angle of avalanche significantly increases when the grain size is decreased [31]. From now on, we shall consider the crater angle θc as the quantity accounting for the cohesion.
-6 -4 -2 0 2 4 6
r (cm)
FIG. 8. Vertical profile at various times t – We report the profile of the crater in a vertical plane every 5 seconds. We observe that the slopes on the side are much steeper than in the cohesionless case (Thick lines: grey, profile of the initial surface; black, t = 20 s. Thin lines: from light grey to black, t = 5 s to 15 s . d = 45− 90 µm, D = 6 mm).
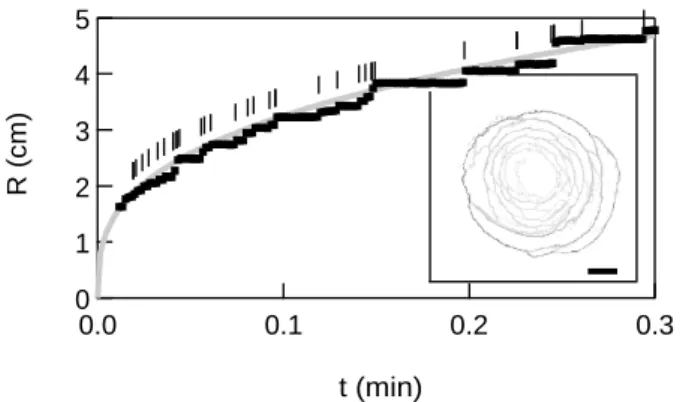
As mentioned above, the crater is no more circular and its growth is due to successive, partial, collapses of the lateral walls. This behavior is clearly revealed by the dy-namics of the contours obtained from the images from top (Fig. 9, inset). The superposition of the contours at several equally-spaced times reveals that the intermittent nature of the discharge. In such an image, in which the superposition of the contours draws a ”flower” at the sur-face, one directly observes that the size of the avalanches and the delay (lines are darker away from the center) be-tween successive events increase with time. In order to report quantitative results, we define the average radius
R of the crater, R≡pA/π, where A is the surface area
of the crater in the horizontal plane. Reporting R as a function of time (Fig. 9), we observe that R increases by jumps, each corresponding to a partial collapse of the lateral wall. Again, the results point out that both the typical size of the avalanches and the delay between them increase thoughout the discharge process. In addition, one observes, in average, the scaling R∝ t1/3, which is compatible with a constant flow-rate and constant angle
θc of the lateral walls.
5 4 3 2 1 0 R (cm) 0.3 0.2 0.1 0.0 t (min)
FIG. 9. Effective radius R of the crater vs time t – The average radius of the crater increases by independant jumps. However, in average, R scales like t1/3. The vertical dashes
mark the avalanche events observed directly in the images [Black dots, experimental data; grey line, Eq. 2 with θc =
56 deg, ρ = 1510 kg/m3and the measured dimensionless
flow-rate Q∗= 1.75]. Inset: superposition of the crater contours in the horizontal plane at different, equally-spaced, times t. The darker the line is, the longer the contour remained at the given position (The scale bar is worth 2 cm. d = 45− 90 µm, D = 6 mm).
Geometrical characterization of the ”flower”
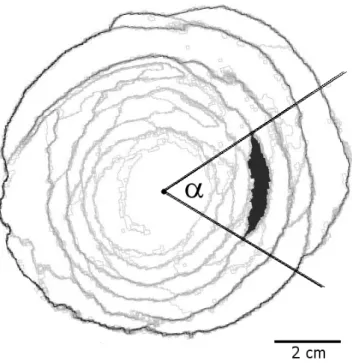
To characterize further the discharge process, we now characterize the geometry of the crater seen from above. In particular, we observe that, during the discharge pro-cess, the typical size (arc length) of the avalanches in-creases with the distance to the center so that one can
consider the angular size of the avalanche, α (the angle that the straight lines joining the centre to the two ends of the avalanche make between them, Fig. 10). Such an analysis is possible only when the material is suffi-ciently cohesive so that one can distinguish individual avalanches, thus for the smallest grains. We thus report results obtained for batches 1, 2 and 3, only.
FIG. 10. Geometrical characterization of the ”flower”
– We determine the angular size α of each of the individual
avalanches (d = 45− 90 µm, D = 6 mm).
We thus consider the distribution of α measured throughout several discharges (typically, 200 to 300 avalanches). We observe that the distributions of α do not depend significantly on the aperture diameter D and report results obtained for D = 6 cm (Fig. 11). The dis-tributions are broad and asymmetric but we note that the typical angular size is significantly larger for the smaller grains. For instance, the experimental results lead to
α = (73±23) deg for d = 0−45 µm and α = (54±17) deg
for d = 45− 90 µm (Fig. 11). For the cohesionless sam-ples such an estimate cannot be obtained whereas for the intermediated case d = 75− 150 µm the individual avalanches can barely be isolated and we can only get an estimate α = 17 deg with an error of about 100 % (Fig. 12). We observe that α → 0 for vanishing small cohesion (θc = 22 deg), which can be understood by considering that the continuous collapse of the walls in this case consists in an infinite number of infinitely small avalanches. 0.25 0.00 p( α ) 120 0 α (deg) 90 60 30 0 α (deg) 90 60 30 0 θc (deg) 4 3 2 1 0 Φ (%) X α Φ
FIG. 11. Angular size α and parameter Φ vs crater
angle θc – The typical angular size of the avalanches, α and
the parameter Φ (Eq. 4) increase significantly with the typi-cal angle θc that the lateral walls make with the horizontal,
thus with the cohesion (The cross indicates θc = 22 deg for
cohesionless batches and the continuous lines are only a guide to the eyes). Inset: Distribution p(α) for d = 45− 90 µm (D = 6 mm).
FIG. 12. Dynamics of the interface for an
interme-diate case – When the sample is almost cohesionless, the
individual avalanches can barely be isolated even if the dy-namics is clearly intermittent. The discharge involves a se-ries of small avalanches that propagate along the crater walls (d = 75− 150 µm, D = 6 mm).
Additional characterization of the discharge dynamics
In order to characterize further the intermittent nature of the discharge, we define an estimate, M (t), of the mass of material that fell down the slopes at time t. To do so, we use the apparent radius R(t) and the angle θc
8
of the crater and write, considering the volume of the corresponding cone,
M = ρπR
3
3 tan(θc). (3)
Then, from the estimated mass M (t) and the actual mass
m(t) that is directly measured with the balance, we
de-fine: Φ = 1 T m2 ∞ Z T 0 [m(t)− M(t)]2dt (4) where T stands for the total duration of the discharge and m∞ for the total mass of material measured after the discharge. The parameter Φ accounts for the inter-mittent nature of the discharge. Indeed, M (t) = m(t) and thus Φ = 0 for a cohesionless material. For cohesive materials, due to the avalanches at the free surface, the temporal fluctuations in R (and thus in M ) are enhanced whereas the flow rate is constant and m increases linearly with time. Thus, Φ is expected to increase with the in-termittent nature of the discharge process and, thus, to account for the cohesion. In the figure 11, we report the experimental values of Φ as a function of the crater angle
θc. We note that, even if it, indeed, increases significantly
for the cohesive sample, Φ gently vanishes for vanishing cohesion: the occurrence of small avalanches observed in the case of batch 3 does not produce any important os-cillation of the estimated mass M (t) and the parameter Φ is not very appropriate to reveal the cohesive nature of the material. The measure of the angular size α is much more efficient for this purpose as it significantly depends on the crater angle θc even for almost cohesionless mate-rials.
DISCUSSION AND CONCLUSION
The experimental results can be summarized as fol-lows: for large enough aperture, the discharge is continu-ous in the sense that the flow rate is constant throughout the discharge. The results holds true in absence or pres-ence of cohesion. However, when the material is (even weakly) cohesive, the dynamics of the free surface is inter-mittent. Instead of an axi-symmetric conical crater, one observes an irregular crater which results from a series of individual avalanches. The typical size of the avalanches increases with the crater size, which permits to define, for a given material, an angular size which increases with the cohesion. These results suggest that there is a geometry-based relation between the angular size of the avalanche and the angle that the crater walls make with the hori-zontal. However, we have not been able to establish this relation theoretically.
In the effort to understand, from the fundamental point of view, the mechanisms governing the discharge of cohesive materials, the present work shall be extended
to measurements of the forces exerted on the base plane and on the wall while tuning the cohesion.
[1] W.A. Beverloo, H.A. Leninger, and J. van de Valde, Chem. Eng. Sci. 15, 260 (1961).
[2] L.P. Kadanoff, Rev. Mod. Phys. 71, 435 (1999). [3] P.G. de Gennes, Rev. Mod. Phys. 71, S374-S382 (1999). [4] V. Trappe, V. Prasad, L. Cipelletti, P. N. Serge, and D.
A. Weitz, Nature (London) 411, 772 (2001).
[5] H. M. Jaeger, S. R. Nagel, and R. P. Behringer, Rev. Mod. Phys. 68, 1259 (1996).
[6] J. Duran, Sands, Powders and Grains (Springer, New York, 2000).
[7] G. H. Ristow, Pattern Formation in Granular Materials (Springer, New York, 2000).
[8] R. M. Nedderman, U. T¨uz¨un, S. B. Savage, and G. T. Houlsby, Chem. Eng. Sci. 37, 1597 (1982).
[9] U. T¨uz¨un, G. T. Houlsby, R. M. Nedderman, and S. B. Savage, Chem. Eng. Sci. 37, 1691 (1982).
[10] S. B. Savage, R. M. Nedderman, U. T¨uz¨un, and G. T. Houlsby, Chem. Eng. Sci. 38, 189 (1983).
[11] B. P. Tighe and M. Sperl, Granular Matter 9, 141 (2007). [12] See, for example, R. L. Brown and J. C. Richards, Trans. 78 Inst. Chem. Eng. 38, 243 (1960), comment on p. 167; H. M. Jaeger and S. R. Nagel, Science 255, 1523 (1992), comment on p. 1527; H. M. Jaeger, S. R. Nagel, and R. P. Behringer, Rev. Mod. Phys. 68, 1259 (1996), comment on p. 1261.
[13] M.A. Aguirre, J.G. Grande, A. Calvo, L.A. Pugnaloni and J.-C. G´eminard, Phys. Rev. Lett. 104, 238002 (2010).
[14] C. Mankoc, A. Janda, R. Arevalo, J. M. Pastor, I. Zuriguel, A. Garcimart´n, and D. Maza, Granular Mat-ter 9, 407 (2007).
[15] C. Mankoc, A. Garcimart´n, I. Zuriguel, D. Maza, and L. A. Pugnaloni, Phys. Rev. E 80, 011309 (2009). [16] F. Ulissi, graduation thesis, Mechanical Engineering,
2008. Facultad de Ingeniera, University of Buenos Aires, Argentina.
[17] R. L. Brown and J. C. Richards, Principles of Powder Mechanics (Pergamon Press, Oxford, 1970).
[18] Z. Fournier et al., J. Phys. Condens. Matter 17, S477 (2005).
[19] M. Scheel et al., Nature Mater. 7, 189 (2008).
[20] K. Taylor, P. J. King, and Michael R. Swift, Phys. Rev. E 78, 031304 (2008).
[21] N. Olivi-Tran, N. Fraysse, P. Girard, M. Ramonda, D. Chatain, Eur. Phys. J. B 25, 217 (2002).
[22] H. Gayvallet and J.-C. G´eminard, Eur. Phys. J. B. 30, 369-375 (2002).
[23] H. Alarc´on, O. Ramos, L. Vanel, F. Vittoz, F. Melo and J.-C. G´eminard, Phys. Rev. Lett. 105, 208001 (2010). [24] H. Ahn et al, Powder Tech. 186, 65-71 (2008). [25] A. Janda et al, Phys. Rev. E 79, 031302 (2009). [26] L. Bocquet, E. Charlaix, S. Ciliberto and J. Crassous,
Nature 396, 735-737 (1998).
[27] S. Nowak, A. Samadani and A. Kudrolli, Nature Physics
1, 50-52 (2005).
[28] W.S. Rasband, ImageJ, U. S. National Insti-tutes of Health, Bethesda, Maryland, USA,
http://rsb.info.nih.gov/ij/, 1997-2009.
[29] H. C. Hamaker, Physica Amsterdam 4, 1058 (1937). [30] R.Y. Yang et al, Phys. Rev. E 78, 031302 (2008). [31] F. Restagno, L. Bocquet, and E. Charlaix, Eur. Phys. J.
E 14, 177-183 (2004).
[32] H. Pacheco-Martinez, H. J. van Gerner and J. C. Ruiz-Surez, Phys. Rev. E 77, 021303 (2008).