HAL Id: hal-01365962
https://hal.archives-ouvertes.fr/hal-01365962
Submitted on 25 May 2020
HAL is a multi-disciplinary open access archive for the deposit and dissemination of sci-entific research documents, whether they are pub-lished or not. The documents may come from teaching and research institutions in France or abroad, or from public or private research centers.
L’archive ouverte pluridisciplinaire HAL, est destinée au dépôt et à la diffusion de documents scientifiques de niveau recherche, publiés ou non, émanant des établissements d’enseignement et de recherche français ou étrangers, des laboratoires publics ou privés.
Distributed under a Creative Commons Attribution - ShareAlike| 4.0 International
Competition between farmed and wild fish: the French
sea bass and sea bream markets
Esther Régnier, Basak Bayramoglu
To cite this version:
Esther Régnier, Basak Bayramoglu. Competition between farmed and wild fish: the French sea bass and sea bream markets. Aquaculture Economics and Management, Taylor & Francis, 2016, Published online (3), pp.21. �10.1080/13657305.2016.1189012�. �hal-01365962�
Competition between farmed and wild fish:
the French sea bass and sea bream markets
Esther REGNIER
∗Basak BAYRAMOGLU
†February 10, 2016
Abstract
Aquaculture is contributing at an increasing rate to world seafood supply. The interaction between fisheries and aquaculture is especially important for the seafood market where supply of wild and farmed fish can affect price dynamics. We examine market interactions in the French fresh sea bass and sea bream markets. We test for long term price parity between farmed and wild products for these two species, applying a bivariate cointegration approach to market delineation. We also conduct the Law of One Price (LOP) test between price series. Our data base consists of monthly domestic price series for fish purchased by French households from 2007 to 2012. Our empirical results show that the fresh fish markets for whole wild and farmed sea bream are partially integrated, while those for whole wild and farmed sea bass are not integrated. The substantially higher price for wild sea bass relative to farmed sea bass suggests that consumers may be more sensitive to seafood production processes when it comes to higher-value species.
Keywords: Market interactions; Sea bass; Sea bream; Farmed fish; Wild fish JEL classification: C32; Q22
∗Universit´e Paris 1 & Paris School of Economics, 106–112 boulevard de L’Hˆopital, 75647 Paris Cedex
13, France. E-mail: esther.regnier@univ-paris1.fr.
†Economie Publique, INRA, AgroParisTech, Universit´e Paris-Saclay, 78850 Thiverval-Grignon, France.
Introduction
Worldwide, an important share of marine fish stocks is under threat. Worm et al. (2009) report that 63% of assessed fish stocks worldwide require rebuilding. FAO (2014) reports that in 2011 about 61.3% of world marine fish stocks were estimated as fully exploited and 28.8% as overexploited. While marine fish production has been marked by a slight decline since the early 1990s, since the early 1980s, aquaculture has been the fastest growing food industry, with annual average growth of 8.6%. In 2012, aquaculture provided 42.2% of global seafood1 production (FAO, 2014). “With the increasing contribution from aquaculture to seafood supply the interactions between fisheries and aquaculture are expected to become even more important and therefore deserve exhaustive investigations from socio-economic and biological perspectives” (Natale et al., 2013, p. 205). These interactions are especially important at the food market where competition between wild and farmed fish species can affect fish price dynamics.2 The international trade in fish products also plays a significant
role in the evolution of fish prices, given that fish and fishery products are among the most intensively traded food commodities worldwide (World Trade Organization).3 Among
agricultural, food, animal and fish products, fish was one of the fastest growing categories between 1990 and 2000, with an increase of 52% in trade value (Anderson, 2003). Between 1976 and 2012, the proportion of globally harvested fish that is internationally traded has increased from 25% (8 million tons) to 37% (58 million tons). At the same time, the value of world exports of fish and fishery products has risen from 62 billion in 2002 to 129 billion in 2011 (Crona et al., 2016). These observations prompted our investigation of whether the expansion in global supply of farmed fish has led to market interactions between farmed and wild fish products in the case of the French sea bass and sea bream markets.
Information on market interactions between farmed and wild fish provides insights into the extent to which farmed fish prices are likely to affect wild fish prices. These outcomes
1Understood as finfish and shellfish production.
2The interactions between fisheries and aquaculture exist also at the biological level since marine fisheries
provide inputs to aquaculture production, i.e. fishmeal and fish oil. These types of interactions are beyond the scope of the present paper.
depend on how consumers perceive wild versus farmed products, but also on the relative cost competitiveness and production quantities of each sector. For instance, farmed fish species regarded as low-value products relative to their wild counterparts, can lead to segmented markets where wild products occupy the high-value segment. This implies a maintained pressure on wild edible resources. On the other hand, if a farmed species is valued at least as much as its wild counterpart, the prosperity of the capture fishery sector will rely on its relative price competitiveness. Finally, the supply chain of each product type may also condition interactions between them.
Since aquaculture takes place in confined area (ponds, pen nets, cages, raceways, ranching, recirculating systems, etc.), this production technology exerts a high degree of control over the attributes of the grown fish. Consumer preferences may determine color, size, texture, fat content and other parameters that make the delivered product more convenient (Asche et al., 2001). Similarly, Knapp et al. (2007) argue that farming has changed the timing of the supply which no longer is necessarily seasonal, and show that the increased availability of farmed salmon has led to increased demand. Sustainability concerns may be another reason for a shift in preference from wild fish to farmed fish. On the other hand, wild products are perceived as healthier, and sometime more tasty, while aquaculture raises environmental concerns as well, which provides some competitive advantage to wild products (Natale et al., 2013). Indeed, there is a growing concern that the dependence of aquaculture production on reduction fisheries, the main source for fishmeal and fish oil, threatens the health of marine ecosystems (Smith et al., 2011; Olsen and Hasan, 2012). From an ethical point of view, a consumer perception study carried out in Europe on the differences between farmed and wild fish revealed that wild fish is preferred for moral concerns: the farmed fish are perceived as unnatural and unfamiliar (Schlag and Ystgaard, 2013).
The valuation of farmed fish should condition the technological evolution of the aquacul-ture sector and affect the manner in which wild fish resources are managed. Indeed, the aquaculture sector strives to find solutions to the limited availability of fishmeal and fish oil4, which are required inputs to sustain the flesh properties of several farmed species. To
date, there is no protein source that simultaneously provides the required properties and is profitable. However, “green”consumers sensitive to the modification to fish diet and the subsequent change in nutritive quality of fish flesh, provide incentives for the aquaculture industry to work out a suitable substitute to natural fish populations. One possibility is for the aquaculture supply to split into a high-quality and low-quality supply, the latter relying on cheaper and nutritionally poorer feed.
Our aim is to examine whether the fish production process is a significant attribute in con-sumers’ fish consumption choices, at given species. We test for market integration between farmed and wild products in France, focusing on the cases of sea bass and sea bream species. Market integration is an indicator of the degree to which different markets are related to each other. Our empirical approach relies on the Law of One Price (LOP) and the concept of cointegration which consists of testing for price parity between wild and farmed fish prod-ucts. Our data consists of domestic (monthly) price series provided by Kantar WorldPanel5 for fish species consumed by French households from 2007 to 2012.
The importance of the sea bass and sea bream markets at European level makes a focus on these species interesting. After Atlantic salmon, sea bass and sea bream taken together represent the largest production of farmed finfish species in Europe (FEAP, 2015). As pointed by the FAO Future prospects for fish and fishery products (2008), among species for which there has been an attempt to develop an aquaculture industry in recent years, only the culture of seabass and seabream has been a strong commercial success. Aquaculture is in fact the main production method of these two species. The EU accounts for two-thirds of world aquaculture production of sea bass and sea bream, followed by Egypt in the case of farmed sea bass, and Turkey in the case of sea bream. Although most sea bass comes from aquaculture, capture fisheries account for more than 10% of total sea bass production worldwide. The EU accounts for 83% of world sea bass capture — with France accounting for 60% of this total — and 32% of the world sea bream capture – with France and Spain together accounting for 74% of this total (EC DG for Maritime Affairs and Fisheries, 2009).
fishmeal and fish oil in the form of compounded feed pellets providing nutrients and different supplements to farmed fish.
France is a relevant case to analyze market interactions between farmed and wild sea bass and sea bream products. It is the third intra-EU importer of farmed sea bass and sea bream, it has a domestic production of both farmed species, while the extent of its domestic catch satisfies national consumption of wild sea bass and sea bream. Some 50% of French consumption of sea bass and around 90% of sea bream are farmed (FranceAgriMer, 2011). Market interactions between fisheries and aquaculture have been investigated from a the-oretical and empirical point of view. The thethe-oretical findings indicate that the effects of aquaculture development on fish stock and welfare depend on the degree of substitution between wild and farmed species and on the management regime (see Anderson, 1985; Ye and Beddington, 1996; and Valderrama and Anderson, 2010).
There are numerous empirical fish-specific and country-specific studies examining which fish attributes influence consumer choice. Many of these studies focus on salmon, and use the concept of cointegration to analyze market integration among different species and different geographic areas, or to test whether consumers distinguish between the origin, form or production process of fish products (Gordon et al., 1993; Asche and Sebulonsen, 1998; Asche et al., 1999; Clayton and Gordon, 1999; Asche, 2000; Jaffry et al., 2001; Asche et al., 2005). In the case of salmon, several studies report a highly integrated market for wild and farmed products (Asche et al., 2001; Asche et al., 2005; Knapp et al., 2007). A relatively integrated market has been demonstrated for white fish (Asche et al., 2002 and Nielsen, 2005) as well as for some other fish species (Nielsen et al., 2007; Norman-Lopez, 2009). In the case of shrimp, Asche et al. (2012) report a perfectly integrated market for US wild caught shrimp and imported farmed shrimp. The evidence on market integration seems to indicate that “farmed species competes mainly with the same wild species (and other species in the same segment), but not with other species” (Asche et al., 2001, p.311).
In the case of sea bass and sea bream, empirical analysis is scarce (Asche et al., 2001), despite the considerable trade flows they generate in the EU. To our knowledge, only two studies investigate market integration between wild and farmed sea bass and sea bream. Brigante and Lem (2001) find no evidence of a price link between farmed and wild species in the case of sea bass and sea bream in the Italian market. Rodriguez et al. (2013) find that the price
series of farmed and wild gilthead sea bream at the Spanish market are not cointegrated. In contrast, we find that, in France, there is a partial market integration between fresh whole wild and farmed sea bream while this does not apply to fresh whole sea bass. These results are obtained using a bivariate cointegration framework, complemented by a LOP test for these fish species to check whether their markets are perfectly integrated. These overall results indicate that for sea bass and sea bream, farmed species do not necessarily compete with their wild counterpart.
The article is organized as follows: first we describe the main characteristics of the French sea bass and sea bream markets, present the data as well as the econometric methodology, followed by the estimation results and their discussion, and finally the concluding remarks.
The French sea bass and sea bream markets
Sea bass is a demersal white fish which originates in the Eastern Atlantic, and the Mediter-ranean and Black Seas. France, the UK, Italy, Turkey and Egypt have significant sea bass fisheries. Sea bream is also a demersal white fish found in the Atlantic Ocean and the Mediterranean sea, but commercial harvests are small. The main Mediterranean stocks of sea bream are actually considered to be overfished (FAO, 2014).
Tables 1 and 2 infer from trade flows annual French consumption of sea bass and sea bream, in volume, between 2008 and 2012 (i.e. the time frame relating to our data set). The data refer to all types/forms of product (frozen, canned, filleted, whole, etc.) and all varieties of sea bass and sea bream species. In 2008-2012, average French national consumption of sea bass was 10,249.12 tons compared to 13,154 tons for sea bream. According to FranceAgriMer (2011), about 50% of French consumption of sea bass and 90% of French consumption of sea bream is farmed.6
French aquaculture production is not expected to increase due to land ownership and legal issues that restrict the availability of sites. Both species studied are increasingly supplied
6It was not possible to obtain the share of wild and farmed fish within the import and export statistics
Table 1: French consumption of sea bass in tons
Sea bass (in tons) 2008 2009 2010 2011 2012 % Change (2008/2012) Wild catches 3279 5566 6129 5535 5081 55 Farmed production 4163 2877 2337 2452 2321 -44 Imports 4525.3 4906.5 5507.1 5626.2 5578.8 23 Exports 3869.7 2974.3 2831.1 2597.5 2365.7 -39 Consumption 8097.6 10375.2 11142 11015.7 10615.1 31
Data source: Eurostat.
Table 2: French consumption of sea bream in tons
Sea bream (in tons) 2008 2009 2010 2011 2012 % Change (2008/2012) Wild catches 2795 5285 5725 5126 3520 26 Farmed production 1182 1278 1239 1412 1316 11 Imports 8340.2 9474.5 9055.4 8461.9 10492.2 26 Exports 1784 1973.6 1925.8 1622.2 1626.5 -9 Consumption 10533.2 14063.9 14093.6 13377.7 13701.7 30
Data source: Eurostat.
by aquaculture operations, mostly in the Mediterranean Sea. The rapid expansion in the production of these species in the early 1990s was driven by increased aquaculture in Turkey and Greece. Nowadays, intra-EU trade of these species is substantial, with Greece a major exporter of sea bass to Italy, the UK and France, and sea bream to Italy, Portugal and France. With the exception of sea bream imports from Turkey, trade between the EU and third countries is limited. Juveniles are produced on increasingly large scales in hatcheries, and availability is no longer a constraint on the industry. Since domestic aquaculture production is limited in France, any consumption rise has to be covered by imports (FAO Globefish, 2009).
In 2011, France registered the fifth largest per capita consumption of fish and seafood (34,6 kg) in the European Union, and the third highest level of household expenditure on aquaculture and fisheries products in 2013 (Eumofa, 2015). Among fresh finfish household consumption in 2012, sea bass was ranked 7th in value (e56,456k) and 10th in volume (3,784
tons), and sea bream was ranked 8th in value (e49,415k) and 8th in volume (4,328 tons).7
The highest ranked species for value and volume are salmon and cod.
The data set
Our data set is provided by Kantar WorldPanel.8 It reports aggregate monthly home con-sumption of fresh fish in a sample of French households. The time series data cover the period January 2007 to September 2012 (69 points). The category of fresh products includes prod-ucts sold by large retailers, supermarkets, fishmongers, markets and grocery stores. The analysis does not include other product forms (i.e. transformed products, frozen or canned fish consumption) since Kantar WorldPanel data do not distinguish between farmed and wild for these product types.
Our empirical analysis focuses on sea bass and sea bream fish species9, for which we have information on fish-specific quantities consumed (in kg), fish-specific prices (euros/kg), pro-duction mode (farmed/wild) and form (whole/cut). Fresh products constitute 33.3% of household seafood expenditures (FranceAgriMer, 2011). Since farmed fish are sold mostly in fresh products forms (EC DG for Maritime Affairs and Fisheries, 2009), this data set provides a good base for investigating market integration between farmed and wild fish species.
The French household sample surveyed by Kantar WorldPanel is updated weekly and in-cludes 20,000 households assumed to be representative of the French population (based on
7The figures in brackets combine wild and farmed fish consumption and represent the value of total
consumer purchases for each species in France in 2012, estimated by FranceAgriMer based on Kantar WorldPanel data.
8Kantar WorldPanel: www.kantarworldpanel.com.
9There are several varieties of sea bass and sea bream species, which are aggregated in our time series
data. The sea bass and sea bream varieties included in our study and their main capture zones (source: FishBase) are: sea bass species Dicentrarchus labrax (Eastern Atlantic, Mediterranean and Black Sea) and Anarhichas lupus (Northeast Atlantic, Northwest Atlantic, Baltic Sea and Northwestern Mediterranean) -the only farmed species is Dicentrarchus labrax sea bass; sea bream species Sparus aurata (Nor-theast At-lantic, northern Mediterranean and Black Sea), Spondyliosoma cantharus(Eastern AtAt-lantic, Mediterranean and the Black Sea), Pagellus bogaraveo (Eastern Atlantic and Western Mediterranean), Coryphaena hip-purus (Atlantic, Indian and Pacific), Sebastes mentella (Western and Eastern Atlantic), Sebastes marinus (Western and Eastern Atlantic) and Lithognathus mormyrus (Eastern Atlantic, Mediterranean, Western Indian Ocean) – the main farmed species is Sparus aurata.
demographic criteria defined by INSEE). Within the sample, the yearly respondent replace-ment ratio is 25%. About 12,000 of the surveyed households declare non-bar coded fish product purchases, that is, fresh fish products. We focus on this data subset. Note that only species for which at least 2% of households are buyers are considered as significant and recorded by Kantar WorldPanel. Kantar surveys are based on voluntary declarations by households. Therefore, Kantar WorldPanel measures of aquatic product purchases by French households are not exhaustive. Taking all fish and fish products together, this panel is estimated to represent 80% of total French seafood consumption (FranceAgriMer, 2011). The data set shows that, on average, over the period January 2007 to September 2012, 31.3% of fresh sea bass and 40.5% of fresh sea bream consumed by households in France is farmed. Between 2007 and 2012, we observe a shift in the share of farmed sea bass consumption from 27.13% to 36.5%, while the share of sea bream remained steady at around 40%. Since the available time series are for household consumption of fresh sea bass and sea bream, it is inevitable that these figures do not match the figures for total national consumption reported earlier, that is, 50% for farmed sea bass and 90% for farmed sea bream. Furthermore, since the Kantar WorldPanel data set is based on households’ consumption recollection, on average, 20% of fresh sea bass consumption reported, the distinction farmed/wild is not available, compared with 30% for fresh sea bream. However, this does not represent a limit on our empirical analysis since the methodology we apply only requires information on the price of seafood products to test for market integration.
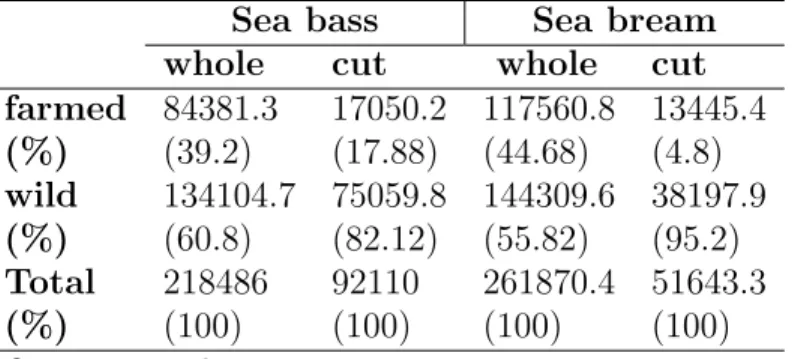
Detailed consumption statistics are reported in Table 3. We focus our analysis on whole products rather than cut forms since 63.4% of fresh sea bass and 80.3% of fresh sea bream are sold whole. These figures are in line with the 2004 report for the European Commission (Roth and Ukendt, 2004) on sea bass and sea bream markets which states that both species are mostly sold as fresh and whole fish.
Table 4 presents the average prices of fresh sea bass and sea bream, by product form and production process, consumed between January 2007 and September 2012 by the French households included in our data set. Figure 1 in Appendix A.1 plots the different pairwise price (in log) dynamics for which we test for market integration.
Table 3: Average share of fresh sea bass and sea bream consumption in France by product type: January 2007–September 2012
Sea bass Sea bream whole cut whole cut farmed 84381.3 17050.2 117560.8 13445.4 (%) (39.2) (17.88) (44.68) (4.8) wild 134104.7 75059.8 144309.6 38197.9 (%) (60.8) (82.12) (55.82) (95.2) Total 218486 92110 261870.4 51643.3 (%) (100) (100) (100) (100) Quantities in kg.
Data source: Kantar WorldPanel.
To enable a market delineation approach, price series have been deflated using the OECD monthly consumer price index for food (base year 2005). Over our observation period, the sea bass price is e12.55/kg and the sea bream price is e9.93/kg. Hence, sea bass is a higher-valued species relative to sea bream. Cut products are always more expensive since price is affected by the cost of labor. Also, the price per kg of whole fish is discounted by the weight of waste (bones, skin, etc.).
Table 4: Average price of fresh sea bass and sea bream in France by product type: January 2007–September 2012
Sea bass Sea bream farmed wild farmed wild whole 9.28 14.24 8.29 10.3
(0.13) (0.18) (0.12) (0.15) cut 13.18 14.29 11.26 13.9
(0.33) (0.22) (0.31) (0.19) average 10.6 14.26 8.59 11.02
Prices in e/kg. Standard errors are shown in parentheses. Data source: Kantar WorldPanel.
Wild products always have higher economic value. Focusing on the whole product form, the mean price of wild sea bass is statistically higher than that of farmed sea bass, at the 5% level, as for sea bream (see Table 10 and 11 in Appendix A.1). The price difference between the wild and farmed products is 54% for sea bass against 24% for sea bream.
With the exception of salmon whose market story is rather unique10 (Knapp et al., 2007),
the empirical evidence shows higher prices for wild compared to farmed products for given species (FranceAgriMer, 2012). In the case of sea bass and sea bream, their smaller fillet size makes marketing innovations less applicable. As already mentioned, farmed supply of both species has increased in recent years in the Mediterranean. However, the effect on market prices of this increased supply is different for each species. Sea bream prices have fallen drastically while sea bass prices have remained stable (FAO, Globefish, 2009). Thus, some producers are suffering considerably because of reduced margins. According to the FAO, over time, markets will be able to absorb larger production volumes but more stable equilibrium prices will require more product innovation and the development of additional markets in the long run.
Empirical methodology
Stigler (1969) defines the market for a good as “the area within which the price of a good tends to uniformity, allowance being made for transportation costs”. When the LOP holds, that is, when there are no opportunities for arbitrage between identical goods, markets are said to be perfectly integrated. If in the long run, the prices of identical goods differ by more than transportation costs, this is a sign of an inefficient market.
For prices in logarithms, Broad and Weinstein (2008) refer to the relative LOP, in contrast to the absolute LOP defined by Stigler (1969). In this case, the LOP tests whether a shift in the price of one good results in the same percentage variation in the price of the other good, meaning their relative price remains constant. Under the condition that variables are stationary, relative LOP can be tested by running a simple OLS regression:
ln(P1t) = B + Aln(P2t) + εt, (1)
10Salmon is the aquaculture species produced at the largest scale worldwide, which enabled to accustom
consumers to this species. The strong market development of farmed salmon was made possible, inter alia, by a preexisting demand in several countries, and by the fact that salmon delivers large fillets, allowing for product differentiation and innovation, thus enlarging the consumer base for this species.
where Pit is the price of good i = 1, 2, at time t. The coefficient A corresponds to price
elasticity between both goods, and B is a constant term. If A = 0, then there is no relationship between these two goods. If A = 1, then the relative LOP holds. In the remainder of this paper, the acronym LOP refers to this relative definition.
However, time series displaying stochastic evolutions may be incidentally correlated, leading to significant coefficients although the prices of the goods under scrutiny are not related. This phenomenon produces what is commonly called a spurious regression. Several tests exist to identify the order of integration of a time series, including the Augmented Dickey-Fuller (ADF) unit root test11 and the Kwiatkowski-Phillips-Schmidt-Shin (KPSS) test.12
Since the inferences derived from these two tests are complementary, we choose to rely on both of them in this study.
In the event that variables are non-stationary, a cointegration analysis is required to in-vestigate the relationship between time-series. In this study, the concept of cointegration allows us to identify whether price series have similar stochastic trends and whether there is a stable long run relationship between them, revealing the existence of a price parity condition. In this case, we can infer that markets display a level of integration. The notion of market integration can apply to any type of related markets and all levels of market interdependencies may be observed.
The cointegration approach to market delineation is convenient in the sense that only price series are required. The drawback is that this method provides less precise information on the relationship between markets. It can show whether two goods display constant relative prices in the long run but not the degree of substitutability between them. However, Asche et al. (1997) perform a cointegration test for market delineation and estimate a dynamic system of demand equations on the same data set. They find that both approaches provide compatible and complementary results. As mentioned in Section , since we do not have reliable information on quantities or household attributes, we adopt the cointegration approach to analyze market interactions between wild and farmed fish.
11The appropriate critical values applying to the Augmented Dickey-Fuller test are tabulated in Engle
and Yoo (1987) and McKinnon (1991).
Consider two price variables, p1tand p2t, where lower case letters refer to natural logarithms.
Assuming p1t and p2t are I(1), then the vector pt =
p1t p2t is said to be cointegrated if there exists a unique nonzero (2 × 1) vector β, such that:
zt= β0pt→ I(0), (2)
with β0 = [1, −β] the cointegration vector, and zt the residual which measures the
equilib-rium error.
In this bivariate context, testing for LOP consists of controlling whether the coefficients of the cointegration vector sum to zero, that is β0 = [1, −1]. This can be performed by applying a likelihood-ratio test of restrictions on the parameters in β. While cointegration identifies market boundaries, LOP specifies market inter-dependencies (Nielsen, 2005). If the pairwise cointegration test reveals a common stationary trend and the LOP test is validated, then the relative price of the goods is constant and markets are perfectly integrated in that sense. If the pairwise cointegration test reveals a common stationary trend but the test for LOP is rejected, then the markets are partially-integrated. Finally, if no common stationary trend is found, the goods belong to different markets.
The concept of cointegration can be generalized to n variables, as long as they are I(d) processes, with d > 0. The existence of cointegration vectors requires that the linear com-bination of the n variables is I(d − b). Johansen (1988) developed a multivariate approach of cointegration based on a maximum likelihood estimator, to identify the number of coin-tegration relations between n variables studied simultaneously. This approach appeals to a vector autoregressive (VAR) model in error correction (ECM) form (Bourbonnais, 2009):
∆pt= A0+ B1∆pt−1+ B2∆pt−2+ · · · + Bl−1∆pt−l+1+ πpt−1+ εt (3)
where the residual series are εt ∼ i.i.d and they are normally distributed with mean 0, A0
a vector of dimension (n × 1), matrix Bi are functions of matrix Ai of dimension (n × n),
and π =
l
P
i=1
adjustment parameters and β is a vector containing the coefficients of the long run relation between variables.
Each independent linear combination in π corresponds to a cointegration vector. Thus, if the rank of matrix π is between between 1 and n, then there exist r cointegration relations. A rank of π equal to n implies that all variables are I(0), a rank equal to 0 implies that none of the linear combinations between time series are stationary. Johansen (1995) proposes the trace test to identify the rank of π. It works by successively excluding hypothesis about the value of r. Initially, the null hypothesis H0 : r = 0 is tested against H0 : r > 0. If H0 is
rejected, the same alternative hypothesis is tested for r + 1, and so on until H0 is accepted.13
To conduct a bivariate cointegration test between the prices of wild and farmed fish, follows an explicit expression of the VECM we estimate as:
∆p1t = a10+ b 1 1∆p1t−1+ b12∆p2t−1+ · · · + b12l∆p2t−l+ α1(p1t−1− βp2t−1) + ε1t ∆p2t = a20+ b 2 1∆p1t−1+ b22∆p2t−1+ · · · + b22l∆p2t−l+ α2(p1t−1− βp2t−1) + ε2t. (4)
Empirical results
The first step in tackling market integration between goods is to examine whether price series are non-stationary in level form. Table 5 reports the results of the ADF test for the price series of interest for our analysis. In each case, the test statistic in column 1 is obtained after selecting the most appropriate specification among the three models underlying the ADF test, including number of lags.14 For all price series, test statistics are greater than
the critical values reported in column 2, implying that there exists a unit root, that is, the null hypothesis of non-stationarity is not rejected at the 5% significance level. Column 3
13Critical values for these tests can be found in Johansen and Juselius (1990).
14For each variable, we test whether a constant term, a trend intercept or no constant at all improves
the explanatory power of the specification. We resort to the Akaike Information Criterion (AIC) and the Bayesian Information Criterion (BIC) for selecting the number of lags.
Table 5: ADF tests for unit roots in price series of fish
Prices in log Test stat. Critical Test stat. Critical level value ( 5%) first-diff. value ( 5%) Whole farmed sea bass 0.18 -1.95 -6.05* -1.95
Whole wild sea bass -2.48 -2.92 -4.17* -1.95 Whole farmed sea bream -2.69 -2.92 -5.86* -1.95 Whole wild sea bream -0.15 -1.95 -5.13* -1.95
*Statistically significant at the 5% level.
Table 6: KPSS tests of stationarity over price series of fish Prices in log Test stat. Test stat.
level first-diff. Whole farmed sea bass 0.21* 0.07 Whole wild sea bass 0.16* 0.04 Whole farmed sea bream 0.24* 0.06 Whole wild sea bream 0.14** 0.02
Note: *Statistically significant at the 5% level. **Statistically significant at the 10% level. Critical value at the 5% level: 0.15.
Critical value at the 10% level: 0.12.
shows that for all price series in first-differences, the null hypothesis is rejected at the 5% significance level.
The results of the KPSS test (Table 6) show that for almost all price series, the null hy-pothesis of stationarity is rejected at the 5% significance level. For whole farmed sea bream, the null hypothesis is rejected at the 10% significance level. The results of the two tests converge. Evidence of non-stationarity in level, and stationarity in first-difference, allows us to conduct cointegration tests on these variables.
The results of the pairwise cointegration tests between wild and farmed sea bass, and wild and farmed sea bream are displayed in Table 7. The first column in Table 7 provides the value of the trace statistics for testing the null hypothesis of no cointegration vector. Similarly, the second column reports the value of the trace statistics for testing the null hypothesis that there is at most one cointegrating vector. In the case of sea bass, the trace test accepts the null hypothesis of no cointegration between price series. This result indicates the absence of a long term price parity condition between wild and farmed sea
Table 7: Within species bivariate Johansen tests between wild and farmed fish Rank=0 Rank=1 LOP test
Prices in log (Whole fish) Trace statistic LR p-value Sea bass: farmed/wild 9.69* 0.03
Critical value at the 5% level (12.53) (3.84)
Sea bream: farmed/wild 21.34 6.10* 4.59 0.03 Critical value at the 5% level (19.96) (9.42)
Note: *Statistically significant at the 5% level.
Table 8: Sea bream model: the estimated cointegration vector Coefficient
βwild 1
βf armed -0.23
constant -1.83
bass. In other words, the markets for these two fish products are not integrated.
We proceed to the Gregory-Hansen residual-based test for cointegration in the presence of a regime shift, between the prices series of wild and farmed sea bass, to control for whether the cointegration relation between these prices is marked by a break. At new, we find no evidence of cointegration.
In the case of sea bream, the trace test rejects the null hypothesis of no cointegration vector while the null hypothesis of at most one cointegration vector is accepted at the 5% significance level. Hence, wild and farmed sea bream display a long run price parity condition. The last column of Table 7 reports the results of the LOP test for wild and farmed sea bream. The test results indicate that the LOP does not hold. The null hypothesis, H0 : [βwild, βf armed] = [1, −1], imposing restrictions on the long-run parameters is rejected
at the 5% significance level. This means that wild and farmed sea bream markets are partially integrated (i.e., goods are imperfect substitutes). Table 8 reports the estimate of the long-run relation between wild and farmed sea bream, normalized to the price of wild sea bream.
param-Table 9: Sea bream model: adjustment parameters Coefficient Std. Err. p-value αwild -0.79 * 0.21 0.00
αf armed -0.14 0.17 0.42 Note: *Statistically significant at the 5% level.
eters, α, of a VECM. It enables to identify whether the cointegration relation is led by one of the commodities, by testing the null hypothesis H0 : α = 0. If H0 is accepted for one of
the model equations, the associated dependent variable is said to be weakly exogenous. The estimates of the adjustment coefficients for the VECM between farmed and wild sea bream are reported in Table 9.15 We observe that α
wildis significant at the 5% level while not
αf armed. This implies that the price of farmed sea bream is weakly exogenous; its evolution
is not influenced by that of wild sea bream.
Discussion
We interpret the outcomes of the bivariate Johansen tests as follows. The existence of a cointegration relation between the price series for wild and farmed fish explains a certain degree of the substitutability between them. Indeed, since the structure of production costs of the aquaculture and fish capture industries are quite different, we consider it reasonable to assume that market integration between both fish products stems from the demand behavior of consumers rather than from spillover effects of common supply factors.
In the case of sea bass and sea bream farming, feed, juveniles and labor account for around 70% of production costs16, of which about 35% is for fish feed (Roth, and Ukendt, 2004).
Feed costs are affected mainly by factors such as growth in import demand and the soybean price (FAO, Globefish, 2013). In the case of fisheries, capital investment and operational
15The adjustment parameter labeled α
wild(resp. αf armed) intervenes in the equation where the dependent
variable is wild sea bream (resp. farmed sea bream).
16Fuel and energy consumption represents about 1% of total costs in Greece against 6% in France.
Typically, this expense is for running seawater pumps, oxygenation and other machinery, vehicles, boats and refrigeration plant.
costs are the main costs. Operational costs include labor costs, running costs17 and vessel
costs. In France, 80%-90% of sea bass and sea bream catches are from trawling. Running costs represent about 30% of demersal fish trawlers’ total costs (FAO, 2005).
In the absence of cointegration between two price series, we do not rule out the possibility that the demand for each product interacts. Supply side characteristics may account for this outcome. Precisely, in a competitive market, if consumers consider wild and farmed fish of the same species as perfect substitutes, then both product prices should equalize (allowance being made for transportation costs), otherwise the less competitive sector would be ousted. If prices do not equalize, this might mean that both commodities are imperfect substitutes, which does not preclude the possibility of a price parity condition. If no price parity condition is found then either the farmed and wild fish are not substitutes, or the wild and farmed fish markets are not efficient. Asche et al. (2001) argue that the relative market share of each type of product is important for price adjustment mechanisms. That is, each product type needs be available on average to enable consumer arbitrage between them.
The fresh whole sea bream market
The results of the LOP test have shown that the whole farmed and wild sea bream mar-kets are partially integrated (Table 7). Based on the difference in the costs of aquaculture and capture fishery, we can conclude that these products display a certain degree of substi-tutability. Partially integrated markets mean that wild and farmed sea bream are imperfect substitutes. The wild fish benefits from a price premium (survey average price of whole wild and farmed sea bream: e10.3/kg against e8.29/kg), indicating a relatively higher willingness to pay for this product.
Consumer preference towards fish and seafood products has given rise to a number of qual-itative and quantqual-itative studies (see Carlucci et al. (2015) for a systematic review of the literature). Few studies focus on consumer purchasing behavior towards wild and farmed
fish. As Bronmann and Asche (2015, p. 2) note “Meanwhile, there are competing arguments about consumers’ preferences for either aquaculture or wild products, which requires empir-ical testing”. The available empirempir-ical tests seem to indicate a consumer preference in favor of the wild product rather than the farmed one (see for instance Polymeros et al., 2015).18 This is especially true for older consumers and people living in coastal areas (Carlucci et al., 2015). Based on a survey conducted in Spain, Claret et al. (2014) report that wild product is perceived to have a better overall quality by 60% of respondents, while the reverse is true for 26% of them. In the case of France, Nguyen et al. (2015) have applied a labeled choice experiment for fresh seafood products in a retail market. They have found that consumers’ preference for wild caught seafood over the farmed alternative is significant for the majority of the species considered. The fish species which are associated with a high price premium for the wild caught attribute are sea bream, salmon, and cod (note that sea bass is not considered in this study). This outcome supports our finding that wild and farmed sea bream are imperfect substitutes in the fresh fish market in France.
The results of the weak exogeneity test have shown that the price of farmed sea bream is not influenced by his wild counterpart. Even though the power of this test is probably not very strong because of the short sample, it provides useful information. It indicates that aquaculture is the price-leading production sector in the French fresh whole sea bream market. This could then imply that wild sea bream incurs a downward price pressure from farmed sea bream. The positive consequence of downward pressure on the wild sea bream price is that it may reduce pressure on sea bream stocks, allowing supply to increase. It may also push fisheries to undertake an economic rationalization of the industry. Market competition would hence benefit to consumers.
However, fishermen rarely target a single species. A lower profitability of wild sea bream due to harsh price competition from the aquaculture sector may lead fishermen to report fishing pressure on other fish species within their catch bundles. Although aquaculture production could alleviate pressure on a given wild species, it is not possible to qualify and quantify the
18There is an exception in the case of frozen fish market in Germany. Bronnmann and Asche (2015)
report that German consumers give a higher price premium to aquaculture products, namelye0.28 per 100 g on average.
net effect of farming on ecosystem sustainability owing to the numerous linkages between inherent species.
The fresh whole sea bass market
The empirical results in Table 7 indicate that wild and farmed sea bass markets are not integrated. Markets for fresh sea bass and sea bream differ in that: (1) wild sea bass is valued higher than wild sea bream on average; (2) the price differential between wild and farmed sea bass is more important, than that between wild and farmed sea bream; (3) the market shares of wild versus farmed fish are better balanced in the case of sea bream. The absence of cointegration between farmed and wild sea bass may relate to consumers’ sensitivity to the fish production process in the case of higher-value species, but it may also relate to supply features that prevent market interactions between the sea bass production arising from aquaculture and capture fisheries.
Regarding the last assumption, the data exposed in Section show that the average share of farmed sea bass in French households’ consumption between 2007 and 2012, is 31.3% (all forms of the product included). Assuming our quantity figures are accurate, we posit that this share is reasonable enough to consider the possibility of market interaction between fresh farmed and wild sea bass. Nevertheless, the share of farmed fish in household consumption of whole sea bass increases over the period, meaning that the balance between farmed and wild sea bass has improved recently. The monthly price series covering January 2007 to September 2012 might be too short to reveal market integration between these two fish products. Furthermore, the supply of farmed and wild sea bream, whose price series are cointegrated, is better balanced (i.e. 40.5% of fresh sea bream consumed by households in France is farmed over our observation period).
On the other hand, supposing the supply of fresh farmed and wild sea bass is efficient, the absence of market integration between both fish means that the production process attribute prevails over species type attribute in the consumer’s purchasing decision. If this is the case, production process produces a separation in the French whole sea bass market, with wild
fish occupying the high-value segment. The significant price differential between wild and farmed fish may then reflect a negative perception of aquaculture practices by consumers relatively to that of fisheries. In this case, our results would support the findings of the literature which indicate a consumer preference in favor of wild product rather than the farmed one.
Conclusion
In this study, we tested for price parity between farmed and wild fish, in their whole form, in the French fresh sea bass and sea bream markets. We applied a bivariate cointegration framework to conduct our empirical analysis. We also conducted the Law of One Price (LOP) test between price series in order to check whether the markets were perfectly in-tegrated. Our data provide monthly domestic price series for fish purchased by French households from 2007 to 2012.
Our main empirical results show that the fresh fish markets for whole wild and farmed sea bream are partially integrated, while the markets for whole wild and farmed sea bass are not. The substantially higher price of wild sea bass relative to farmed sea bass, suggests that consumers may be more sensitive to the seafood production process in the case of higher-value species. In contrast, in the case of whole sea bream, the production process does not prevent fish substitutability, although imperfect. This could be due to the fact that consumers purchasing lower value fish are less discerning about flesh property. If this is the case, the results of our analysis are in line with Natale et al. (2013) who argue that interactions between wild and farmed products are likely to become more common, particularly in lower price aquaculture segments, as the production of newer aquaculture species expands to a level capable of conditioning the market.
The absence of competition between wild and farmed fish products in the French sea bass market allows fishermen to earn short-term rents. However, rents may not be sustained if vessels’ entry and fishing pressure is not limited. Quaas and Requate (2013)
demon-strate that the inelastic demand behaviors resulting from consumers preference for seafood diversity is likely to cause sequential collapse of fish stocks under open-access fishery. Acknowledgments. The authors acknowledge the support of the French National Re-search Agency (ANR) under the CLEANER project (ANR-NT09-505778). This reRe-search was also supported by the European Union’s Seventh Framework Programme FP7/2007-2011 under Grant Agreement n◦290693 FOODSECURE (see GA Article II.30). The authors only are responsible for any omissions or deficiencies. Neither the FOODSECURE project and any of its partner organizations, nor any organization of the European Union or Euro-pean Commission are accountable for the con-tent of papers in this series. The authors thank the participants of Bioecon Conference (September 2014), Agricultural Economics Society Annual Conference (April 2014), the environmental economics seminar at PSE, Paris (De-cember 2013), and the seminar at the UMR Economie Publique, INRA (De(De-cember, 2013) for their helpful comments. Any errors are the responsibility of the authors.
References
[1] Anderson, J. L., (1985). Market interactions between aquaculture and the common-property commercial fishery, Marine Resource Economics, Vol. 2(1), 1-24.
[2] Anderson, J. L., (2003). The International Seafood Trade, Cambridge: Woodhead Publishing.
[3] Asche, F., Salvanes, K. G. and Steen, F., (1997). Market delineation and demand structure, American Journal of Agricultural Economics, Vol. 79(1), 139-150.
[4] Asche, F. and Sebulonsen, T., (1998). Salmon prices in France and the UK: Does origin or market place matter?, Aquaculture Economics & Management, Vol. 2(1), 23-30.
[5] Asche, F., Bremnes, H. and Wessells, C. R., (1999). Product aggregation, market integration, and relationships between prices: An application to world salmon markets, American Journal of Agricultural Economics, Vol. 81(3), 568-581.
[6] Asche, F., (2001). Testing the effect of an anti-dumping duty: the US salmon market, Empirical Economics, Vol. 26(2), 343-355.
[7] Asche, F., Bjorndal, T. and Young, J., (2001): Market interactions for aquaculture products, Aquaculture Economics & Management, Vol. 5(5-6), 303–318.
[8] Asche, F., Gordon, D. V. and Hannesson, R., (2002): Searching for price parity in the European whitefish market, Applied Economics, Vol. 34(8), 1017-1024(8). [9] Asche, F. and Tveters, S., (2004). On the relationship between aquaculture and
reduction fisheries, Journal of Agricultural Economics, Vol. 55: 245E65.
[10] Asche, F., Guttormsen, A. G., Sebulonsen, T. and Sissener, E. H., (2005). Competition between farmed and wild salmon: the Japanese salmon market, Agricul-tural Economics, Vol. 33, 333-340.
[11] Asche, F., Bennear, L. S., Oglend, A. and Smith, M. D., (2012). US shrimp market integration, Marine Resource Economics, 27(2), 181-192.
[12] Bourbonnais, R. Econom´etrie, 7e ´edition Dunod, Paris, 2009.
[13] Brigante, R. and Lem, A., (2001). Price interaction between aquaculture and fishery, Working paper, XIII EAFE Conference, Salerno, April 2001.
[14] Broda, C. and Weinstein D. E.,(2008). Understanding international price differ-ences using barcode data, NBER Working Paper No. 14017.
[15] Bronnmann, J. and Asche, F., (2015). The value of product attributes, brands and private labels: an analysis of frozen seafood in Germany, Journal of Agricultural Economics.
[16] Carlucci, D., Nocella, G., De Devitiis, B., Viscecchia, R., Bimbo, F., & Nar-done, G., (2015). Consumer purchasing behavior towards fish and seafood products. Patterns and insights from a sample of international studies, Appetite, 84, 212-227. [17] Claret, A., Guerrero, L., Gin´es, R., Grau, A., Hern´andez, M.D., Aguirre,
E., Peleteiro, J.B., Fern´andez-Pato, C. and Rodr´ıguez-Rodr´ıguez, C., (2014). Consumer beliefs regarding farmed versus wild fish, Appetite, 79, 25-31.
[18] Clayton, P. L. and Gordon, D. V., (1999). From Atlantic to Pacific: price links in the US wild and farmed salmon market, Aquaculture Economics & Management, 3(2), 93-104.
[19] Crona, B. I., Basurto, X., Squires, D., Gelcich, S., Daw, T. M., Khan, A., Havice, E., Chomo, V., Troell, M., Buchary, E. A. and Allison, E. H., (2016). Towards a typology of interactions between small-scale fisheries and global seafood trade, Marine Policy, 65, 1-10.
[20] Engel, C. and Rogers, J. H., (1996). How wide is the border?, American Economic Review, Vol. 86(5), 1112-1125.
[21] Engle, R. F. and Yoo, S., (1987). Forecasting and testing in cointegrated systems, Journal of Econometrics, Vol. 35 (1), 143-159.
[22] [Eumofa], (2015). The EU Fish Market, Directorate-General for Maritime Affairs and Fisheries of the European Commission.
[23] [European Commission Directorate-General for Maritime Affairs and Fish-eries], (2009). Study on the Supply and Marketing of Fishery and Aquaculture Products in the European Union, Executive Summary.
[24] [Failler, P.], (2005). Future prospects for fish and fishery products. 4. Fish consumption in the European Union in 2015 and 2030. Part 2. Country projections, FAO Fisheries Circular. No. 972/4, Part 2. Rome, FAO. 2008. 392p.
[25] [FAO], (2005). Economic Performance and Fishing Efficiency of Marine Capture Fish-eries, FAO Fisheries Technical paper 482.
[26] [FAO], (2014). The State of World Fisheries and Aquaculture, Fisheries and Aquacul-ture Department.
[27] [FAO GLOBEFISH], (2009). Seabass and Seabream, European Price report: http://www.globefish.org/seabass-and-seabream-market-reports.html.
[28] [FAO GLOBEFISH], (2013). Fish oil and Fish meal, European Price report: http://www.globefish.org/fish-oil-and-fishmeal-january-2013.html.
[29] [FEAP], (2015). European Aquaculture Production Report 2005-2014, Federation of European Aquaculture Producers.
[30] [FranceAgriMer], (2012). Consommation des Produits de la Pˆeche et de l’Aquaculture. Les donn´ees statistiques de FranceAgriMer 2012 / PECHE ET AQUA-CULTURE.
[31] [FranceAgriMer], (2011). La Commercialisation et la Consommation des Produits Aquacoles, Focus sur le bar et la dorade royale. LES SYNTHESES de FranceAgriMer 2011 / PECHE ET AQUACULTURE.
[32] [FranceAgriMer], (2012). Les produits de la Pˆeche et de la Pisciculture en France, Dossier de Presse.
[33] Gordon, D. V., (1993) A fish is a fish is a fish? Testing for market linkages on the Paris fish market. Marine Resource Economics, Vol. 8, 331-343.
[34] Jaffry, S., Pascoe, S., Taylor, G., and Zabala, U., (2000). Price interactions between salmon and wild caught fish species on the Spanish market, Aquaculture Eco-nomics & Management, Vol. 4(3/4), 157-167.
[35] Johansen, S., (1988). Statistical analysis of cointegration vectors, Journal of Eco-nomic Dynamics and Control, Vol. 12, 231-254.
[36] Johansen, S. and Juselius, K., (1990). Maximum likelihood estimator and infer-ences on cointegration with application to the demand for money, Oxford Bulletin of Economics and Statistics, Vol. 52(2), 169-201.
[37] Johansen, S., (1995). Likelihood-based inference in cointegrated vector autoregressive models, Oxford University Press.
[38] Knapp, G., Roheim, C. A., and Anderson, J. L., (2007). The great salmon run: competition between wild and farmed salmon, TRAFFIC North America, Washington D.C.: World Wildlife Fund.
[39] Kwiatkowski, D., Phillips, P. C. B., Schmidt, P., Shin, Y. (1992). Testing the null hypothesis of stationarity against the alternative of a unit root, Journal of Econometrics, Vol. 54 (1–3), 159–178.
[40] McKinnon, J. G., (1991). Critical values for cointegration tests, in Engle R. F. and Granger, C. W. J. (eds), Long-run Econometrics and Statistics, Oxford University Press, 267-276.
[41] Natale, F., Hofherr, J., Gianluca, F., Virtanen, J. (2013). Interactions between aquaculture and fisheries, Marine Policy, Vol. 38, 205-213.
[42] Nguyen, T. T., Haider, W., Solgaard, H. S., Ravn-Jonsen, L. and Roth, E. (2015). Consumer willingness to pay for quality attributes of fresh seafood: A labeled latent class model, Food Quality and Preference, 41, 225-236.
[43] Nielsen, M., (2005). Price formation and market integration on the European first-hand market for whitefish, Marine Resource Economics, Vol. 20, 185-202.
[44] Nielsen, M., Setala, J., Laitinen, J., Saarni, K., Virtanen, J. and Honka-nen, A., (2007). Market integration of farmed trout in Germany, Marine Resource Economics, Vol. 22, 195-213.
[45] Norman-Lopez, A., (2009). Competition between different farmed and wild species: the US Tilapia market, Marine Resource Economics, Vol. 24, 237-251.
[46] [OECD], (2010). Advancing the Aquaculture Agenda, Workshop Proceedings.
[47] Olsen, L. R. and Hasan M. R., (2012). A limited supply of fishmeal: Impact on future increases in global aquaculture production, Trends in Food Science & Technology, 1E.
[48] Polymeros, K., Kaimakoudi, E., Schinaraki, M. and Batzios, C. (2015). Analysing consumers’ perceived differences in wild and farmed fish, British Food Jour-nal, Vol. 117(3), 1007-1016.
[49] Rodriguez, R.G., Bande, R., Villasante, S. (2013). Origins matter: (no) mar-ket integration between cultured and wild gilthead sea bream in the Spanish seafood market, Aquaculture Economics & Management, Vol. 17(4), 380-397.
[50] Roth, E. and Ukendt, M., (2004). Study of the market for aquaculture produced seabass and seabream species. The European Commission DG Fisheries, Final Report 23rd April 2004. Department of Marketing.
[51] Roth, E. and Ukendt, M., (2004). Study of the market for aquaculture produced seabass and seabream species. The European Commission DG Fisheries, Final Report 23rd April 2004. Department of Marketing.
[52] Schlag, A. K. and Ystgaard, K., (2013). Europeans and aquaculture: perceived differences between wild and farmed fish. British Food Journal, Vol. 115 No. 2, pp. 209-222.
[53] Smith, A. D .M., Brown, C. J., Bulman, C. M., Fulton, E. A., Johnson, P., Kaplan, I. C., Lozano-Montes, H., Mackinson, S., Marzloff, M., Shannon, L. J., Shin, Y.-J. and Tam, J., (2011). Impacts of fishing low trophic level species on marine ecosystems. Science 333, 1147-1150.
[54] Stigler, G.J. (1969). The Theory of Price, London, England: MacMillan.
[55] Valderrama, D. and Anderson, J., (2010). Market interactions between aqua-culture and common-property fisheries: Recent evidence from the Bristol Bay sockeye
salmon fishery in Alaska, Journal of Environmental Economics and Management, Vol. 59, 115-128.
[56] Ye, Y. and Beddington, J. R., (1996). Bioeconomic interactions between the cap-ture fishery and aquaculcap-ture, Marine Resource Economics, Vol. 11, 105-123.
[57] Worm, B., Hilborn, R., Baum, J. K., Branch, T. A., Collie, J. S., Costello, C., Fogarty, M. J., Fulton, E. A., Hutchings, J. A., Jennings, S., Jensen, O. P., Lotze, H. K., Mace, P. M., McClanahan, T. R., Minto, C., Palumbi, S. R., Parma, A. M., Ricard, D., Rosenberg, A. A., Watson, R., Zeller, D., (2009). Rebuilding Global Fisheries, Science, Vol. 325, 578-585.
A
Appendix
A.1
Pairwise price comparisons
Table 10: Mean price comparison test: wild versus farmed sea bass
Variable Mean Std. Err. Std. Dev. [95% Conf. Interval] Wild sea bass 14.24 0.18 1.51 [13.87; 14.60] Farmed sea bass 9.28 0.13 1.10 [9.03; 9.54]
diff 4.96 0.23 1.88 [4.51; 5.42] H1: mean(diff ) < 0 t = 21.92 Pr(T < t) = 1.00
Number of observations: 69.
Student test degrees of freedom: 68.
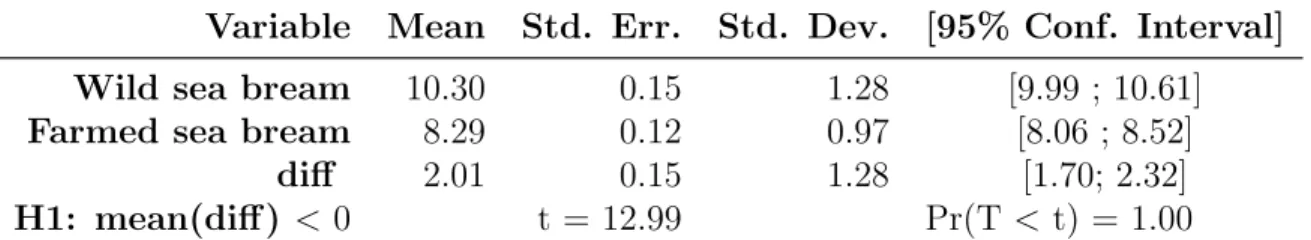
Table 11: Mean price comparison test: wild versus farmed sea bream
Variable Mean Std. Err. Std. Dev. [95% Conf. Interval] Wild sea bream 10.30 0.15 1.28 [9.99 ; 10.61] Farmed sea bream 8.29 0.12 0.97 [8.06 ; 8.52]
diff 2.01 0.15 1.28 [1.70; 2.32] H1: mean(diff ) < 0 t = 12.99 Pr(T < t) = 1.00
Number of observations: 69.
Figure 1: Pairwise comparison of whole farmed/wild sea bass and sea bream prices in logarithms (2007-2012)
(a) bass (b) bream
Prices are displayed in logarithms in Figure 1. Farmed and wild sea bream prices seem rela-tively correlated over the time period, especially from 2010 (around month 36 in Fig. 2(b)). This applies less to the case of farmed and wild sea bass, especially from 2009 (around month 24 in Fig. 2(a)).