HAL Id: tel-01706622
https://tel.archives-ouvertes.fr/tel-01706622
Submitted on 12 Feb 2018HAL is a multi-disciplinary open access archive for the deposit and dissemination of sci-entific research documents, whether they are pub-lished or not. The documents may come from teaching and research institutions in France or abroad, or from public or private research centers.
L’archive ouverte pluridisciplinaire HAL, est destinée au dépôt et à la diffusion de documents scientifiques de niveau recherche, publiés ou non, émanant des établissements d’enseignement et de recherche français ou étrangers, des laboratoires publics ou privés.
buildings
Ana Stefanoiu
To cite this version:
Ana Stefanoiu. Towards performance evaluation of energy efficient buildings. Construction durable. Université Grenoble Alpes, 2017. English. �NNT : 2017GREAA007�. �tel-01706622�
THÈSE
Pour obtenir le grade de
DOCTEUR DE LA COMMUNAUTE UNIVERSITE
GRENOBLE ALPES
Spécialité : Doctorat Génie Civil et Sciences de l'Habitat Arrêté ministériel : 25 mai 2016
Présentée par
Ana Maria STEFANOIU
Thèse dirigée par Monika WOLOSZYN, Professeur, Université de Savoie Mont Blanc, et
codirigée par Etienne WURTZ, Directeur de Recherche, CEA-INES
Encadrement par Catherine BUHE et Arnaud JAY préparée au sein du LOCIE UMR USMB CNRS 5271 dans SISEO
Vers l'évaluation de la performance
des bâtiments à haute efficacité
énergétique
Thèse soutenue publiquement le 20 mars 2017 devant le jury composé de :
M. Godfried AUGENBROE
Professeur, Georgia Tech, Examinateur
Mme. Catherine BUHE
Maitre de conférences, Université de Savoie Mont Blanc, Examinateur
M. Arnaud JAY
Ingénieur de recherche, CEA-INES, Membre Invité
M. Laurent MORA
Maitre de conférences, IUT Bordeaux, Examinateur
M. Bruno PEUPORTIER
Directeur de Recherche, Mines Paris Tech, Rapporteur
M. Stéphane PLOIX
Professeur, Grenoble INP, Président du jury
M. Dirk SAELENS
Professeur, KU Leuven, Rapporteur
Mme Monika WOLOSZYN
Professeur, Université de Savoie Mont Blanc, Directrice de thèse
M. Etienne WURTZ
2
SUMMARY
SUMMARY ... 2 ABSTRACT ... 5 NOMENCLATURE ... 8 INTRODUCTION ... 11CHAPTER 1. A state of the art on methods used for the evaluation of the performance of an energy efficient building ... 18
1.1. Introduction ... 19
1.2. Monitoring ... 20
1.3. Building performance simulation ... 26
1.4. Real performance exemples ... 30
1.5. Findings ... 33
CHAPTER 2. Dispersions in energy use related to occupant’s behavior: a numerical investigation in the design phase ... 34
2.1. Introduction ... 35
2.2. The case study: single-family detached home (PosA) ... 36
2.3. Deterministic schedule modeling ... 40
2.4. Results using deterministic scenarios ... 46
2.5. Stochastic approach modeling ... 50
2.6. Results using probabilistic scenarios ... 53
2.7. Findings ... 60
CHAPTER 3. Numerical and experimental study of the envelope’s proprieties of a building………62
3.1. Introduction: characterizing the envelope’s proprieties ... 63
3.2. Existing methods ... 65
3.3. Proposed experimental protocol and identification procedure ... 76
3.4. Application to I-BB experimental house ... 82
3.5. Application to PosA occupied house ... 101
3.6. Findings ... 109
CHAPTER 4. Continuous evaluation of the global energy performance: a practical application……….111
4.1. Introduction ... 112
3
4.3. Continuous monitoring specifications ... 115
4.4. Preliminary study: Monitoring ambient temperature in occupied houses ... 118
4.5. Global monitoring of the PosA house: practical implementation and first results 128 4.6. Findings ... 147
CONCLUSION ... 149
REFERENCES ... 154
RESUME EN FRANCAIS ... 167
ANNEXES ... 190
ANNEX A. PosA house: construction information ... 191
A.1. Building’s plans ... 191
A.2. Envelope’s composition ... 193
A.3. Electric system connections ... 194
ANNEX B. Envelope’s performance complements ... 195
B.1. Blower door principle ... 195
B.2. N and K coefficients for the Retrotec 3000 and 300 Fans used ... 196
B.3. Additional low insulated surface calculation ... 197
B.4. Differential pressure sensors validation table ... 197
B.1. Blower door results on the I-BB house ... 199
ANNEX C. Thermography analysis on PosA house ... 200
ANNEX D. Monitoring complements ... 202
D.1. Limiting the number of sensors : selected approach description ... 202
D.2. ‘As defined’ sensors distribution for the PosA house ... 204
D.3. Implemented sesnsors for the PosA building ... 207
D.4. Occupant survey ... 210
4
This thesis was a beautiful adventure and a great experience and is also due to the people I have the honor and the pleasure to share it with.
First of all, I would like to thank my PhD supervisors Monika Woloszyn and Etienne Wurtz for their guidance, support and wonderful opportunities which helped me to complete this work. A special thanks to Catherine Buhe and Arnaud Jay, my two “super co-encadrants” who helped me a lot with their advice and support.
Thank you to my two rapporteurs Bruno Peuportier and Dirk Saelens, “mon president de jury“ Stephane Ploix and Laurent Mora for their advice and for reviewing my thesis as members of my thesis committee. A very special thanks to Professor Godfried Augenbroe for accepting to travel over 7000km just to be in my thesis committee, for his help during my research exchange program at Georgia Tech, but also for his precious advice, guidance and support.
I also wish to thank the APS (l'Assemblée des Pays de Savoie), CEA (Commissariat à l’énergie atomique et aux énergies alternatives), INES2 and Université de Savoie Mont Blanc for providing financial assistance during this work.
To my colleagues from the two laboratory LOCIE and CEA for all the help during my thesis, for all the lovely moments which I will always remember…merci beaucoup.
My thesis was a long journey and I was lucky enough to have a lot of good times but also help, support and kindness of my friends (they know ). Thank you all for everything, I am blessed to have such friends!
Last but not least, to my family and to my little brother (my best friend) for always being there for me.
5
6 En France, le secteur du bâtiment est le principal consommateur d'énergie. En outre, le secteur de la maison individuelle représente environ 60% des constructions annuelles de logements. La construction des bâtiments à haute efficacité énergétique représente un grand pas vers l'économie d'énergie. Cependant, même si divers efforts sont déployés dans ce domaine, des outils et des méthodes manquent pour évaluer la performance énergétique de ces bâtiments. Cette évaluation doit permettre non seulement de comprendre les facteurs qui contribuent à cette performance mais également d'identifier les causes de la surconsommation, d’inconfort pour les occupants.
Cette thèse vise à contribuer à cet objectif en proposant une approche d'évaluation de la performance énergétique d'un bâtiment. Pour cela on compare la performance réelle et la performance attendue en utilisant le monitoring et la simulation thermique dynamique. Cette approche s’appuie sur différents cas d’études dont principalement une maison individuelle, situé en un climat méditerranéen.
Dans un premier temps, en phase de conception, nous utilisons des simulations thermiques dynamiques pour étudier l’impact du comportement sur les besoins énergétiques. L'objectif est d'analyser l'influence du scénario d'occupation sur le comportement du bâtiment et d'établir une plage de valeurs pour les besoins en énergie, basée sur des statistiques nationales. Le comportement du bâtiment est étudié en fonction de différents types de scénarii d'occupation, de consignes de température, de l'utilisation d’appareils domestiques et d'éclairage.
Dans un second temps, l'accent est mis sur l'évaluation globale de la performance de l'enveloppe. Un test dynamique in situ innovant a été développé pour en évaluer la performance réelle. Ce test est applicable sur une période courte (de l’ordre de la journée) tout en maitrisant les débits d’infiltrations. La comparaison des résultats théoriques en régime stationnaire avec les résultats expérimentaux montre une bonne précision inférieure à 10%.
Enfin, le suivi énergétique en continu des maisons performantes est étudié. Tout d’abord, des travaux sont réalisés dans l’optique de réduire le nombre de capteurs nécessaires au suivi, tout en minimisant la perte d’informations. Ensuite, une méthodologie d’instrumentation est développée et appliquée à une maison individuelle. Le suivi de cette maison a pu être étudié sur les six premiers mois de monitoring et a permis d’expliquer le comportement du bâtiment et ses consommations au regard de son usage et de faire le lien avec les prévisions faites en phase de conception.
MOTS CLES
Evaluation de la performance énergétique, bâtiment à énergie positive, simulation thermique dynamique, test in-situ, monitoring, phase de conception, phase opérationnelle, conditions intérieures, efficacité énergétique.
7 In France, the building sector is the main energy consumer. Moreover single-family houses represent about 60% of annual dwelling construction. The construction of energy efficient buildings represents a big step into energy saving. However, even though various efforts are made within this field, there is still a lack of methodologies about how to evaluate the energy performance of these buildings. The performance evaluation of an energy efficient building should allow understanding factors that contribute to its energy performance and as well as identifying the causes of overconsumption, poor indoor conditions.
This thesis seeks to contribute to this field, by proposing an approach towards evaluating the energy performance of a house. This is done by comparing the real performance and the expected performance, using monitoring and building performance simulation, from design to operational phases. The energy performance evaluation approach is carried out on different cases of studies, mainly on a single-family house, situated in a Mediterranean climate.
First, in the design phase, we use building performance simulation models to study the dispersions in energy use related to occupant’s behavior. The goal is to analyze the influence of the occupancy scenario on the behavior of the building and to establish a range of values for energy demand, based on national statistics. This step studies the building’s behavior based on different types of occupancy scenarios, appliances and lighting use and temperature set point.
Then, the focus is on the global evaluation of the envelope’s performance. Within the present thesis an innovative in-situ dynamic test is developed to assess the real envelope’s performance. This test is adapted to occupied houses (as it only takes 2 days) while controlling the infiltration air flow. The comparison between theoretical results of steady state calculation and experimental results show a good precision of less than 10%.
Finally, continuous monitoring of energy efficient houses is studied. First, a work is done to reduce the number of sensors required for monitoring, while minimizing the loss of information. Then, an instrumentation methodology is developed and applied to a single-family house. The follow-up of this house could be studied during the first six months of monitoring and allowed to explain the behavior of the building and its consumption with regard to its use and to make the link with the previsions made during the design phase.
KEYWORDS
Energy performance evaluation, energy efficient building, building performance simulation, in-situ dynamic test, monitoring, design phase, operational phase, indoor conditions, energy use.
8
9
General notation
Notation Significance
DHW Domestic Hot Water
HVAC Heating, Ventilation and Air-Conditioning
𝐼 − 𝐵𝐵 Experimental house (INCAS-Beton Banché)
R0 Ground floor
R+1 First floor
RT2012 French thermal regulation
𝑃𝑜𝑠𝐴 Single-family detached home: case study
VOC Volatile Organic Compounds
Physical notation
Notation Significance Unit
𝑐𝑝 Specific heat capacity at constant pressure [kJ/(kgK)]
𝑐𝐿 Air leakage coefficient [m3/(hPan)]
𝐶 Global thermal capacitance [J/K]
𝐶𝑤𝑎𝑙𝑙 Walls thermal capacity [J/K]
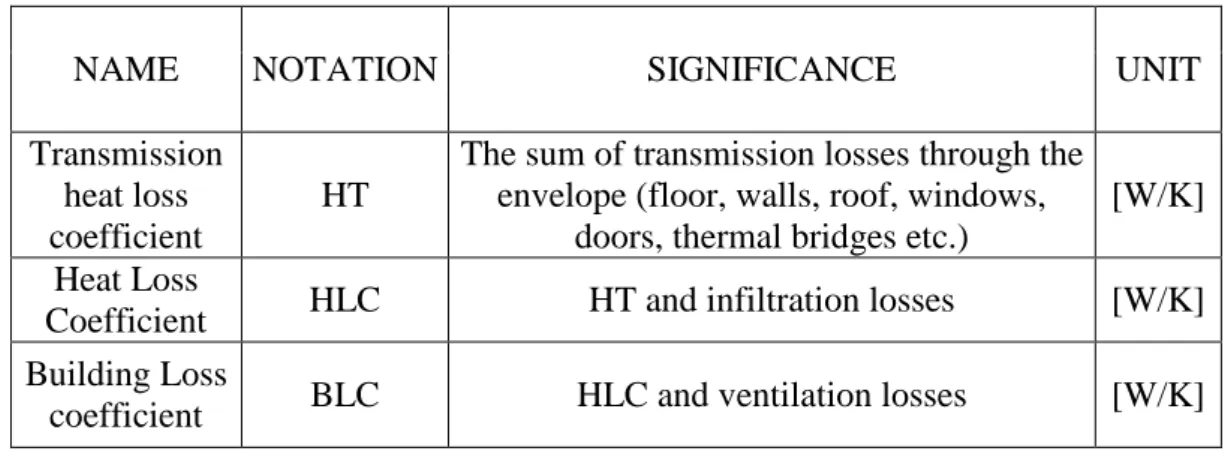
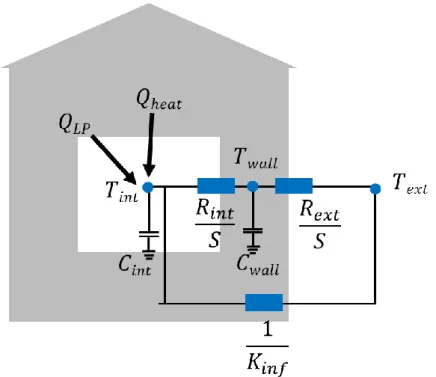
𝐻𝑇 Transmission Heat Loss Coefficient [W/K]
𝐻𝐿𝐶 Heat Loss Coefficient [W/K]
𝐵𝐿𝐶 Building Loss Coefficient [W/K]
𝑄4𝑃𝑎−𝑆𝑢𝑟𝑓 Ratio between the leakage flow required to maintain a
differential pressure of 4 Pa and the total envelope’s heat loss area (except lower floor)
[m³/(hm²)]
𝑞𝐿 Volumetric leakage air-flow rate [m3/h]
𝑄ℎ Total measured power input from space heating [W]
𝑄𝐿𝑃 Internal load power [W]
𝜌 Density [kg/m3]
∆P Pressure difference between the inside and the outside of the room or building
[Pa]
𝑛 Air-flow exponent [-]
∆𝑇 Air temperature difference between indoor and outdoor [°C]
𝑅 Global thermal resistance [K/W]
𝑅𝑒𝑥𝑡 External thermal resistance [m²K/W]
10
Notation Significance Unit
𝑄ℎ Total heat gains (heater power) [W]
𝑆 Total envelope’s heat loss area [m2]
𝑇𝑖𝑛𝑡 Indoor air temperature [°C]
𝑇𝑒𝑥𝑡 Outdoor air temperature [°C]
𝑇𝑤𝑎𝑙𝑙 Mean walls temperature [°C]
𝑈𝑒𝑥𝑡 External heat transfer coefficient( 1/𝑅𝑒𝑥𝑡) [W/(m2K)]
𝑈𝑖𝑛𝑡 Internal heat transfer coefficient (1/𝑅𝑖𝑛𝑡) [W/(m2K)]
𝐾𝑖𝑛𝑓 Infiltration enthalpy losses [W/K]
Modeling notation
Notation Significance
𝐶𝑉𝑅𝑀𝑆𝐸 Coefficient of variation of the RMSE
MCMC Markov Chain Monte Carlo
𝑅𝑀𝑆𝐸 Root-mean-square error 𝑝(𝜃) Prior distribution 𝑝(𝑦, θ) Posterior distribution 𝑝(𝜃, 𝑦) Likelihood function 𝑦(𝑥) Observations 𝜂(𝑥, 𝜃) Model outputs 𝛿(𝑥) Model discrepancy 𝑥 Inputs 𝜃 Identification parameters
11
12 Today, the building sector is the largest emitter of CO2 in the European Union (EU) and
therefore most developed countries and many developing countries have already taken steps toward prioritizing the building sector in their national climate change strategies. In this context, one of the most important goals in many environmental programs worldwide is to increase the energy efficiency of new and existing buildings (AlAjmi et al., 2016). This can be done by lowering the energy demand, improving the energy efficiency of systems and appliances, and substituting fossil fuels with renewable energies (Day et al. 2009). In Europe, the Energy Performance of Buildings Directive (EPBD) requires that by the end of 2020 all new buildings have a very high performance, demanding only a low amount of energy supplied mostly from renewable sources (DIRECTIVE 2010/31/EU, 2010).
Energy-efficient building design is an important step because it is not simply the addition of technologies of passive envelope, energy-efficient systems, etc. Instead, it can be viewed as an entire process, where the goal is to reduce the heating, cooling and lighting loads by investing in the building’s form and enclosure (e.g., windows, walls) (Rossow 2001). An understanding of building occupancy and activities can lead to building designs that not only save energy and reduce costs, but also improve occupant’s comfort and workplace performance (Rossow 2001). The technique for an energy-efficient building consists of energy saving measures together with the use of renewable energy sources. Various current demonstration projects are focused on providing realistic experiences about the design, construction and operation of energy-efficient buildings (Parker, 2009) (Guerra-Santin et al., 2013a) (Spitz et al., 2012). There is also the concept of so-called “zero-energy building”(called also “positive-energy buildings”) which can roughly be defined as a building that produces as much renewable energy (using wind or solar energy for example) as it uses, while having low or zero carbon emissions. Its definition and energy calculation methodology vary greatly depending on the metric and period used for the calculation of the energy balance (primary versus delivered energy, annual versus monthly), the type of energy considered for the balance, etc. (Marszal et al., 2011) (Sartori et al., 2012) (Berry et al., 2014)(Deng et al., 2014).
In the context of reducing energy consumption by constructing only positive-energy buildings, the research program “COMEPOS” was established in 2013 in France. This project aims at designing, constructing, evaluating and optimizing the energy performance of occupied positive-energy individual houses. COMEPOS (Optimized Design and Construction of Near-Zero-Energy Buildings) brings together 22 partners (research centers, developers,
13 manufacturers) with the goal of developing and implementing in practice the concept of positive-energy houses. The main result of the project will be the validation in real conditions of the feasibility of this concept by the construction of 20 real houses, located throughout France. The project includes optimization of the design process, as well as monitoring and in situ validation of houses performance in different climate conditions.
While optimizing building’s design is one of the important issues, evaluation of the performance of the occupied houses is another challenge for research. The latter is the main objective of the present thesis and an important aim of the COMEPOS project used as an experimental case study in this work.
“Building performance” represents a complex term and several definitions can be encountered. Often, to evaluate the building performance (Deng et al., 2014) is to quantify its impact on the energy consumption, using data from experiments and simulation as well as its impact on the environment using lifecycle assessment with a quantification of the materials used and their environmental impact (Thiers and Peuportier, 2012). But, it’s also mandatory to monitor the satisfaction of the building occupants, in order to make sure that the house provides a comfortable indoor environment. The evaluation process also includes verifying whether the energy performance predicted during the design stage corresponds to the real energy performance of the building, by using measurement and a verification protocol like in IPMVP (International Performance Measurement and Verification Protocol) (Efficiency Valuation Organization, 2012). Different approaches ranging from simple to more complex can be used to evaluate the building performance.
The simplest and cheapest way is to evaluate the energy use over one year (annual energy performance). It can be done by examining the energy consumption retrospectively through energy bills. The goal is to establish the energy efficiency of the building by looking at the real energy balance between energy consumption and production. The evaluation time step in this case is usually 1 year.
However, in a global approach, evaluating the performance of a building should take into account not only the energy use, but also the occupant’s feedback about the domestic conditions such as thermal comfort, indoor air quality, etc. It could be that a building achieves a positive annual energy balance but the occupants are not satisfied with their indoor conditions. Moreover, the time-scale of the evaluation is also important. A building can have satisfactory behavior on yearly average, while problems occur on monthly or daily basis. Therefore, a more complete and complex evaluation of the building’s performance is needed to be able to understand at any moment the building’s behavior, eventual causes of overconsumption, as well
14 as indoor conditions. The time step can vary from seconds to hours, months, etc. The need to know more about the performance at each time step will require some performance data which can be acquired through continuous monitoring. First, for each case, performance indicators (for example energy use, thermal comfort, heat loss coefficient, COP, etc.) are defined. They are used to characterize the building’s envelope, the system’s performance, etc. The type, duration and frequency of the building monitoring depend on these performance indicators. For example, if the goal is to characterize the electric energy consumption, monthly electric bills will meet the requirements. But if the goal is to evaluate the indoor conditions, additional measurements are needed. This can include measurements of indoor temperature, relative humidity, etc. Measurements of the real heating set-point temperature can help explaining, for example, overconsumption on a large scale. It can be done by comparing the set-point temperature suggested by the regulation /design with the real (measured) one. If a large difference in the energy use is observed, it may be that the occupants prefer a higher (than legislated) set-point temperature and the regulation calculation represents an unrealistic estimation of the future energy consumption in this case. However, other factors are also involved. Overconsumption can derive from an inefficient envelope, system malfunctioning, or the impact of the weather.
Evaluating the building’s performance involves therefore understanding the different
components that drive it. In a collaborative project of International Energy Agency (IEA) in the Buildings and Communities Program (EBC), Annex 53: Total Energy Use in Buildings, experts identified that energy use in building is influenced by six factors. They are differentiated by being climate related, building related (building envelope, building equipment) and human behavior related (operation and maintenance, occupant behavior, indoor environmental conditions), as shown in Figure 0-1.
15
Figure 0-1: Six factors influencing total energy use in buildings, extract from Annex 53 Summary Report.
First, there are the components of the building that are optimized during the design process: the envelope and the equipment. The envelope, which is clearly an important part of the building, should be considered in the process of evaluating the building’s performance. The envelope’s components encompass various elements such as, among others: U value, building’s orientation, interior/exterior wall structure, thermo-physical properties of the construction materials, the shape factor (ratio volume/surface) and thermal bridge effect. Efficient envelope attempts to reach an optimal combination of these components correctly implemented within the construction phase. Then, there is the performance of the building’s equipment. Equipment are designed to ensure a good indoor air quality, to produce energy and to provide domestic hot water. Many innovative equipment and technologies are available for this purpose. However, in reality, the envelope and building’s equipment may perform in an unexpected way (malfunctioning). Therefore, there is a need to evaluate their real performance.
Next, there are unpredictable loads that cannot be optimized during the design process. These dynamic loads refer to both outdoor conditions and the human factors. The outdoor
conditions are the climate parameters (outdoor air temperature, wind, solar radiation etc.) and
surrounding environment (nearby buildings, etc.). This impacts the building’s performance in various ways. For example, weather conditions can lead to overconsumption or poor thermal comfort due to extreme temperatures in winter or summer. And last but not least, there is the
occupants’ behavior, which is a very important factor impacting the building’s performance.
Its dynamic aspect includes the opening and closing of windows, the occupants’ presence and activity, thermostat settings etc.
Evaluating the contribution of each of these factors on the building’s performance represents a major step toward improving the building’s performance. Continuous monitoring (energy meters, etc.) or short tests and performance simulation are usually employed in this goal. For example, the contribution of outdoor conditions can be evaluated using a weather station. Short tests such as post-occupation survey, for instance, can also be used for a deeper understanding of the occupants’ behavior. To complement monitoring, building performance simulation can be used to create various situations representing a year or an entire lifetime with different scenarios for occupancy, climate, etc. Simulation can be used before the building is constructed in the design phase to estimate the energy use, the temperature, etc., so as to optimize the design. It can also be used in the operational phase to evaluate and to better understand the building’s behavior using different scenario.
16 This thesis will focus on two different types of evaluation. On one hand, the envelope’s properties evaluation and on the other hand an evaluation approach of the whole building’s performance. Within the present thesis the “building performance” refers to the following factors: first, a building is meant to be occupied, so it must provide a reasonable level of satisfaction for its occupants. But in order to do that, the house must be efficient regarding the energy use. Therefore, the term of “building performance” depends on one part on the envelope’s properties (which exist as static attributes irrespective of how the building is used and are not affected by scenario such as exterior conditions, occupants etc.) and on the other part on the building’s use (occupants, exterior conditions). Therefore, the building performance can only be measured in a given use scenario (such as energy use in a reference winter for a given occupation schedule).
The objective of the present thesis is to propose an evaluation approach to better understand the global performance of energy-efficient houses and contributing factors. Furthermore is to help to verify whether the performance predicted during the design stage corresponds to the real one. This will be done through monitoring and building performance simulation. Within the present thesis we will the focus on: energy use and indoor conditions, by looking at two aspects: building envelope and occupant’s behavior.
The approach proposed here consist in:
Firstly, we use building performance simulation to create different occupancy scenarios to better understand the factors related to occupancy that drive energy use and indoor conditions.
Secondly, we will acquire performance data through continuous monitoring and in situ tests (to evaluate the envelope’s properties for example). This will allow to get detailed information about the energy use, occupant’s behavior etc.
Finally, in order to better understand the real behavior of the building and of its occupants, the measurements will be compared with the results predicted in the design phase.
The thesis is organized in four chapters. Chapter 1 presents the state of the art of the methods used for the performance evaluation of an energy-efficient building: monitoring and simulation. Choosing the appropriate simulation tool or monitoring is a challenging task, considering the variety of available tools. This chapter gives an overview of both methods used worldwide. Once monitoring or simulation is chosen, the evaluation process provides information on the building’s performance through data. The last part of this chapter presents some examples of this performance through several case studies.
17 Literature review confirms that in an occupied buildings an enormous impact on the building’s performance comes from the stochastic nature of the occupants’ behavior. In chapter 2, dispersions in energy use related to the occupants’ behavior are identified by testing various scenarios of occupancy, appliances use and set-point temperature. The goal is to better understand the impact of occupants’ behavior on energy use and to establish a range of values for energy demand, depending on the occupant.
However, when using simulation we assume that the building itself represented by the envelope is a perfect implementation of the “as designed” envelope’s characteristics. In reality, differences can be encountered between the “as designed” and “as built” envelope. Therefore, in chapter 3 short-term tests are used to evaluate the constructed envelope. The test associate numerical simulation and experimental study. Some improvements of existing tests are proposed and tested on real houses.
Finally, chapter 4 presents the evaluation of the building’s performance in the operational phase via continuous monitoring. First, the evaluation approach is described. Then a proposal of the monitoring methodology for a single family house is introduced. Furthermore, a practical application of the proposed evaluation approach on an occupied house is shown. For a better understanding of the building’s performance, the performance data collected during the operational phase are compared with the performance estimated during the design phase. Energy efficiency and thermal comfort are analyzed through measurements and occupant surveys.
18
CHAPTER 1. A state of the art on methods used for the evaluation
of the performance of an energy efficient building
1.1. Introduction ... 19
1.2. Monitoring ... 20
1.3. Building performance simulation ... 26
1.4. Real performance ... 30
19
1.1. Introduction
This chapter presents the state of the art in methods used for evaluating the performance of an energy-efficient building. As described earlier, these methods comprise monitoring and building performance simulation. Choosing the appropriate monitoring or simulation tool can be a challenging task, considering the wide variety available and the rapid developments in both fields. This chapter gives a background overview of the various monitoring and simulation methods used worldwide.
Before starting the monitoring, evaluation of the energy performance should start with a precise description of the physical parameters that need to be monitored, that is, energy use, thermal comfort, etc. Then, the monitoring activity can start. Differences in the type, the duration, the frequency as well as in sensor placement can be observed in monitoring. These differences are determined by the purpose of the study or the user’s experience. As with the simulations, various tools are increasingly used to estimate the energy use, indoor conditions, and system performance. Choosing the appropriate tool for each particular case depends on the purpose of the study, the user’s experience and the data available. As mentioned earlier, the present thesis uses both simulation and monitoring for a continuous evaluation of the global performance. Therefore, this chapter seeks to review the current background information on both methods.
After the monitoring or simulation methods are chosen, the evaluation process reveals the building’s performance through real performance data. Some examples have shown that buildings perform as expected. In some cases, however, the real energy performance does not match the one expected, a term so called ‘performance gap’. The last part of this chapter presents examples of the real performance for both cases.
20
1.2. Monitoring
Continuous global performance can be evaluated via monitoring. This section presents an analysis of the current background in the framework of monitoring and evaluation of the energy performance of efficient buildings. An attempt is made to identify typical in situ sensors or technical information deriving from the design data.
Certain differences in the monitoring of buildings have been identified. On one hand, there are measurements performed in the residential sector (Dall’O’ et al., 2012) (Gans et al., 2013) or in the service or retail sectors (Agha-Hossein et al., 2013) (Li et al., 2016a). Another difference is whether the measurements are performed in a facility/research laboratory conditions (Saelens et al., 2004) (Loutzenhiser et al., 2009) (Mateus et al., 2014) or in real-life conditions (single house family, office buildings, for example) (Andersen et al., 2013a) (Rohdin et al., 2014). On the other hand, monitoring depends greatly on the purpose of the study and the performance indicators that are being assessed. These performance indicators are usually established before the monitoring process. There are quantitative performance indicators requiring objective data that can be measured: for example, energy use, indoor temperature, etc. There are also qualitative performance indicators requiring subjective data: for example, evaluating the thermal comfort (Guerra-Santin and Tweed, 2015) (Olivia and Christopher, 2015) or the environmental impact (Meggers et al., 2012). These performance indicators are defined by the purpose of the evaluation, whether is to understand and to improve the energy performance or to give feedback about the energy performance (checking whether the building complies with legislation requirements). Once the purpose is defined, these performance indicators are evaluated through measurements: whether it is the evaluation of energy consumption (Sree, Paul, and Aglan 2010), of the thermal comfort (Rohdin et al., 2014), of the indoor air quality (Wallace et al., 2002) (Gunschera et al., 2013), of the building’s operation (Andersen et al., 2013b), or of the impact of the building on the occupants’ health (Wolkoff 2013). Table 1-1 lists some examples of studies, describing the purpose of the study and the measurements that were performed. The table shows that, depending on the purpose of the study, some authors used short duration test (occupant survey, etc.), while others have used continuous monitoring over a period of months, years, etc. Short-term measurements are less expensive and allow for the rapid and more complex assessment of the performance indicators. Compared with short-term measurements, continuous measurements allow us to study the energy performance over a longer period, establishing patterns and providing a better
21 understanding of the behavior of the occupants’ and buildings alike. However, it is more expensive, complex, and it requires setting up sensors in the occupants’ homes.
Another finding is that while some authors focused only on one building, others used measurements from dozens or even hundreds of buildings in their study. The goal when using several case studies is to benchmark the energy performance of several buildings, to make comparisons and to extract occupancy habits. When focusing on only one building, the goal is to extract detailed information on the energy performance of one specific case study. Therefore, with more complex monitoring, deeper analysis is possible.
Reference paper
Purpose of the study Measurements
(Eskin and Türkmen, 2008)
The effect of climatic conditions and envelope on annual building energy
requirements
Electric power; flow device; temperature; relative humidity; solar radiation (Ke et al.,
2013)
Analysis of the impact of energy consumption parameter changes on the overall energy consumption in a
building
Electricity billing
(Katunsky et al., 2013)
A practical method for analysis and calculation of thermal energy consumptions and saving in buildings
Energy consumption for heating, heat flow, relative
humidity, air and surfaces temperatures; infrared camera (Jiménez and
Madsen, 2008)
Overview of the models that can be applied for modelling the thermal characteristics of building components
using data from outdoor testing
Global vertical solar radiation, heating and ventilation power,
indoor and outdoor temperatures
(Mahdavi and Doppelbauer, 2010)
A performance comparison of passive and low-energy buildings
Indoor air temperature, relative humidity, and CO2
concentration, metered energy use, construction costs,
embodied energy assumptions, and CO2
emission, occupant’s survey (Tronchin and
Fabbri, 2008) Energy performance building evaluation Energy bills (Hesaraki and
Holmberg, 2013)
Energy performance of low-temperature
heating systems Heat pump electricity consumption (Vadodaria et
al., 2014)
Winter and spring-time indoor temperatures in UK homes over the
period 1969–2010
Indoor and outdoor temperatures, occupant survey (Johansson et
al., 2011)
Occupancy levels in multi-family
22 (Summerfield
et al., 2007)
Changes in internal temperatures and energy usage for 15 “low-energy”
dwellings
Gas and electricity meter, surveys, internal temperature
and relative humidity, occupant survey (Filippín and
Beascochea, 2007)
Performance assessment of low-energy buildings
Energy consumption, occupant survey, solar irradiance on horizontal
surface, outdoor temperature, wind velocity
and direction, and indoor temperature (Persson and
Westermark, 2012)
Evaluate the effect the phase change material night cool storage has on the
climate in a passive house
Outdoor and exhaust air temperature
(Okuyama and Onishi, 2012)
Reconsideration of parameter estimation and reliability evaluation methods for building airtightness measurement using
fan pressurization
Indoor and outdoor temperatures, wind velocity,
airflow rate, pressure difference
(Ridley et al., 2013)
Monitored performance of the first new London dwelling certified to the passive house standard
Dry bulb temperature, relative humidity, wind speed and
direction, global solar radiation, atmospheric pressure,
precipitation, room temperature relative humidity,
concentrations of CO2,
utilities metering, duct temperatures, heat meters (Huebner et al.,
2013a)
The reality of English living rooms – A comparison of internal temperatures against common model assumptions
Survey and internal temperature (Karjalainen,
2009)
Thermal comfort and use of thermostats
in Finnish homes and offices Survey
(Newsham et al., 2013)
Reduce the peak electrical demand for houses
Individual appliance energy use, interior temperature and
humidity, exterior climate data
(Pfafferott et
al., 2007) Thermal comfort comparison
Weather at the building site, room temperatures
Table 1-1: Short background on monitoring
Another finding that can be observed in Table 1-1 is that in the context of evaluating the energy performance, the general focus of the monitoring is on energy consumption and indoor conditions. However, when dealing with occupied buildings, a trade-off between low energy consumption and thermal comfort is usually encountered. A global evaluation of these two parameter indicators should include the necessary monitoring.
23 When energy use is of interest, some studies focused only on total energy use (Hiller, 2012). Other authors have taken into account each end use item separately (heating, household electricity, etc.) (Lopes et al., 2005). Some authors used a simple measure for energy use, using only utility bills (Fumo et al., 2010). Other authors (Sree et al., 2010) however, also considered different factors that influence energy use, and therefore they used more complex monitoring such as: relative humidity and temperature inside, electric power consumption (kWh), outdoor temperature and relative humidity, air temperature and humidity, wind speed and direction, wind chill, solar radiation, barometric pressure, and rainfall data. Whereas only the delivered energy use is metered, evaluation of the primary energy use becomes necessary when the various technologies are compared (for example, electric heating or wood), etc.
Regarding indoor conditions, a wide variety of studies focused on the thermal comfort of occupants. Some authors analyze the thermal comfort based on Fanger’s model (global PMV and PPD index), which is usually recommended for buildings equipped with air conditioning systems and various information is available. The thermal comfort is assigned using a complex measurement that depends on many aspects such as temperature, humidity, air velocity, occupants’ clothing and activity (Pfafferott et al., 2007). More recently, other authors studied the adaptive comfort concept (Albatayneh et al., 2016) (Desogus et al., 2015) (Mahdavi and Doppelbauer 2010), which is recommended for buildings that use natural ventilation. This takes into account the fact that occupants have a natural tendency to adapt in their environment and once they are not satisfied with their thermal comfort they dynamically interact to restore it (Brager and de Dear, 2001) (RP, 1997). Thermal comfort is assessed as a function of indoor and outdoor temperature, and therefore associated measurements are performed. In (Dili, Naseer, and Zacharia Varghese 2011), the authors devised an instrument set-up with electronic sensors to record air temperature, mean radiant temperature, relative humidity, and air movement, with a data logger, memory module (to record data from all sensors), and a computer interface (to view and download data to the computer) to continuously record the comfort parameters over a period of time. Each of these two methods have their advantages and advantages. For example, the adaptive comfort method requires less information, but it cannot be used during winter because of the low temperatures. A combination of these two methods can also be used. There are also some short-term tests for indoor climate measurements using the thermal comfort data logger. Occupant surveys are also often used as a method for evaluating the occupants’ perception of thermal comfort (Knight et al., 2007). Occupant surveys can be used separately or combined with one of the two methods to better understand the results, the occupants’ perception of their thermal comfort, etc.
24 Occupants’ health and indoor air quality are also a subject of great interest in the evaluation of indoor conditions (Wolkoff, 2013) (Krupińska et al., 2012). This is mainly because the wrong indoor temperature and humidity as well as poor indoor air quality can cause a number of health problems, affecting the skin, the respiratory system, and the immune system against various pathogens causing irritation of the eyes and having chronic and carcinogenic effects. It has been demonstrated in studies that there is a relationship between moisture problems, mold growth, and respiratory health effects (Hargreaves et al. 2003) (Liao et al. 2004). It is recommended that the internal temperature be kept between 20°C and 26°C and the indoor relative humidity between 30% and 60% (Nicol and Wilson 2010). The increase in temperature and humidity also affects the release of volatile organic compounds (VOCs) (Reijula 2004). The outdoor air that enters a building can be a source of indoor air pollution and there is also the problem of fungi that are able to grow on almost all natural and synthetic materials, especially if they are hygroscopic or wet (Haleem Khan and Mohan Karuppayil 2012). One of the most important and therefore frequently investigated substances that can influence indoor air quality is formaldehyde. In (Gunschera et al. 2013), the authors reported that the formaldehyde concentration in real indoor air is influenced by multiple parameters and does not simply result from additive emissions from the materials involved. Thus, monitoring usually includes measurements of CO2 concentration levels, concentrations of VOCs,
temperature, humidity, etc.
Other authors studied both energy consumption and indoor conditions (Mahdavi and Doppelbauer 2010). Monitoring included data on indoor environmental conditions (indoor air temperature, relative humidity, CO2 concentration levels, indoor air relative humidity), user
evaluation, metered energy use, calculated embodied energy and CO2 emissions, as well as
construction costs.
Weather conditions are also often monitored. In (Bhandari, Shrestha, and New 2012), the authors specify that the minimum weather data parameters necessary for accurate whole-building simulations are: dry bulb temperature; wet bulb temperature and/or relative humidity; global, direct normal, and diffuse solar radiation and wind speed and wind direction (for natural ventilation and infiltration); moreover, the authors also measured the barometric pressure and the liquid precipitation depth. When measurements of the outdoor conditions are not available, the nearest weather station is often used for the calculations.
Following these observations, it can be seen that the type, duration, and frequency of the monitoring depends significantly on the purpose of the study (energy consumption, thermal comfort, etc.), the building type (residential or tertiary, occupied or laboratory facility), the
25 performance indicators and the users’ experience. However, an overestimation/underestimation of the monitoring can be easily encountered. This is mainly because even if the purpose of the study is clearly defined in the design phase, it can be hard to predict which measurements are required for each case. Another problem is that in occupied buildings, the number of sensors must be limited, while maintaining sufficient robustness and precision of the data. Some studies have focused on this aspect. For example, in (Naveros, Jiménez, and Heras 2012) the focus was on determining the minimum integration period and the minimum set of variables necessary to carry out the analysis of full-size building components. The parameters that were measured comprised: air temperature; surface temperature; heat flux density; vertical global solar irradiance; vertical long-wave radiation on the surface of the test component; wind speed; and outdoor relative humidity.
To sum up, the building’s metering can be classified into several categories, depending on the purpose of the monitoring. Within the present thesis, the monitoring is approached from two aspects: energy efficiency and indoor conditions. These aspects will be more detailed in chapter 4, where it’s presented the practical application of monitoring implemented on a single-family detached home.
One more important aspect concerns the intrusive installation and duration of metering devices. Indeed, in real dwellings, the measuring system must be accepted by the occupants. It is therefore proposed that technical measures consist of two complementary sets:
Continuous measurements (air temperature sensors, energy meters, etc.)
26
1.3. Building performance simulation
Using only measurements is not always enough when one wants to better understand overconsumption or to improve energy saving. Building performance simulation models can help overcome this limitation and are often used as a complement in the process of evaluating the energy performance of energy-efficient buildings. Models are assumed to be able to simulate the actual thermal behavior of the building and to predict its energy consumption. They are increasingly used in the design phase or for retrofit existing buildings, to verify the adequacy of the project regarding the energy performance standards. Building performance simulation can also be used to study and understand the modeled system use and properties and to predict its evolution. However, estimating a building’s energy demand is a big challenge knowing that it is almost impossible to model a true level of occupancy, lighting, and systems heat gains or natural air flow.
The simulation process can be performed by examining three aspects: the building itself, with its actual geometry and envelope; the behavior of its occupants; and of course the systems used. Weather conditions are also taken into account in the simulation process. A wide variety of simulation models have been developed worldwide. The main distinction between them is that:
Some are meant to represent and understand the entire physics process – the so-called white box model (TrnSys, EnergyPlus, Comfie+Pleiade, Fluent, Dymola, etc.).
Others use statistical methods (linear or nonlinear mathematical function) and actual data to estimate the building’s behavior – the so-called black box model
Yet others use a combination of white and black box models – the gray box models. The advantages and drawbacks of these models have already been discussed elsewhere (Foucquier et al., 2013). The choice of using each method depends on the user (modeler) preference, experience, and, of course, the purpose of the study. As explained, the aim of this thesis is to better comprehend the actual thermal behavior of the building, and therefore white and gray box models are chosen. Moreover, as we are interested in the global performance of a building, the nodal approach (which considers the building as a simple zone approximated to nodes) is used. Because of various reasons, which will be described here, the EnergyPlus software (Crawley et al., 2001) is chosen for this work. This is a verified whole-building energy simulation program widespread in the building simulation community around the world. It calculates the heating and cooling loads necessary to maintain optimal thermal conditions and
27 the energy consumption for ventilation, lighting, water use, etc. Among its significant capabilities, the following list summarizes the reasons it is considered here:
It has thermal zone modeling including air movement between zones
It allows for system modeling: HVAC, photovoltaic, DHW, etc.
The software is free and open source
Use of this software is widespread in the community, allowing for stimulating exchanges
Functional linking with other engines (e.g., Matlab).
Numerous studies have shown the widespread utility of this software (Zhang et al., 2013) (Mateus et al., 2014) (Anđelković et al., 2016) (Zhao et al., 2016) which are examples of the utility of this software in studying the energy performance of a building. Some authors used EnergyPlus Benchmark models to estimate the hourly and fuel energy consumption of a building (Fumo, Mago, and Luck 2010). Others used EnergyPlus to benchmark the energy performance of 400 residential buildings and to study future energy saving (Shabunko et al., 2016). In the present thesis, EnergyPlus is mainly used to study and understand the impact of occupants’ behavior on energy use and thermal comfort.
In the process of estimating the energy performance of a building through energy models, three steps can be identified. The first is the modeling of a building’s parameters (envelope, HVAC system, etc.). The next step is the search for the weather file corresponding to the closest location. The third step is to include the occupants’ behavior into the modeling (occupancy schedule, thermostat settings, etc.). However, studies have revealed that occupants’ behavior represents a major source of uncertainty in predicting the energy performance of a building (Yan et al., 2015). In current building energy modeling there are several examples of modelers that do not consider occupancy. The tendency here is to simplify and to focus on the first step by considering an idealized condition of the building’s operation (Spitz et al., 2012) (Loutzenhiser et al., 2009) (Mateus et al., 2014). These models are useful when one wants to isolate and then observe only the building’s envelope and systems. The drawback is that these models do not take into account real-life conditions and consequently it can lead to over- or underestimation of the building energy performance (Ryan and Sanquist, 2012).
Consideration of the building’s occupants should reduce the gaps between the forecasts and the actual behavior, as the model gets more sophisticated, more complex, and more realistic. However, modeling occupant behavior is related to several uncertainties, ranging from the
28 modeler’s disregard of future occupancy in the design phase, the stochastic nature of user behavior, etc.
Most national regulations represent the user using a deterministic schedule, which is generalized and used for all buildings (Melo et al., 2014) (RT2012, 2010). To capture the occupants’ influence on the building’s performance in the design phase, modelers have to determine the “appropriate” schedule for occupancy and systems use (normative profile, estimated data from the future owner, etc.). Moreover, considering the diversity, complexity, and uncertainty associated with each occupant, this is not a straightforward task. To obtain realistic information on occupant behavior, observational data can be used. These are measurements performed on a real dwelling to detect adaptive behavior as well as survey or laboratory measurements (Yan et al., 2015). This can provide big data streams that can be used to test the robustness of the building design by using different schedules, creating some archetypal working profiles (D’Oca and Hong, 2015). The drawback is that implementing a schedule on the basis of data from national statistics can easily become a huge computational task in terms of time. Furthermore, the diversity in building design, climate, and culture prevent hinder a universal approach to modeling occupancy. Apart from modeling using standardized/normative profiles, there is a tendency in current modeling to take into account the stochastic nature of occupant behavior, as in (Vorger, 2014). This involves several approaches such as the Bernoulli process, Markov chains, or survival analysis. All these models use probability functions to predict an event. The differences are that Markov chains use a previous state to predict the probability of a future event, the Bernoulli process is memoryless, and the survival model determines the time until an event will happen (Yan et al., 2015).
There is also the calibration process which compares and tries to minimize the gap between actual data (e.g. utility bills) and design data estimated against an acceptance criterion (CVRMSE, etc.) (Raftery et al., 2011a). This can be done by an ad hoc estimation of the user or by using an optimization process mean to search within a widespread interval of solutions (Li et al., 2015; Raftery et al., 2011b). Using a calibrated model can help improve the design process by identifying which of the input parameters were over- or underestimated.
As mentioned, the white box models require the entry of data on hundreds of parameters of the building and its immediate environment such as the envelope, energy systems, internal loads, and the outdoor climate. However, these various parameters impact differently the energy performance of the building. It is therefore very important to identify parameters that have a strong influence so as to increase the reliability of the simulation. For example, using sensitivity analysis can help to identify which parameters will have a greater effect on the energy
29 consumption of a building and if the model correctly represents the physical phenomena involved, and can give valuable indications for future monitoring. On the other hand, identifying the input parameters with less influence can help reduce the complexity of the model or even of the monitoring. A definition of sensitivity analysis, according to (2004), is: “the study of how uncertainty in the output of a model (numerical or otherwise) can be apportioned to different sources of uncertainty in the model input.” Various sensitivity analysis methods have been developed. These methods can be classified into: screening, local, and global sensitivity analysis.
The screening method is generally used as a qualitative analysis (impossible to rank) of the effect of a large number of input variables on the output (Heiselberg et al., 2009).
Local sensitivity analysis studies the effect on the output by the variation of one input parameter. This method is well adapted to energy models with many inputs. The drawback is that is does not take into account the interaction between parameters or the entire variation range of all the parameters (Ioannou and Itard, 2015).
Global sensitivity analysis can evaluate the interaction effect, but it is a time-consuming and expensive method. The most widely used methods are Sobol, FAST, Random Balance Design, and the Monte Carlo method (Spitz et al., 2012). (Sobol, 2001) (Sobol’ and Kucherenko, 2009) (Saltelli et al., 2007) (Xu and Gertner, 2011).
To use the sensitivity analysis it is possible to set the studied model in the following form:
𝑦 = 𝑓(𝑥1, 𝑥2… … … 𝑥𝑛) = 𝑓(𝑥) ( 1-1 )
y is the model output and 𝑥 = [𝑥1, 𝑥2… … … 𝑥𝑛] is the set of parameters of the model.
To investigate the contribution of the model input parameters to the variation of its outputs, this method determines the parameters that have a strong influence on the model output and/or have high variability. The results are given in the form of the sensitivity indices that quantify the impact of the parameter 𝑥𝑖 on the output 𝑦. The greater the sensitivity index, the stronger the influence of parameter 𝑥𝑖 on the output.
30
1.4. Real performance exemples
As previously mentioned, today there is true awareness of the need to move forward toward energy-efficient buildings. This can be observed in the increased construction of these buildings in various countries. Some experience feedback on the real performance in operational phase of this kind of building can be used to better understand and evaluate the building’s performance.
Occasionally the performance predicted during the design stage is close to the real performance once a building is in use (Zhu et al., 2009) (Parker, 2009). For example, in (Gill et al., 2011) the authors studied the energy and water consumption for the annual energy and water performance of 25 houses and concluded that these individual dwellings performed efficiently in terms of electricity, heat, and water consumption. In (GSA Public Buildings Service, 2008), great potential results outperforming national averages for real energy performance were found for 14 buildings in terms of energy and water use, CO2 emissions, and
occupants’ satisfaction. Other examples, as in (Guerra-Santin et al., 2013b), when monitoring the energy performance of two low-energy building have shown that the dwellings perform close to the design expectations.
In some cases, buildings don’t perform as expected, facing a so-called “performance gap”, leading to overconsumption, poor indoor conditions etc. The causes behind this performance gap vary from building to building (Menezes et al., 2012). The authors of (Branco et al., 2004) compared predicted versus real heat consumption and concluded that the main gaps are due to occupant behavior (room temperature higher than predicted 22,5° over 20°C, etc.), the real performance of systems, and the real meteorological conditions. For this case, the envelope’s performance is close to the predicted value and represents, according to the authors, the basis of an energy-efficient building. The authors of (Thomsen et al., 2005) compared the target and the actual consumption of heating, electricity, and domestic hot water (DHW) consumption and indoor conditions for 12 advanced solar low-energy houses. The DHW consumption seemed to be well estimated. Regarding space heating and electricity consumption, the actual values were higher than expected. The authors concluded that the main causes are due to the building envelope’s performance (airtightness) and the system efficiency that did not perform as expected. The other main reason is due to the occupant behavior, regarding their preference for higher indoor air temperature than assumed or higher household appliances energy consumption. Other examples have shown (Audenaert et al., 2011) that user influence can generate certain unforeseen factors that interfere in the energy efficiency balance,
31 for instance, some areas of the house that are not heated, etc. In (Majcen et al., 2013) the authors used a large-scale study of Dutch housing to investigate their performance. The authors showed that for energy-efficient buildings the theoretical gas consumption is underestimated when compared with actual annual gas consumption. However, the real electricity consumption seems to be underestimated compared with the theoretical one. A well-designed and properly implemented envelope can support energy saving. Along with that, on-site production assured by well-sized photovoltaic and thermal systems can successfully achieved a net-zero-energy building as shown in (Fanney et al., 2015). The authors exposed some challenges regarding the building’s systems: for example, the snow and/or ice covering the photovoltaic and thermal solar system. Also the actual performance of the heat pump was less that the rated one. However, the gaps stemming from the stochastic aspect of the occupants were ignored. A virtual family was used here to simulate the impact on the building’s energy consumption of a typical family of four occupants. In some cases (Dall’O’ et al., 2012), when considering similar flats, the energy consumption gaps are fully due to the occupants’ behavior, regarding temperature settings, windows and shutters opening/closing, etc.
Summarizing all these points, several main causes of the performance gap can be identified, as explained in (de Wilde, 2014). These causes are encountered in the design phase, in the predicted performance, in the construction phase, and of course in the operational phase, within the building’s actual performance.
In the design phase, there are many unknown (lack of building and system details) or uncertain input factors (future occupancy, weather) that are used to predict the future performance. Moreover, even with a well-experienced user/modeler, the models are based on assumptions and simplifications, and therefore they are not always able to capture the entire process. The performance gap causes can also be rooted in the construction phase. Problems when the construction itself does not meet the target can be due to insufficient attention to the insulation and airtightness process, miscommunication, etc. (de Wilde, 2014). Furthermore, once the building is constructed, verification of its envelope’s performance is not always a straightforward and easy task. Many of the causes of the performance gap are often due to the occupants’ behavior during the operational phase. Future occupants are not always known in the design phase, and often deterministic assumptions are used to estimate future occupancy. However, the future use of electric household appliances, thermostat settings, window behavior, etc. cannot be fully predicted because of the stochastic nature of human behavior. Another cause of the performance gap in the operational phase is related to the fact that systems do not always operate as expected. Also, an important decision factor in the energy use of a building is the
32 unpredictable dynamic parameter represented by weather conditions. Numerous uncertainties are associated with the weather, and the robustness of the building’s design is often tested under extreme meteorological conditions (for example, heat waves). In the operational phase, another cause of performance gap can be due to the measurements. Once the sensors are installed, malfunctioning may occur in the data (outliers), in the network between the sensors, and in the data transmission, etc.
To sum up, as shown in (Li et al., 2014) no single factor (climate, occupancy, and envelope) determines the real energy performance. A global integrated design that takes into account all these factors could help produce the highest energy savings for energy-efficient building. However, buildings should provide not only the highest energy saving, but also a healthy and comfortable environment for the occupants. Therefore, the real energy performance should also take into account this aspect. Feedback on the occupants’ perception can help improve the design and refurbishment. For example, cases of cold floors were found in postoccupancy evaluations (Rohdin et al., 2014). The indoor thermal comfort and energy use, however, were found to be generally good and in line with predictions. Moreover, feedback on the real energy performance can help improve the occupants’ perception of the building’s energy management. For example, knowing that using the use of roller blinds for solar energy along with a lower set-point temperature during winter could help increase the energy savings. Also the use of roller blinds along with natural ventilation could provide better indoor conditions during summer. Understanding and evaluating the real energy performance should be able to identify if there is a performance gap and, if so, the factors contributing to it.
33
1.5. Findings
This chapter has presented the methods used to evaluate the energy performance of a building: monitoring and building performance simulation.
Monitoring depends on the purpose of the study and the performance indicators that are investigated in the study. For example, if the annual global performance is of interest, the monitoring is simple including only energy bills. However, when the focus is on a continuous global performance, the monitoring becomes more complex. It can involve monitoring of the total energy use or it can include monitoring of each end-use item (heating, appliances, etc.). The type of monitoring, its duration, and the size and placement of sensors also depend on the purpose of the study. In the context of evaluating the energy performance, the general focus of studies is on energy use and indoor conditions. The main conclusion here is that although there are a wide variety of studies in the literature, the monitoring can yield over-/underestimated values. To contribute on this fields, the present thesis proposes an effective application of monitoring used to evaluate the performance of a building.
Building performance simulation can be used as a complementary method to monitoring in the evaluation of the energy performance. Increased developments in simulation tools have been witnessed in the past few years. Simulations tools are successfully used to optimize the envelope’s and system’s characteristics during the design phase, to estimate their energy use, to test their performance using different climate files, to test different scenarios of occupation, etc. These physical components of the energy performance (envelope and systems) seemed to be more easily manageable in the simulation method and various examples exist on successful validation of the simulation models. However, studies have revealed that the occupants’ behavior represents a major source of uncertainty in predicting the energy performance of a building. This is mainly due to its stochastic nature and the complexity of predicting occupant’s behavior. Although various efforts are made regarding this aspect, there is still a lack of confidence when it comes down to including the occupants’ behavior in the simulation process. Considering the diversity, complexity, and uncertainty associated with each occupant, this is not a straightforward task. Within the present thesis, we use simulation to study the occupants’ behavior simulation by using a deterministic schedule and a statistical approach.
The present thesis seeks to enhance this field by presenting a single-family house case study in which both monitoring and building thermal simulation are used to for a continuous evaluation of the global performance of this house.
34
CHAPTER 2. Dispersions in energy use related to occupant’s
behavior: a numerical investigation in the design phase
2.1. Introduction ... 35 2.2. The case study: single-family detached home (PosA) ... 36 2.3. Deterministic schedule modeling ... 40
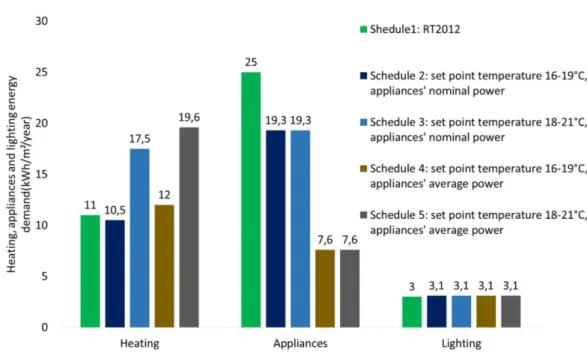
2.3.1. Modeling using the French thermal regulation RT2012 schedule ... 40 2.3.2. Modeling using the owner’s view schedules (schedule 2 to 5) ... 41 2.3.3. Summary of five deterministic schedules ... 45
2.4. Results using deterministic scenarios ... 46 2.5. Stochastic approach modeling ... 50
2.5.1. Agent-based behavioral model description ... 50 2.5.2. Integration into building performance simulation ... 51
2.6. Results using probabilistic scenarios ... 53
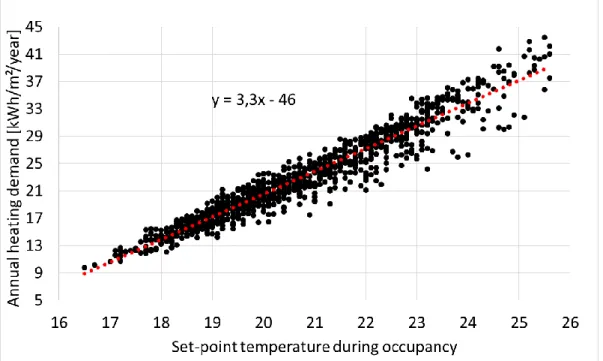
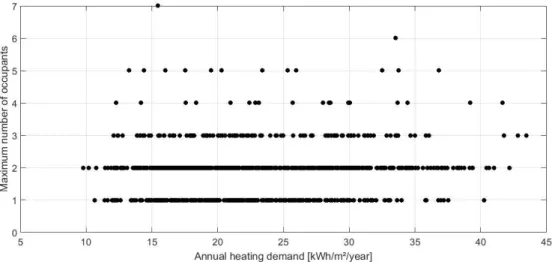
2.6.1. Heating demand... 53 2.6.2. Electrical appliances demand ... 56 2.6.3. Lighting demand ... 57 2.6.4. Annual energy balance ... 58