READ THESE TERMS AND CONDITIONS CAREFULLY BEFORE USING THIS WEBSITE. https://nrc-publications.canada.ca/eng/copyright
Vous avez des questions? Nous pouvons vous aider. Pour communiquer directement avec un auteur, consultez la première page de la revue dans laquelle son article a été publié afin de trouver ses coordonnées. Si vous n’arrivez pas à les repérer, communiquez avec nous à PublicationsArchive-ArchivesPublications@nrc-cnrc.gc.ca.
Questions? Contact the NRC Publications Archive team at
PublicationsArchive-ArchivesPublications@nrc-cnrc.gc.ca. If you wish to email the authors directly, please see the first page of the publication for their contact information.
NRC Publications Archive
Archives des publications du CNRC
This publication could be one of several versions: author’s original, accepted manuscript or the publisher’s version. / La version de cette publication peut être l’une des suivantes : la version prépublication de l’auteur, la version acceptée du manuscrit ou la version de l’éditeur.
Access and use of this website and the material on it are subject to the Terms and Conditions set forth at
An investigation on the accuracy and response rate of a lithium
chloride heated electrical hygrometer
Hedlin, C. P.; Trofimenkoff, F. N.
https://publications-cnrc.canada.ca/fra/droits
L’accès à ce site Web et l’utilisation de son contenu sont assujettis aux conditions présentées dans le site
LISEZ CES CONDITIONS ATTENTIVEMENT AVANT D’UTILISER CE SITE WEB.
NRC Publications Record / Notice d'Archives des publications de CNRC:
https://nrc-publications.canada.ca/eng/view/object/?id=4087c06f-3da6-40d0-b8ad-443172a718d7 https://publications-cnrc.canada.ca/fra/voir/objet/?id=4087c06f-3da6-40d0-b8ad-443172a718d7
64.
An Investigation of the Accuracy and Response
Rate of a Lithium Chloride Heated Electrical
Hygrometer*
National Research Council, Division of Building Research, Saskdchewan, Canada AND
Department of Electrical Engineering, University of Saskutchewan
ABSTRACT
The operation of these hygrometers depends on the fact that the electrical resistance of a salt film changes rapidly in the region near to the critical point. T h e application of a constant voltage across the salt film results in heating of the system to a temperature which i s characteris- tic of the ambient dew-point temperature.
T o assess the accuracy of these hygrometers, a series of measurements was made in the laboratory in the dew-point temperature range from -30 to SOOF. A straight line equation re- lating dew-point temperature and sensor tem- perature was obtained by using the method of least squares. The standard error was 0.4"F for the region above 32°F.
I n further experiments, the dependence of gensor temperature on temperature differential and on applied voltage was investigated. I n the latter case, voltages were varied i n the range from 0 to 120 V , and the corresponding temperatures and resistances were measured
in
the presence of $xed psychrometric conditions.I n experiments to assess the response time under normal operating conditions, at room
temperature, it was found that after a step change of 25°F i n the dew-point temperature, equilibrium was reestablished i n 10 to 15 minutes.
INTRODUCTION
For a number of years lithium-chloride heated electrical hygrometers have been used a t the Prairie Regional Station of the Division of Building Research for recording weather data and for other research work. This instru- ment has several desirable features. It can be used over a wide range of humidity; the result is given in terms of temperature which can easily be converted to a humidity value; and little maintenance is required.
An investigation of this unit has been carried out as part of a humidity instrumentation program, using a two-temperature recirculat- ing atmosphere producer1 as a calibrating standard. The initial calibration work was carried out by the second author as part of a graduate thesis program.
DESCRIPTION OF SENSOR
*
This paper is a contribution from the Division ofBuilding Research, National Rcscasch Council, nncl I n addition to commercial units, a number
is publlshcd with the approval of thc Dircctor of the of sensors constructed at the
628 M I S C E L L A N E O U S M E T H O D S
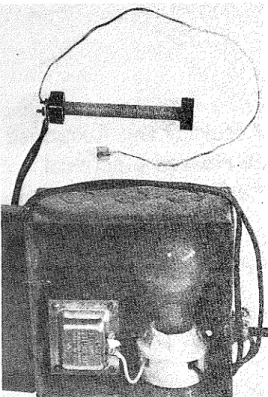
FIG. 1. Laboratory-built sensor and auxiliary equipment.
was limited. This type of sensor and associated power supply are shown in Fig. 1. I n one group of these sensors, the substrate consisted of a stainless steel tube, %-in. o.d., and 3% in. long. The tube was treated with an insulating varnish, and wound with a layer of glass-fiber tape. A bifilar coil of 0.025-in. silver wire was wound over the tape, the spacing between the wires being approximately 0.05 in. A thermo- couple, having good thermal contact with the walls, was placed in the geometrical center of the tube.
OPERATION
To put a sensor into operation, a dilute solution of lithium chloride is applied to the glass-fiber wick. A ballast lamp (50-watt, 32-V) is connected in series with the sensor, and 24 V are applied across the combination. The ballast lamp serves to limit the current to about 1.3 A during the start-up period, when the film is very moist and its resistance is low. As heat is generated, the film dries and its resistance increases markedly. After about 10
minutes, the resistance of the film becomes the limiting resistance of the circuit.
This hygrometer operates on the principle that the temperature of the salt film is regulated so that the vapor pressure of the water it contains will be equal to the water vapor pressure in the surrounding air. I n most systems, the temperature of the sensor is higher than that of the surroundings, but it could be used a t temperatures below ambient by employing a cooling system. For opera- tions a t any temperature above ambient, the usual method of supplying the necessary heat is to use the salt film as an electrical conductor, whose resistance R varies in accordance with the heat requirement by exchanging moisture with the surrounding air. A constant AC voltage E is applied to electrodes in contact with the salt film. Since the load is almost a pure resistance, the wattage dissipated as heat is W = E 2 / R . I n Fig. 2 , the variation of heat loss with temperature differential is shown for a commercial sensor.
RESPONSE RATE
A measure of the rate of response to a step change in humidity was made by using the atmosphere producer to provide one set of conditions and the room air for another. I n the
TEMPERATURE DIFFERENTIAL F * FIG. 2. Heat loss plotted against sensor air tem- perature difference. Air movement varied from still to roughly IqO fpm. Sensor was approximately 4 in. long and Y f s in. in diameter; axis was horizontal. Solid dots-no shield; open circles-shield in place.
64. H E A T E D E L E C T R I C A L HYGROMETER
r
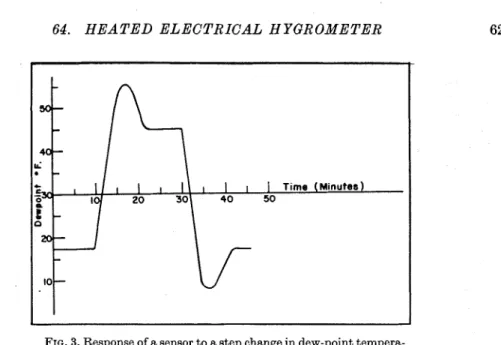
FIG. 3. Response of a sensor to a step change in dew-point tempera- ture. In the first run, the dew-point temperature was increased; in the second, it was decreased.
f i s t , the dry-bulb temperature was 60°F and the dew-point temperature was 17°F. I n the room, the dry-bulb temperature was 72°F and the dew-point temperature was 45°F. The step change was arranged by the simple ex- pcdient of rapidly withdrawing or inserting the sensor into the atmosphere producer. I t s behavior is illustrated in Fig. 3. The response time for such a change was found to be about 15 minutes, both for increasing and decreasing dew points.
CALIBRATION
In the first phase of calibration work, four of the laboratory-built sensors were investi- gated in the atmosphere producer. These were placed in the calibrating chamber in pairs since this was all that the space would con- veniently hold. Electrical and thermocouple connections were provided in the cover of the calibration chamber. The sensor temperatures were measured using copper-constantan ther- mocouples. A precision potentiometer was used to measure thc EMF, and an ice bath was used as a reference junction. The temperature mcasurcments may be regarded as accurate to within f 0.2 Fahrenheit degree. A series of sensor temperatures was obtained for dew- point temperatures ranging from 0 to 80°F.
Conover2 observed an abrupt change in the temperature indicated by this hygrometer
when the dew-point temperature was raised above 10°F after remaining below that value for some time. He attributed this behavior to the change of the salt from the dihydrate to the monohydrate state. Conover gave a tempera- ture of 55°F for this transition point, while Mellor3 gives two possible values, 54.5"F and 70.7"F. At the NRC Division of Building Research, Ottawa, a sudden drop in sensor temperature was observed to occur after i t had been exposed to a fixed dew-point tempera- ture of -15°F for about 6 hours. A new equilibrium temperature was eventually reached about 5 Fahrenheit degrees below that which existed before the change. A reverse transition occurred a t a dew-point tempera- ture of about 6°F.
A number of transitions have been noted in routine operation of a cell set up to measure atmospheric dew point a t the Prairie Regional Station. Several hvdration transitions oc- curred a t a sensor temperature of about 50°F (dew point = 0°F) 6 or 7 hours after having crossed the 65°F t e m ~ c r a t u r e line. Several dehydrations were found to have occurred a t a temperature between 60 and 65°F. Where the temperature is continuously recorded, such transitions may be fairly readily identified. When the temperature is recorded periodi- cally, however,-the transitions may be mis- taken for change in air condition.
630 M I S C E L L A N E O U S M E T H O D S
detail, a commercial heated electrical hygrom- eter was placed in the atmosphere producer a t the Prairie Regional Station and calibration was carried out for dew-point temperatures in the range from $18 to -24.5"F.
When the dew-point temperature was lowered by steps, the sensor temperature
TABLE 1. VALUES OBTAINED FROM EXPERIMENTAL DATA IN THE DEW-POINT TEMPERATURE REGION
BELOW 12'F
1, 1,
Dew Point (dihydrate) (monohydrate)
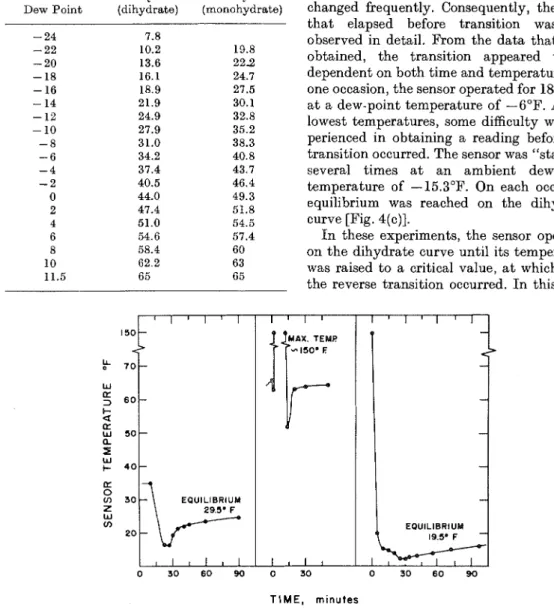
followed the monohydrate line, reaching equilibrium after each change and giving stable readings. When the transition to the dihydrate level occurred, however, the tem- perature dropped rapidly to a level 6 or 8 degrees below the final value and then gradually rose to it [Fig. 4(a)]. Such transitions were observed to occur a t dew-point tempera- tures ranging downward from 0°F. Most of the attention was paid to the relationship between the sensor temperature and dew-point tem- perature, and the dew-point temperature was changed frequently. Consequently, the time that elapsed before transition was not observed in detail. From the data that were, obtained, the transition appeared to be dependent on both time and temperature. On one occasion, the sensor operated for 18 hours a t a dew-point temperature of -6°F. At the lowest temperatures, some difficulty was ex- perienced in obtaining a reading before the transition occurred. The sensor was "started" several times a t an ambient dew-point temperature of -15.3"F. On each occasion, equilibrium was reached on the dihydrate curve [Fig. 4(c)].
I n these experiments, the sensor operated on the dihydrate curve until its temperature was raised to a critical value, a t which time the reverse transition occurred. I n this case,
T I M E , m i n u t e s
FIG. 4. (a) Sensor temperature vs time during transition from the monohydrate t o the dihydrate level. (b) Temperature vs time during the transition to thc inorlohydrate level. (c) Tcrnperature vs tiino during a "start-up."
64. HEATED ELECTRICAL HYGROMETER
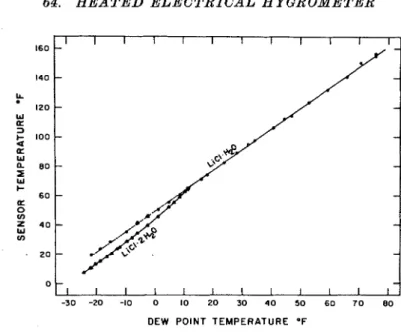
FIG. 5. Calibration curves for lithium chloride heated electrical hygrometer. The line through the monohydrate data is represented by the equation t, = 49.3
+
1.404 td. 160 140 120 I 0 0 8 0 6 0 4 0 2 0 0the appearance was similar to that of a normal start-up [Fig. 4(b)]. The sensor resistance dropped to a low value and its temperature rose as a result of the release of moisture due to the transition to the monohydrate form. I n the work a t the Prairie Regional Station, this transition occurred a t about 65"F, but the sensor operated in a stable manner until that
-30 -20 -10 0 10 20 30 4 0 50 60 7 0 80 DEW POINT TEMPERATURE O F
I I I I I I I I I I I I
-
-
-
- --
-
-
--
--
-
-
-
-
-
-
I I I I I I I I I I Itemperature was reached.
A second quadruple point exists for the monohydrate and the anhydrous salt in the
a region of 210°F. This region was traversed by
raising the dew-point temperature, but no transition was observed.
'
An equation to relate the sensor tempera- ture, t,, and dew-point temperature, td,
was obtained by fitting a straight line to the data between 32°F dew point and 80°F dew point. The standard error was about 0.4 deg F
(Fig. 5).*
There appears to be a slight curvature in the data. with the result that some error exists. For example, the equation predicts a sensor temperature that is too low by roughly 1 Fahrenheit degree a t the lower end of the curve. One would expect a break to occur a t
*
Only representative points are shown above 3Z°F dew point.32"F, since the dew-point temperatures are referred to ice. When the data for the mono- hydrate below 32°F dew point were included, however, very nearly the same result was obtained. Thus, with quite good accuracy, this equation applies for the monohydrate for dew-point temperatures from 80°F down to the lowest values that were investigated. Data for the region below 12°F dew point are given in Table 1.
VARIATION OF SENSOR TEMPERATURE AT FIXED DEW-POINT TEMPERATURE The vapor pressure exerted by the salt film on this type of hygrometer is sometimes assumed to be equal to that of a saturated solution of the salt a t the same temperature. Practical experience indicates that this as- sumption is substantially correct. If the vapor pressure and temperature characteristics of the two do coincide, however, the sensor temperature should vary only with the dew- point temperature and should be independent of limited variations in the applied voltage, and of the ambient temperature as long as it is below that of the sensor.
In one series of experiments, a sensor was "started" with fixed dew-point and ambient temperatures, but the voltage was varied. The
MISCELLANEOUS METHODS
VOLTAGE TEMPERATURE SENSOR DIFFERENTIAL F a RESISTANCE (lo FIG. 6. (a) Sensor temperature us applied voltage. Dew-point tem- perature, 18.0°F; ambient temperature, 50.5"F. (b) Variation in sensor temperature with variation in sensor-ambient air temperature difference. (c) Sensor temperature us sensor resistance. Sensor was not operated; the temperature of the air was varied. Dew-point tempera- ture, 26.SDF.
sensor was allowed to drive off the moist,ure in the usual manner, but a t about the time it reached the maximum temperature in the start-up process, the applied voltage was set a t the desired value and the sensor was then allowed to come to an equilibrium tempera- ture. The sensor was carefully washed between each "start." The excess water was removed, and a solution of the salt was poured over it, preparatory to the next observation. The equilibrium temperatures and voltages are shown in Fig. 6(a). From measurement of the current flow, sensor resistance was also found. I n a second series of experiments, a sensor was operated in the usual manner. The dew- point temperature was held constant a t 17.5"F, and the ambient temperature varied in the range from 19.5 to 72.7"F [Fig. 6(b)].
I n another experiment, with a constant dew point of -26.5"F, a temperature-resistance relationship was obtained by raising the ambient temperature above the normal value for the sensor and measuring the sensor resis- tance as the temperature was lowered by steps [Fig. 6(c)]. I n this case, the normal voltage was not applied to the sensor; a small AC voltage was applied briefly for each resistance measurement.
All three of these experiments indicated that small variations in sensor temperature may
occur independently of the dew-point tem- perature, introducing errors up t o roughly 1% deg F.
To obtain an approximate measure of the usual departure of the salt on the hygrometer from the critical condition, a laboratory-built
I
W
Cn SAT SOLN T E M P
SENSOR RESISTANCE ( K )
PIG. 7. The plots of sensor temperature us sensor resistance. Sensors were operated over a saturated solution of lithium chloride which was a t 86.0°F. Sensor resistance was varied by changing the applied voltage.
6 4 . H E A T E D E L E C T R I C A L HYGROMETER 633
sensor was operated in a sealed flask over a saturated solution of lithium chloride. The voltage was varied by steps and resistance of the sensor was measured a t each point. I n general, operating sensor resistance will probably be in the range from 200 to 5000 Q. I n Fig. 7 , this corresponds to a temperature range of about
%
to 1% Fahrenheit degrees above that of the saturated solution.Following small decrements in voltage, equilibrium was usually reached within a n hour. Following small increments of voltage, however, particularly in the low-temperature portions of the curves, approach to equilibrium was exceedingly slow.
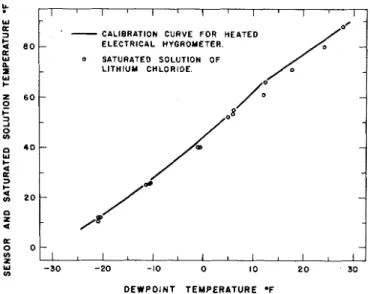
A more direct method of observing this difference is that of comparing data for the saturated liquid with the sensor calibration curve (Fig. 8). It is apparent here also that the temperature of an operating sensor generally exceeds that of a saturated solution which is a t the same dew-point temperature.
These experiments indicate that this hy- grometer operates a t a temperature somewhat higher than i t would if the lithium chloride was a t the critical condition. Through varia- tion in temperature differential, i t is apparent that the scnsor temperature may vary by as much as 1 Fahrenheit degree under normal operating conditions. From operation of the
sensor over a saturated solution of lithium chloride, i t appears that the operating range may be
%
to 1% Fahrenheit degrees above that of the saturated solution.CONCLUSION
The lithium chloride heated electrical hygrometer normally operates a t a higher temperature than i t would if the salt were in the condition of a saturated solution. Because of the relationship between sensor temperature and sensor resistance, it will probably operate in a temperature range whose extreme limits during normal operations are approximately
%
to 1% Fahrenheit degrees above that of a saturated solution. As a result of this varia- bility, a small inherent error exists.A more important error may occur in the dew-point temperature region immediately below 11.5"F. I n this region, two hydrate levels occur and the sensor may operate on either one. The dew-point temperature in- dicated by the two hydrate levels is the same a t a dew-point temperature of 11.5"F; i t differs by approximately 3 Fahrenheit degrees a t 0°F dew-point temperature. Because the difference is greater a t lower temperatures, i t is necessary to exercise caution when measure- ments are made in this region. Under the con-
DEWPOINT TEMPERATURE .F
FIG. 8. Comparison of the calibration curve for a lithium chloride heated electrical hygrometer with the corresponding data for saturated lithium chloride solutions.
634 M I S C E L L A N E O U S M E T H O D S
trolled conditions in an atmosphere producer, operation on the monohydrate line was ob- served a t dew-point temperatures down to -22°F. A limited number of observations on an outdoor installation, however, suggest that transition to the dihydrate level often occurs in the region of 0°F dew point in the practical case. The reverse transition occurred a t approximately 11.5"F dew point in the atmosphere producer and in the region be- tween 8 and 11°F dew point in the outdoor installation.
Calibration of the lithium chloride heated eiet:trical hygrometer has shown that the relationship between the sensor temperature and the dew-point temperature is nearly linear for the monohydrate level over much of the normal operating range when the dew-
point temperatures below 32°F are referred to ice. Within the dew-point temperature range from -20 to +70°F, the calibration curve does not deviate from the best fitting straight line by more than about 1 Fahrenheit degree dew point.
References
1. Till, C. E., and Handegord, G. O., "Proposed Humidity Standard," Trans. A S H R A E , 66,
288-308 (1960).
2. Conover, J. H., "Tests and Adaptation of tho Foxboro Dewpoint Recorder for Weather Observatory Use," Bull. A m . Meteorol. Soc., 31,
13-22 (1950).
3. Rlollor, J. W., "A Comprehensivo Treatiso on Inorganic and Theoretical Chemistry," Vol. 2, p. 542, New York, Longmans, Green & Co., 1927.