Computational Methodologies and Resources for
Discovery of Phosphorylation Regulation and
Function in Cellular Networks
MASSACHUSES INSTIVJEby
AUG 16
2010
Kristen M Naegle
LIBRARIES
S.M. Biological Engineering, M.S. Electrical Engineering, B.S.
Electrical Engineering
Submitted to the Department of Biological Engineering
in partial fulfillment of the requirements for the degree of
Doctor of Philosophy in Biological Engineering
at the
MASSACHUSETTS INSTITUTE OF TECHNOLOGY
June 2010
©
Massachusetts Institute of Technology 2010. All rights reserved.
A uthor ...
7
. ... ...
,.
...
Department of Biological Engineering
'A May 21, 2010
Certified by ...
7...
Douglas A. Laffenburger
Professor
Thesis Supervisor
/oAAAccepted by...
. .. .... . . . . .Darrell Irvine
Chairman, Department Committee on Graduate Students
This Doctoral Thesis has been examined by the following Thesis Committee:
Douglas A. Lauffenburger, Ph.D. Professor of Biological Engineering Massachusetts Institute of Technology
Forest M. White, Ph.D. Thesis Committee Chair
Associate Professor of Biological Engineering Massachusetts Institute of Technology
Michael B. Yaffe, Ph.D.
Professor of Biological Engineering and Biology Massachusetts Institute of Technology
Computational Methodologies and Resources for Discovery
of Phosphorylation Regulation and Function in Cellular
Networks
by
Kristen M Naegle
Submitted to the Department of Biological Engineering on May 21, 2010, in partial fulfillment of the
requirements for the degree of
Doctor of Philosophy in Biological Engineering
Abstract
Post-translational modications (PTMs) regulate cellular signaling networks by mod-ifying activity, localization, turnover and other characteristics of proteins in the cell. For example, signaling in receptor tyrosine kinase (RTK) networks, such as those downstream of epidermal growth factor receptor (EGFR) and insulin receptor, is initiated by binding of cytokines or growth factors, and is generally propagated by phosphorylation of signaling molecules. The rate of discovery of PTM sites is increas-ing rapidly and is signicantly outpacincreas-ing our biological understandincreas-ing of the function and regulation of those modications. The ten-fold increase in known phosphorylation sites over a five year time span can primarily be attributed to mass spectrometry
(MS) measurement methods, which are capable of identifying and monitoring
hun-dreds to thousands of phosphorylation sites across multiple biological samples. There is significant interest in the field in understanding these modifications, due to their important role in basic physiology as well as their implication in disease. In this thesis, we develop algorithms and tools to aid in analysis and organization of these immense datasets, which fundamentally seek to generate novel insights and testable hypotheses regarding the function and regulation of phosphorylation in RTK networks. We have developed a web-accessible analysis and repository resource for high-throughput quan-titative measurements of post-translational modifications, called PTMScout. Addi-tionally, we have developed a semi-automatic, high-throughput screen for unsuper-vised learning parameters based on their relative ability to partition datasets into functionally related and biologically meaningful clusters. We developed methods for comparing the variability and robustness of these clustering solutions and discovered that phosphopeptide co-clustering robustness can recapitulate known protein inter-action networks, and extend them. Both of these tools take advantage of a new linear motif discovery algorithm, which we additionally used to find a putative regulatory sequence downstream of the highly tumorigenic EGFRvIII mutation that indicates casein kinase II (CK2) activity may be increased in glioblastoma.
Thesis Supervisor: Douglas A. Lauffenburger Title: Professor
Acknowledgments
I have had the great fortune of being part of a wonderful and collaborative research
environment at MIT. In particular, the Lauffenburger and White labs have provided a respectful and fantastic place to work. Every individual within these labs has been generous with their time and ideas, which in various ways, has contributed a great deal to the success of this work. In particular, I would like to thank the following people in these labs for their contributions to my education and research: Megan Palmer, Arthur Goldsipe, Brian Joughin, Melissa Gymrek, Pam Kreeger, Shannon Alford, Hyung Do Kim, Ben Cosgrove, Dan Kirouac, Joel Wagner, Justin Pritchard, Stacey Pawson, Emily Miraldi, Alejandro Wolf-Yadlin, Josh Apgar, Paul Huang, Bracken King, Carol Huang, and Mark Fleury.
A special thanks to each of my committee members, Douglas Lauffenburger, Forest
White, and Michael Yaffe; I had the joy of being closely advised by all of them throughout my Ph.D. work. I would like to especially thank Doug Lauffenburger for always believing in my work and in me as a researcher. He is an ideal advisor and I wish all graduate students could have the experience I have had. I had the fortune of collaborating with Roy Welsch, which was essential to my understanding of multiple hypothesis correction. Brian Joughin has been a great source of both scientific advice and technical support as well as a pleasure to work with. Without Melissa Gymrek, PTMScout would not have been possible; she made a dream come true when she developed the web interface to the database I had developed.
I would like to thank Medtronic for funding my first year of work, the Siebel
Foundation for funding the last year of work, and ICBP and CDP for funding the years in between.
I would like to thank my parents for always supporting me. This milestone could
not have been possible without John Naegle, my wonderful husband of eight years. He has supported me, unconditionally, in everything I have attempted. He is a wonderful person, husband and father.
Contents
1 Introduction 17
1.1 A role for post-translational modification in the cell . . . . 17
1.2 Receptor tyrosine kinase networks and the epidermal growth factor receptor . . . . 21
1.3 Global phosphorylation measurements of RTK networks . . . . 24
1.4 Tools and repositories for high-throughput phosphoproteomic measure-m ents . .. . . . . 26
1.5 Motivation of global phosphoproteomic measurement.. . . . . . . 28
1.6 The present work . . . . 29
2 An Integrated Comparative Phosphoproteomic and Bioinformatic Approach Reveals a Novel Class of MPM-2 Motifs Upregulated in EGFRvIII-Expressing Glioblastoma Cells 33 2.1 Sum m ary . . . . 33
2.2 Introduction... . . . . . . . . . .. 34
2.3 R esults . . . . 37
2.4 M ethods . . . . 45
2.4.1 Cell Culture and Retrovirus Infection . . . . 45
2.4.2 Cell lysis, Protein digestion and Peptide fractionation . . . . . 47
2.4.3 iTRAQ labeling of peptides and immunoprecipitation . . . . . 47
2.4.4 Immobilized metal affinity chromatography (IMAC) and Mass Spectrom etry . . . . 48
2.4.6 Phosphopeptide library array . . . . 49
2.4.7 Determination of MPM-2 selectivity . . . . 50
2.4.8 Preparation of data for motif enrichment analysis . . . . 50
2.4.9 Enriched motif search . . . . 51
2.4.10 Motif significance calculation . . . . 51
2.4.11 Empirical analysis of false positive rate.. . . . . . 52
2.5 Conclusions .. . . . ..52
3 PTMScout: A Web Resource For Analysis of High-Throughput Post-Translational Proteomic Studies 57 3.1 Sum m ary . . . . 57
3.2 Introduction .. . . . . . . 58
3.3 R esults . . . . 62
3.3.1 Activating kinase events in the EGFR pathway . . . . 66
3.3.2 Focal adhesion signaling in response to EGF . . . . 69
3.3.3 Assignment of Src family kinase activation loop phosphoryla-tion sites . . . . 72
3.3.4 Unsupervised learning highlights roles for proteins in endocy-tosis of EG FR . . . . 74
3.3.5 Trypsin is potentially limiting in measurement of acetylation and '[GS]k' is an acetylation motif specific to RNA binding proteins . . . . 76
3.4 M ethods . . . . 79
3.4.1 Database and data resources.. . . . . . . . 79
3.4.2 Calculations.. . . . . . . . 81
3.5 Conclusions... . . . . . . . . . 83
4 High-Throughput Quantitative Phosphoproteomic Dataset Analysis Using Combinatorial Parametric Unsupervised Learning 85 4.1 Sum m ary . . . . 85
4.3 R esults . . . . 89
4.3.1 Evaluation of unsupervised learning parameters in the EGF7 d ataset . . . . 92
4.3.2 Inferring phosphosite-specific signaling layers through robust co-clustering.. . . . . . . . .. 100
4.4 Methods ... ... 109
4.4.1 Dataset preparation and biological term annotation . . . . 109
4.4.2 Clustering . . . . . . . .. . 111
4.4.3 Enrichment, multiple hypothesis correction and parameter re-finem ent . . . . 112
4.4.4 Mutual information calculation and selection . . . . 113
4.4.5 Co-Occurrence calculations and network analysis . . . . 113
4.5 Conclusions... . . . . . . . . . . 114
5 Concluding Remarks and Future Directions 123 5.1 Experimental support for derived hypotheses . . . . 123
5.2 The phosphoproteome . . . . 124
5.3 Limitations of MS phosphoproteomic measurement . . . . 126
5.4 Expansion of PTMScout . . . . 128
5.5 The next steps in high-throughput unsupervised learning analysis . . 129
5.6 Bringing it all together: modification codes . . . . 130
A Information and Materials for Chapter 2 133 A.1 Motif enrichment tables for EGFRvIII vs. DK . . . . 133
A.2 CK2 activity measurements in EGFRvIII expressing cells . . . . 134
A .2.1 Protocol . . . . 134
A.2.2 TBCA inhibitor control . . . . 135
A.3 MPM-2 degenerate peptide library quantitation . . . . 135
B PTMScout Database Schema 137
D Licenses 143
List of Figures
1-1 The ErbB network . . . . 23
1-2 Trends in network coverage of the ErbB system . . . . 26
2-1 Experimental workflow for MS discovery of phosphorylation . . . . . 36
2-2 Degenerate library screen of MPM-2 specificity . . . . 42
2-3 Empirical false positive control for motif enrichment . . . . 46
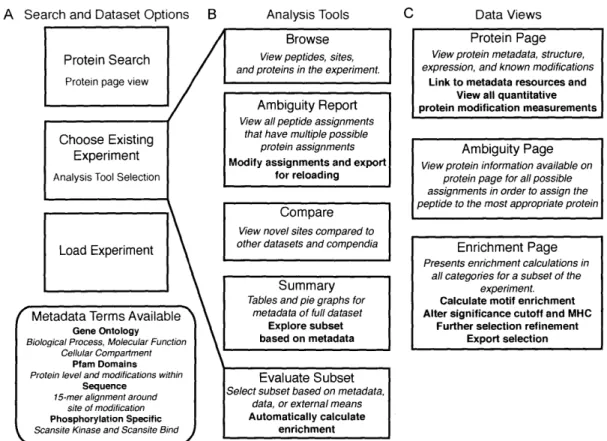
3-1 A depiction of the major features, analysis tools, and page view types available in PTM Scout. . . . . 61
3-2 PTMScout schema depiction . . . . 64
3-3 Kinase phosphorylation downstream of EGFR activation . . . . 68
3-4 BCAR1 a central node between FA and EGFR signaling . . . . 71
3-5 BCAR1 measurements in a HER2 system . . . . 72
3-6 An endocytic cluster of EGFR signaing . . . . 76
3-7 Trypsin limitation in measurement of acetylation . . . . 78
4-1 Changes in parameters during unsupervised learning impact the final clustering solution.. . . . . . . . . 90
4-2 The workflow and terminology of parametric combinatorial analysis of biological datasets. . . . . 93
4-3 Unsupervised learning parmeters and biological enrichment dependen-cies. . . . . 9 5 4-4 Pairwise comparison of sets based on biological enrichment . . . . 97
4-6 Enrichment results in MCAfina for the EGF7 dataset... . .. 101
4-7 Robust co-clustering as a method of network inference. . . . . 103
4-8 Robust co-clustering recapitulates known EGFR interactions and can generate supergroups of partitioned phopshopeptides. . . . . 105
4-9 Top rankings for multiply phosphorylated docking proteins of EGFR. 107 4-10 Group network statistics based on the co-occurrence cutoff. . . . . 108
4-11 The probability distribution of the co-occurrence matrix . . . . 110
4-12 Supergroup architecture: cutoff=80 . . . . 118
4-13 Supergroup architecture: cutoff=120 . . . . 119
4-14 Supergroup architecture:cutoff=200 . . . . 120
4-15 Supergroup architecture:cutoff=240 . . . . 121
4-16 Supergroup architecture:cutoff=300 . . . . 122
5-1 Number of phosphorylations per protein in the human proteome . . . 125
A-I TBCA inhibition control of CK2 activity assay . . . . 135
List of Tables
1.1 Example post-translational modifications . . . . 18
2.1 MS detected MPM-2 substrates in U87 EGFRvIII expressing cells . . 39
2.2 EGFRvIII regulated targets recognized by MPM-2, U87-H vs. U87-DK 44
3.1 Reference datasets for PTMScout evaluation . . . . 63
3.2 Alignment of c-terminal tails of human Src family kinases . . . . 69
3.3 GO Molecular Function and Pfam domains in a large acetylation
ex-perim ent . . . . 79
4.1 Description and categorization of metrics. . . . . . 91
4.2 The parameters considered across multiple iterations of MCA creation
and the parameter subset used for MCAjina. . . . . 94
A.1 EGFRvIII regulated targets recognized by MPM-2,U87-M vs. U87-DK 133 A.2 EGFRvIII regulated targets recognized by MPM-2,U87-SH vs. U87-DK 134 A.3 MPM-2 degenerate peptide library quantitation . . . . 136 C .1 Code statistics . . . . 141
Chapter 1
Introduction
1.1
A role for post-translational modification in
the cell
Cellular organisms encode their genetic information in the form of four nucleic acids. During transcription, this information is transcribed into another set of four nucleic acids. During translation this information is then translated into yet another set of chemical information: amino acids. Proteins, the fundamental functional unit of the cell, are composed of these twenty amino acids. It turns out that these twenty amino acids represent only a small fraction of the possible chemical entities that can compose a protein, since the cell has one more mechanism of control available, post-translational modification. Post-translational modifications (PTM) all entail the covalent transfer of a biochemical entity to a particular amino acid residue within the target protein following, or in tandem with, translation. These biochemical entities can range from small molecules, such as a phosphate group, to large protein segments, such as ubiquitin. The effect of this covalent modification on protein function is as diverse as the range of possible modifications. Table 1.1 demonstrates a sampling of the various types of post-translational modifications, the residues they modify, and examples of their resulting cellular effects. In March of 2010, Uniprot, a repository for protein information, contained controlled vocabularies for 405 post-translational
modifications representing roughly 200 different types of functional groups.
Table 1.1: Examples of post-translational modifications. Post-translational modifica-tions capitalize on a variety of different functional groups, yielding a diverse repertoire of molecular functional control.
PTM Functional Group Protein Example Effects
Side
Chain
Phosphorylation phosphate Y,S,T,H enzymatic activity
protein-protein interactions
Acetylation acetyl group N- histone code
terminal,
K
binding
Palmitoylation fatty acid C membrane association
protein-protein interactions
Glycosylation saccharides N, S, T, protein folding
OH-K
Ubiquitination ubiquitin (8.5kDa protein) K protein stability
degradation
SUMOylation SUMO (12kDa protein) K binding
nuclear import
The covalent modification of a protein requires the assistance of an enzyme and
in some cases, such as ubiquitination, the assistance of multiple enzymes [61]. In
the case of reversible modifications, complementary enzymatic processes exist for the removal of the modification. The use of post-translational modification allows the cell to quickly alter the function and regulation of proteins within the cell. This is a marked difference between transcriptional control circuitry, which can require thirty minutes to several hours to effect change and post-translational control, which can take only seconds. This use of cellular control is not only fast, but can also be tightly regulated.
Phosphorylation, a post-translational modification that involves the transfer of a phosphate group from a donor ATP molecule, is highly utilized in the cell. It has been thought that at least 30% of human proteins undergo phosphorylation [16]. Although there are several residues capable of phosphate addition, the majority of stable eukaryotic phosphorylations exist on serine, threonine and tyrosine amino acid
side chains. Protein kinases and phosphatases are the enzymes responsible for phos-phorylation and de-phosphos-phorylation, respectively, of target proteins. Kinases are one of the largest family of proteins in the human proteome consisting of 518 catalogued members, which constitutes roughly 1.7% of all human genes [64]. Identification of phosphatases reveals a smaller family of proteins, however the number of tyrosine phosphatases roughly matches the number of tyrosine kinases in the human pro-teome [3]. Both protein tyrosine kinases and phosphatases have been implicated in a variety of diseases [52,73,113]
A primary function of phosphorylation is the alteration of a protein's enzymatic
activity. For example, phosphorylation within the activation loop segment of a ki-nase catalytic domain increases its enzymatic activity through conformational alter-ations [75]. In addition to altering enzymatic activities, another primary role of phos-phorylation is to induce protein-protein interactions and protein localization changes. Several phosphopeptide binding domains exist which recognize phosphorylated forms of an amino acid sequence [128] such as Src homology region 2 (SH2) domains, phos-photyrosine binding domains (PTB), 14-3-3 domains, and WW domains. Given the specific nature of phosphopeptide domain recognition, a protein containing such a domain and a protein containing a cognate phosphorylation sequence can be made to interact in a temporal- or condition-specific manner. These proteprotein in-teractions can lead directly to controlled localization of proteins. For example, the phosphorylation of a transcription factor, STAT, induces dimerization, the product of which can then be imported into the nucleus [18].
The linear amino acid sequence directly surrounding the site of phosphorylation plays an important role in the recognition of the sequence by kinases and binding domains. Kinase-target specificity is a combination of additional factors, including the proximity of the kinase and target as a result of adaptor or scaffolding proteins
[11]. Information regarding phosphatases has, and remains, limited in scope. In the past, it has been assumed regulation of receptor tyrosine kinase (RTK) networks is primarily controlled by regulation of kinases and that phosphatase activity and quantity is uniform in time. However, phosphatase mutations have been implicated
in cancer [73, 113] indicating an important role for the regulation of phosphatases in cellular signaling networks as well. It is now thought that the balance of both positive and negative regulators control duration and amplitude of RTK stimulated responses. It is believed that protein tyrosine phosphatases, like protein tyrosine kinases, recognize their targets in part by the specific linear sequence surrounding a phosphorylated residue [117].
De niovo prediction of the function and regulation of phosphorylation modifications
is a difficult problem given the complicated functional role of phosphorylation and its control by two separate enzymatic processes. A study by Kumar et. al. [55] showed that even "canonical" phosphorylation functions are situation dependent. There is no blanket statement regarding the general activity increase or decrease in signaling networks due to phosphorylation. For example, phosphorylation of Src family kinase domains on the activation loop (Y415) increases enzymatic activity. However, phosphorylation of its cytoplasmic tail (Y527) by the kinase Csk produces a Src-SH2 binding recognition site, which inhibits kinase catalytic activity through
protein conformational changes [6]. Phosphorylation of the phosphatase Shp-2 on
Y580 increases the activity of the phosphatase [62], thereby generally decreasing the
phosphorylation on targets of Shp-2.
A resource for the repository of known phosphorylations in proteomes of many
species, Phospho.ELM, included 1,703 known phosphorylation sites in 2004 when
it was first published [23]. By 2009, that number had increased more than
ten-fold to almost 20,000 documented phosphorylation sites [22]. This indicates a rapid expansion in the characterization of new sites of phosphorylation within cells across many species. In combination with the complexity of the regulation and function of phosphorylation within cells and signaling networks, this expansion represents an active area of ongoing research.
1.2
Receptor tyrosine kinase networks and the
epi-dermal growth factor receptor
A specific class of proteins in the cell, receptor tyrosine kinases (RTK), monitor
ex-tracellular cues and translate these cues into phenotypic outcomes, primarily through the utilization of phosphorylation as a regulatory mechanism. Most receptor tyrosine kinases contain an extracellular binding region, a transmembrane spanning region, and a cytoplasmic kinase catalytic domain. The typical first steps in RTK activation involve two receptors binding their extracellular ligands followed by receptor dimer-ization, activation, and then cross-autophosphorylation. Autophosphorylation events on the receptors are numerous and occur extensively on the cytoplasmic tail of the re-ceptors. These phosphorylation sites can then recruit other signaling proteins. Once recruited to the receptors, those proteins are then phosphorylated and go on to effect a cascade of changes in the cell that will eventually lead to a discernible phenotypic outcome, such as migration, proliferation, differentiation, structural changes, or basic functional increases and decreases, such as glucose uptake. A second class of recep-tors rely on the same network principles, but have no native kinase function and rely on the recruitment of cytosolic kinases in place of autophosphorylation ability. An important example of this is the interleukin family of receptors, which are essential components of immune system functionality.
Despite the wide diversity of RTK families, such as the insulin receptor, fibroblast growth factor receptors, epidermal growth factor receptors, Met, and neuronal growth factor receptors, there are a relatively small number of common downstream path-ways utilized across these receptor systems. These pathpath-ways include the PI(3)K/Akt, Jak/Stat, Plc-y/PKC, and Ras/MAPK pathways [34]. The control of these and other pathways in RTK networks can result in transcriptional changes, metabolic and cy-toskeletal changes, which drive phenotypic alterations such as proliferation, differen-tiation, and migration. Another common feature of these networks is their negative regulation, which is driven primarily by two mechanisms: (1) dephsophorylation on network components following signaling activation and (2) downregulation of the
re-ceptor by endocytosis. It is thought that recycling and degradation of the rere-ceptor works to desensitize the immediate future response of the cell to the extracellular cue, as well as to establish a differential signaling mode, compared to signaling from the plasma membrane [12]. Differential EGFR signaling from the plasma membrane, ver-sus from the endocytic compartment, is just one example of the spatial localization of RTK signaling networks. Lipid rafts, focal adhesions, endosomes and the nucleus are just a few of the cellular compartments that can function as important and specific
locations for cellular signaling.
The epidermal growth factor receptors, known as either HER or ErbB receptors, are an important receptor tyrosine kinase family involved in a variety of cellular and tissue functions. They play an especially important role in the differentiation and development of epithelial tissues such as lung, heart, brain, and breast tissues. There are four members of the ErbB family, which recognize a variety of ligands, see Figure
1-1 [131]. ErbB family members have been implicated in the progression and severity
of a number of cancers including glioblastoma [81] and breast [15], lung [68], and ovar-ian cancer [100]. Several veins of therapeutic development have focused on the EGFR family and its network components. For example, gefitinib (Iressa, AstraZeneca) and erlotinib (Tarceva, Genentech) are ATP analogs specific to EGFR, which are effec-tive in the treatment of cancers expressing EGFR mutants with increased catalytic activity [63,80]. ErbB family antibodies are another avenue of successful therapeutic development, such as trastuzumab for breast cancer (Herceptin, Genentech) and ce-tuximab (Brystol Meyers Squibb BMS/ImClone) for colorectal cancer and neck and
squamous cell carcinoma.
Scientists have employed a variety of modeling techniques as they have sought to understand the underlying biochemical structure of RTK networks. These models serve as a framework for testing our current understanding of the network as well as allowing for in silico perturbation experiments, such as inhibition of a network component by a drug. Just as experimental measurements in the ErbB network have been substantial, so has the development of various models, from fully mechanistic [49,94], to logic-based [91], to probabilistic [89]. These models typically include either
Input
4
b Signal-processing layer Cascades uy ,l Transcription factors oupu-roth-'--t pptoss rowth Adhesion Differentiation
layer
Figure 1-1: a Ligands and the ten dimeric receptor combinations comprise the
input layer. Numbers in each ligand block indicate the respective high-affinity ErbB receptors. For simplicity, specificities of receptor binding are shown only for epider-mal growth factor (EGF) and neuregulin 4 (NRG4). ErbB2 binds no ligand with high affinity, and ErbB3 homodimers are catalytically inactive (crossed kinase domains). Trans-regulation by G-protein-coupled receptors (such as those for lysophosphatidic acid (LPA), thrombin and endothelin (ET)), and cytokine receptors is shown by
wide arrows. b - Signalling to the adaptor/enzyme layer is shown only for two
re-ceptor dimers: the weakly mitogenic ErbB1 homodimer, and the relatively potent ErbB2-ErbB3 heterodimer. Only some of the pathways and transcription factors are
represented in this layer. c - How they are translated to specific types of output is
poorly understood at present. (Abl, a proto-oncogenic tyrosine kinase whose targets are poorly understood; Akt, a serine/threonine kinase that phosphorylates the anti-apoptotic protein Bad and the ribosomal S6 kinase (S6K); GAP, GTPase activating protein; HB-EGF, heparin-binding EGF; Jak, janus kinase; PKC, protein kinase C; PLCgamma, phospholipase Cgamma; Shp2, Src homology domain-2-containing pro-tein tyrosine phosphatase 2; Stat, signal transducer and activator of transcription; RAF-MEK-MAPK and PAK-JNKK-JNK, two cascades of serine/threonine kinases that regulate the activity of a number of transcription factors.) Reprinted by per-mission from Macmillan Publishers Ltd: Nature Reviews Molecular Cell Biology 2:
a small number of specific phosphorylation sites, or the representation of lumped phosphospecies components. This limitation is due primarily to the tradeoff between the number of species and mathematical tractability as well as the methods in which validation data may be generated, for example by the use of single phosphospecies antibodies. In 2005, Oda and Kitano used the standardized form of Systems Biology Markup Language (SBML) to represent the highest resolution of the ErbB network
to date [77].
1.3
Global phosphorylation measurements of RTK
networks
Monitoring the global state of RTK networks in response to cues, therapeutics, and other factors is fundamental to expanding our understanding of the basic processes at work in the cell as well as our ability to design interventions in diseased states. One successful method for measuring the system under various conditions is the combina-tion of phospho-specific antibodies and high-throughput platforms such as multicolor flow cytometry [89] and bead-based technologies, such as Luminex [91]. Although these platforms are capable of multiplexed measurements across many cellular states and conditions, they are subject to the following limitations: (1) our current un-derstanding of the phosphorylations occurring in the signaling network of interest, (2) the existence of specific antibodies to those phosphorylation sites, and (3) possi-ble antibody interference due to competing protein-protein binding events or protein conformational changes. The first two assumptions are clearly problematic at this relatively early stage in our knowledge of RTK networks. The explosive growth in the documented phosphoproteome over the last decade is a testament to our lim-ited knowledge of the number of phosphorylation sites and their role in the cellular environment.
One of the fundamental reasons our knowledge of the phosphoproteome has in-creased so drastically in recent years is due to the use of mass spectrometry (MS).
MS is able to exquisitely differentiate small changes in mass due to modifications on
residues and therefore it is an excellent measurement tool for discovering those modi-fications and their location on the protein. Additionally, multiple methods have been developed in order to quantify the relative differences between phosphorylated
pro-tein states in different conditions by peptide and propro-tein labeling strategies [1]. One
class of labeling strategies is stable isotope labeling with amino acids, SILAC [79]. Alternatively, iTRAQ labeling involves the addition of a label by incorporation of an isobaric tag [88]. Enrichment for phosphorylation is the key step required to measure phosphopeptides given their relatively low abundance compared to nonphosphory-lated forms of peptides, and has included techniques such as strong cation exchange
(SCX) [116], immobilized metal affinity chromatography (IMAC) [116], and
phospho-specific antibody immunoprecipitation [132]. This general strategy, as well as chemi-cal exchanges, have also been used to measure other types of modifications, including lysine acetylation [14], glycosylation [121], and ubiquitination [82].
A number of research groups, studying a variety of different biological problems,
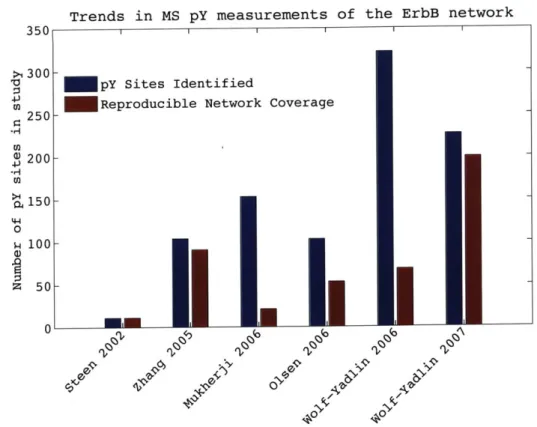
have utilized mass spectrometry as a means to discover, as well as quantify, changes in phosphorylation within cells, such as the profiling the yeast phosphoproteome [120] and phosphoproteomic profiling of a variety of lung carcinoma cell lines [86]. The size and complexity of these datasets vary considerably, from tens of sites [104] to thou-sands [78]. Between strategies for sample separation, phosphorylation enrichment, sample labeling, and instrumentation, there are an overwhelming number of options for MS discovery of phosphorylation in cells and tissue samples. Amidst all of these options is a general trend that discovery, quantitative measurement and reproducibil-ity of phosphorylation measurement is improving continuously. Figure 1-2 shows how coverage of the ErbB phosphotyrosine network has increased roughly two orders of magnitude since the first MS measurements in 2002 by Steen et. al. [104].
Trends in MS pY measurements of the ErbB network
350
>, 300
-pY Sites Identified .4.
250 - Reproducible Network Coverage
00 _P 200 0,150-44I 0 -100- Z50-00
Figure 1-2: Trends in network coverage of the ErbB system. There has been a dras-tic improvement in the coverage of the network in MS measurement of the ErbB system as well as reproducible measurements of the same nodes across multiple con-ditions or times. The following studies were used: Steen 2002 [104], Zhang 2005 [132], Mukherji 2006 [69], Olsen 2006 [78], Wolf-Yadlin 2006 [123], Wolf-Yadlin 2007 [122] and the evaluation of reproducibility is based on the number of sites reproduced in all experiments within the study.
1.4
Tools and repositories for high-throughput
phos-phoproteomic measurements
Given the immensity of the data being generated in phosphoproteomic MS experi-ments, from the various species, dataset sizes, and the degree of relative quantification, the field has been faced with two fundamental problems. The first is how does one store and make available known measurements? Secondly, how does one generate an understanding about the wealth of this information, from function to regulation of all of the emerging phosphorylation sites in all of these species, cells, and conditions? In
response to these demands, a number of repositories and tools have emerged. Chapter 4 of Liu et. al. [60] gives a nice overview of the current state of phosphoproteomic tools.
Currently, high-throughput phosphoproteomic experimental data is cataloged in repository sources of three different varieties: (1) proteome repositories that catalog the presence of a known modification, such as Uniprot [114], (2) specialized reposi-tories of phosphorylation including Phospho.ELM [22], Phosphosite [39] and dbPTM
[57], (3) specific repositories. There are two categories of
experiment-specific repositories, those that have catalog the MS spectra [9] and those that catalog the modification and its quantification within the experiment. At the time of this work only one example of experimental quantification storage existed, PHOSIDA, which is limited to data generated by the lab that developed it [33].
A wealth of tools has been developed for predicting kinase-substrate and
phos-phopeptide binding domain-substrate relationships. Most capitalize on the fact that recognition by kinases and binding domains is conveyed, in part, by the linear amino acid sequence surrounding the target residue, such as KinasePhos [124], PPSP [126], and Scansite [76]. Scansite [76], for example, uses degenerate peptide library screens [102] to build position-specific scoring matrices (PSSM) representing the specificity of a kinase or binding domain targets. A protein sequence can then be scored against each PSSM and a likelihood of recognition can be quantified. NetworKIN [59] com-bines Scansite predictions with protein-protein interaction networks to further specify possible substrate relationships. In addition to tools for predicting kinase-substrate interactions and domain-kinase-substrate interactions, other phosphoproteomic tools have focused on analysis of phosphoprotein conservation across species, such as SysPTM [58] and PhosphoBlast [118].
1.5
Motivation of global phosphoproteomic
mea-surement
The explosion in our knowledge of the phosphoproteome (a ten-fold increase in a four year span), due in a large part to improvements of measurement methodologies, is evidence of the interest in understanding the role of phosphorylation in regulating normal cellular function and its role in the genesis and progression of human dis-ease. It is thought that tyrosine phosphorylation represents only 1% of all protein phosphorylation, whereas phosphoserine is much more abundant, representing the
majority of protein phosphorylations [42]. Despite the low abundance of tyrosine
phosphorylation, according to data in PhosphoSite [39] at the time of this writing, tyrosines actually represent 23% of known phosphorylations in the human proteome. The disparity in these numbers is most likely due to the intense and concerted effort of the field to measure tyrosine phosphorylation. The driving force behind this effort is the important and fundamental role tyrosine phosphorylation plays in signaling transduction, in particular the signaling networks of receptor tyrosine kinases. These experimental studies seek to expand our knowledge regarding the possible phospho-rylation states within the cell, how they are regulated, what role they play in the network, and how their dysregulation leads to disease. Understanding the underlying biochemical control and function is pivotal to our understanding of abnormalities and the development of successful therapeutics for the treatment of disease.
Knowing only whether a phosphorylation site is present is insufficient information to discern the function and regulation of a phosphorylation and so MS experiments have sought to measure quantitative differences in the network across various states to help elucidate a functional role for phosphorylation sites. One example is to measure a signaling network in time, following stimulation. For example, EGF stimulation of EGFR and ErbB containing cell lines will kick off a dynamic series of phosphoryla-tion and signaling events that can then be captured by MS. These dynamics can then be parsed to yield a variety of information regarding potential upstream regulatory events and co-regulation among phosphorylations. Alternatively, measurement of
dif-ferential cellular states, such as diseased tissue versus normal tissue, can give insights regarding the mode and function of the differences in disease. Additionally, global phosphoproteomic measurements of a network before and after inhibition by a drug can yield insight into the cellular effects of that drug, indicating potential efficacy and mode of action.
At this point in time, global phosphoproteomic measurements are capable of greatly expanding our current knowledge of cellular networks. For example, a dy-namic measurement of the ErbB network in human mammary epithelial cells, the latest experiment in Figure 1-2, shares only a 20% overlap with those modifications
depicted in the most complete ErbB system network model by Oda et. al. [77]. In
order to incorporate this wealth of knowledge we must first understand the complex regulation of each site and the functional role each site plays in the signaling network.
1.6
The present work
In this thesis we develop tools and algorithms for the analysis of global phosphopro-teomic experiments, which also serve as general frameworks for inference and handling of other large-scale quantitative biological measurements. The motivation of this work is to enhance and improve the biological information that can be garnered from quan-titative phosphoproteomic measurements, such as hypotheses concerning regulation, function, and interactions of phosphorylation sites within RTK networks, or isolation of key network components responsible for dysregulation. The key concept used in this work relies on the idea that a large dataset, too large to be evaluated as a whole, can be broken into components based on some common feature. These subsets can then be searched in other feature dimensions for enrichment. In addition to linking the two feature dimensions, this method can hypothesize information about those components in the group with unknown function, a "guilty-by-association" method of inference. This thesis demonstrates this concept in a layered manner. In Chapter 2, we show that simple rules of shared regulation downstream of a mutated receptor yield insight regarding a common controlling component. In Chapter 3, we expand the
dimensionalities of both subset selection and subsequent shared information searches to include metadata annotations, such as shared molecular function and cellular lo-calization. In Chapter 4, we take a look at full dataset partitioning through the use of unsupervised learning, a method that has proven useful in the field of gene expression analysis.
In Chapter 2 the feature we focus on is enrichment of the linear amino acid sequence surrounding similarly regulated phosphorylation sites. In order to do this we develop a greedy motif algorithm. When a subset consists of highly co-regulated phosphopeptides, the enriched sequence may yield insight regarding the regulating enzymes or binding partners. This is an important extension, because although tools
like KinasePhos [124] or Scansite [76] can predict some of this information, they do
not have the capability to discover regulatory motifs for unchartered enzymes and binding partners, in particular phosphatase motifs.
Chapter 3 establishes a web-based resource, PTMScout, now available to the phos-phoproteomic community at large. PTMScout provides a flexible interface for arbi-trary subset generation, as well as providing the only repository of its kind that allows for the full scientific community to store and analyze experimental datasets regarding phosphorylation. The large degree of metadata present in PTMScout, annotations of the biological molecules within experimental datasets, enables the high-throughput framework developed in Chapter 4 for the analysis of unsupervised learning parame-ters. The framework developed in Chapter 4, like PTMScout developed in Chapter
3, focuses on enabling scientists in the community to generate the maximum amount
of biological hypotheses from quantitative experiments by decreasing the barrier to utilization of specialized computational tools.
In addition to the methods and tools developed, this thesis also includes biolog-ical inference concerning the ErbB network. For example, in Chapter 2 we pose a direct link between a variant of EGFR correlated with poor prognosis of patients with glioblastoma, EGFRvIII, and increased activity of CK2, indicating a potential intervention point for treatment of a currently untreatable disease. In Chapters 3 and 4, a variety of biology is posed, including implications of components involved
in the crosstalk of the EGF receptor and focal adhesions, extension of our current knowledge regarding phosphoproteins involved in endocytosis of the receptor, and hypotheses regarding roles for several of EGFR phosphorylation sites. The biolog-ical relationships shared in each of the chapters represents only a fraction of those available, but ideally it establishes the usefulness of each of the methods posed in generating relevant biological hypotheses.
Chapter
An Integrated Comparative
Phosphoproteomic and
Bioinformatic Approach Reveals
Novel Class of MPM-2 Motifs
Upregulated in
EGFRvIII-Expressing
Glioblastoma Cells
2.1
Summary
Glioblastoma (GBM, WHO grade IV) is an aggressively proliferative and invasive brain tumor that carries a poor clinical prognosis with a median survival of 9 to 12 months. In a prior phosphoproteomic study performed in the U87MG glioblastoma cell line, we identified tyrosine phosphorylation events that are regulated as a result of titrating EGFRvIII, a constitutively active mutant of the epidermal growth factor
receptor (EGFR) associated with poor prognosis in GBM patients. In the present study, we have used the phosphoserine/phosphothreonine-specific antibody MPM-2 (mitotic protein monoclonal #2) to quantify serine/threonine phosphorylation events in the same cell lines. By employing a bioinformatic tool to identify amino acid se-quence motifs regulated in response to increasing oncogene levels, a set of previously undescribed MPM-2 epitope sequence motifs orthogonal to the canonical "pS/pT-P" motif was identified. These motifs contain acidic amino acids in combinations of the
-5, -2,
+1, +3,
and+5
positions relative to the phosphorylated amino acid. Phos-phopeptides containing these motifs are upregulated in cells expressing EGFRvIII, raising the possibility of a general role for a previously unrecognized acidophilic kinase (e.g. casein kinase II (CK2)) in cell proliferation downstream of EGFR signaling.2.2
Introduction
Glioblastoma (GBM, WHO grade IV) is a complex disease driven by a number of genetic aberrations that dysregulate normal cellular processes such as proliferation, apoptosis and cell cycle control [31]. In particular, expression of EGFRvIII, a con-stitutively active mutant of the epidermal growth factor receptor (EGFR), promotes GBM cell proliferation and survival by preventing cell cycle arrest upon serum with-drawal [72]. This loss in serum dependency has been attributed to a downregulation of the cyclin-dependent kinase (CDK) inhibitor p27 as a result of phosphatidylinos-itol 3-kinase (P13K) activation by EGFRvIII [72]. Improved characterization of the
regulatory network by which EGFRvIII alters mitotic processes in GBM would not only provide further insight into its mitogenic signaling networks but also generate a broader inventory of candidate target genes that may serve as points of therapeutic intervention.
While proximal signals downstream of receptor tyrosine kinases (RTKs) such as EGFR are largely propagated by tyrosine phosphorylation, distal cellular processes are often the consequence of serine/threonine phosphorylation events, which comprise more than 99% of the phosphoproteome. This large background makes the
enrich-ment of interesting phosphoproteomic subsets, such as mitogenic signaling proteins, particularly challenging [42]. This problem is highlighted by a recent global phospho-proteomic study of EGF-mediated signaling in HeLa cells where fewer than 10% of the
identified phosphorylation sites were found to be responsive to EGF stimulation [78].
In order to overcome this limitation in global phosphoproteomic analysis, we have de-vised a sequential immunoprecipitation (IP) strategy coupled to mass spectrometry
(MS) that builds on a previously described phosphotyrosine-enrichment approach to
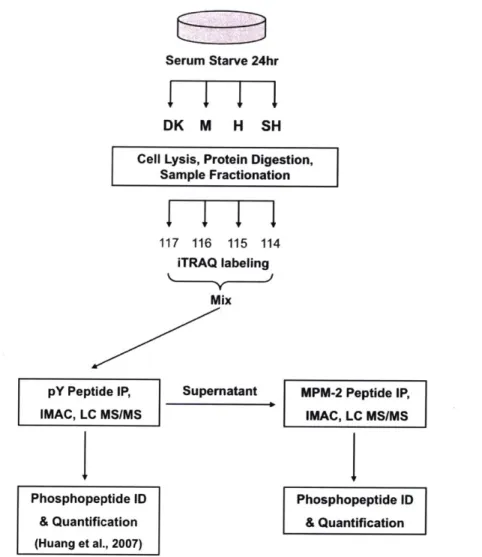
quantify the mitotic phosphoproteome downstream of EGFRvIII, Figure 2-1 [41]. To access the subset of phosphoserine and phosphothreonine modifications in the mitotic compartment, we have employed MPM-2, a monoclonal antibody, derived from mitotic HeLa cell lysates, that recognizes a wide variety of mitotic
phospho-rylated antigens [19]. Despite its widespread use in the literature as a marker of
serine/threonine phosphorylation in mitotic cells, only a small number of the sub-strates recognized by MPM-2 have been identified [106,125]. Furthermore, only lim-ited characterization of the in vivo phosphorylation sites of these substrate proteins has been performed. However, in vitro peptide library screens have shown that the binding specificity of MPM-2 is dominated by the "pS/pT-P" motif commonly propa-gated by the cyclin-dependent kinases (CDKs) and mitogen-activated protein kinases (MAPKs) [87,130].
Quantitative phosphoproteomic mass spectrometry offers the ability to analyze the effects of different conditions, treatments, and cell lines on the global
phosphorylation-mediated state of intracellular signaling [93, 132]. In order to obtain mechanistic
insight into how changes in phosphorylation affect cell phenotype it is necessary to combine the data from quantitative phosphoproteomics with additional information, including protein sequence surrounding the phosphorylation site. Kinases that gen-erate phosphosites, phosphopeptide-binding domains that use phosphosites as signals to prompt a response, and phosphatases that remove phosphosites are all regulated in part by the amino acid sequence surrounding the phosphorylated residue [47,127,129]. There is a great deal of literature and a number of online resources linking linear amino acid sequence motifs to associated kinases and binding domains [4, 76]. Here
Serum Starve 24hr
DK M H SH
Cell Lysis, Protein Digestion, Sample Fractionation
117 116 115 114
iTRAQ labeling
Mix
pY Peptide IP, Supernatant MPM-2 Peptide IP,
IMAC, LC MS/MS IMAC, LC MS/MS
Phosphopeptide ID Phosphopeptide ID
& Quantification & Quantification
(Huang et al., 2007)
Figure 2-1: Experimental workflow for MS discovery of phosphorylation. U87MG sublines (U87-M, 1.5 x 10⁶ copies/cell; U87-H, 2.0 x 10⁶ copies/cell; U87-SH, 3.0 x
106 copies/cell; U87-DK, 2.0 x 10⁶ inactive copies/cell) were serum starved for 24
hours prior to cell lysis and protein digestion. Digested peptides were stable-isotope labeled with the isobaric iTRAQ reagent, mixed and subjected to phosphotyrosine immunoprecipitation (IP) using a pan-specific phosphotyrosine antibody [41]. Mi-totic phosphopeptides were then immunoprecipitated from the supernatant with the MPM-2 antibody. Eluted phosphopeptides were further enriched with immobilized metal affinity chromatography (IMAC) prior to liquid chromatography tandem mass spectrometry analysis (LC-MS/MS). Phosphopeptide identification (ID) and quan-tification was performed as described in the methods.
we describe a bioinformatics tool to identify amino acid sequence motifs significantly enriched among the phosphopeptides associated most strongly with various expression levels of EGFRvIII. We anticipate that this new motif information will lead to en-hanced mechanistic biological insight by connecting the probed processes to sequence motifs associated with known molecules and molecular functions and by revealing motifs of unknown biological function that can be explored further. We also expect that our new method will prove useful in many other problems of interest in basic cellular biochemistry and in therapeutics discovery applications.
2.3
Results
To characterize the effect of EGFRvIII on the mitotic cellular signaling networks, we have utilized the MPM-2 antibody to enrich for peptides containing sites of ser-ine and threonser-ine phosphorylation from U87MG glioblastoma cell lser-ines with titrated levels of the EGFRvIII. A previous phosphoproteomic study of EGFRvIII receptor-mediated signaling has determined the effect of titrating EGFRvIII receptor levels on
phosphotyrosine-driven networks [411. We now build on those foundational findings
by investigating a key subset of serine/threonine substrate phosphorylation sites
up-regulated by EGFRvIII expression in this same battery of cell lines. Since this study is focused on signaling downstream of the EGFRvIII receptor, cells were subjected to serum starvation prior to analysis to minimize any confounding signaling events that may arise from components in serum and cell culture media. After depleting phosphotyrosine-containing peptides using the pan-specific phosphotyrosine antibody PY100, the iTRAQ-labeled supernatant was subjected to a subsequent immunopre-cipitation using the MPM-2 monoclonal antibody, Figure 2-1. Peptides eluted from the MPM-2 IP were further enriched for phosphopeptides using immobilized metal affinity chromatography (IMAC) prior to liquid chromatography tandem mass spec-trometry (LC-MS/MS) analysis. Two biological replicates were performed, resulting in the identification and quantification of 87 unique sites of phosphorylation on 68 phosphopeptides (58 proteins), Table 2.1. Of these sites, 11 were found to be novel
with respect to the resources Phospho.ELM [22], PHOSIDA [33], PhosphoSitePlus (www.phosphosite.org), and a recent study of mitotic phosphoproteins [20]. Three of the sites have not been detected previously in humans, but only in homologous proteins.
This phosphoproteomic analysis is, to our knowledge, the most extensive char-acterization of MPM-2 substrates to date. Our present study is also distinct from previous MPM-2 proteomic analyses in that our MS analysis provides quantitative information on in vivo MPM-2 substrates with site-specific resolution. A previous
IVEC screen to identify MPM-2 substrates in Xenopus embryo extracts was
per-formed by Stukenberg et al. and identified 20 candidate proteins that underwent mi-totic phosphorylation [106]. More recently, a proteomic study of MPM-2 substrates performed using 2D gel electrophoresis identified [101] MPM-2 candidate substrate proteins [125]. Strikingly, there is no overlap between the proteins identified in these two studies and our current analysis. The lack of similarity in the datasets is likely due to context-dependent variation, including the use of different cell lines and chemically-induced cell cycle synchronization or mitotic activation in previous studies [106,125] compared to asynchronously cycling EGFRvIII-expressing cells in the current study. Additionally, we have performed substrate isolation using solution-based peptide IP coupled to mass spectrometry, an approach that may yield different substrates from the cDNA screens and 2D gel electrophoresis analysis carried out in the two prior studies.
Ectopic expression of EGFRvIII in U87MG cells results in an increased pro-liferation rate and a larger G2-M cell population under serum depravation condi-tions [40,72]. Consistent with the well-recognized binding affinity of MPM-2 to phos-phoproteins in mitotic cells, we observe that phosphorylation of the established pro-liferation markers Ki-67 and MCM3 (minichromosome maintenance protein 3) were upregulated 1.4-fold and 2.7-fold respectively in the U87-H subline, which expresses a high level of EGFRvIII, compared to the U87-DK kinase-dead control cells [37,101]. It has previously been demonstrated that EGFRvIII downregulates p27 expression via activation of the P13K pathway, resulting in an increase in CDK2-cyclin activity
Table 2.1: MS detected MPM-2 substrates in U87 EGFRvIII expressing cells. There were 68 phosphopeptides measured, covering 58 proteins, following enrichment of U87 cells expressing a kinase dead (DK) EGFRvJII and medium (M), high (H), and super high (SH) levels of EGFRvIII.
gene name trypsinized phosphopeptide site DK M H SH
AFF4 AKAP11 ARFGAPI ATF2 BCLAF1 Cl4orfl06 CHD8 CTAGE5 CTAGE5 EHD1 EHD4 EIF3C EIF4EBP1 EIF4EBP1 EIF4EBP2 ERCC6 FAM33A FAM40B FASN FLJ20297 FZR1 FZR1 HERC1 HNRPF KIAA0460 KIAA1458 LOC439961 LOC440991 MAP1A MAPIB MAP1B MAPIB MCM3 MCM3 MEF2A MK167 MPHOSPH10 MPHOSPH6 NKAP NUMA1 NUP98 PDE5A PGRMC1 PGRMC2 PRPF31 RANBP2 RBI RBL1 RCAN1 RIFI RRM2 SCD SDCCAG1 SMARCADI SMARCADI SON SQSTM1 SQSTM1 SRRM2 SRRM2 SSB SURF2 SURF2 THRAP3 TMEM51 TOP2B YTHDC2 ZC3H13 MFsPIEEK SSAFsPLGGCTPAECFCQTDIGGDR EWSLESSPAQNWtPPQPR M PLDLsPLATPIIR AEGEWEDQEALDYFsDKESGK EFLEQLPKDDHDDFFSTtPLQHQR HFSTLKDDDLVEFsDLEsEDDERPR EHsPYGPsPLGWPSSETR EHSPYGPsPLGWPSSETR DKPTYDEIFYTLsPVNGK DKPVYDELFYTLsPINGK QPLLLsEDEEDTKR VVLGDGVQLPPGDYSTtPGGTLFSTtPGGTR VVLGDGVQLPPGDYSTTPGGTLFSttPGGTR TVAISDAAQLPHDYCTtPGGTLFSTtPGGTR KVPVQEIDDDFFPssGEEAEAASVGEGGGGGRK QTDLELsPLTKEEK RYDRPQDSEFsPVDNCLQSVLGQR ADEASELACPtPKEDGLAQQQTQLNLR QLPDCIVGEDGLILtPLGR RSsPDDGNDVSPYSLsPVSNK SSPDDGNDVSPYSLsPVSNK DRWIsENQDSADVDPQEHSFTR ATENDIYNFFsPLNPVR DVEDMELsDVEDDGSKIIVEDRK RGTFsDQELDAQSLDDEDDNMHHAVYPAVNRFsPsPR LTDEDFsPFGSGGGLFSGGK DEILPTtPISEQK ELVLssPEDLTQDFEEMKR SVNFSLtPNEIK SDISPLtPRESsPLYsPTFSDSTSAVK AAEAGGAEEQYGFLTtPTK DGDSYDPYDFsDTEEEMPQVHTPK DGDSYDPYDFsDTEEEMPQVHtPKTADSQETK GCDsPDPDTSYVLtPHTEEK AAVGEEKDINTFVGtPVEK SDLRKsPVFsDEDsDLDFDISKLEQQSK DHANYEEDENGDItPIK IGELGAPEVWGLsPK LPPKVEsLESLYFtPIPAR NLNNSNLFsPVNRDSENLAsPSEYPENGER EQMPLtPPRFDHDEGDQCSR LLKEGEEPTVYsDEEEPKDESAR LLKPGEEPSEYtDEEDTKDHNKQD SSGTAsSVAFtPLQGLEIVNPQAAEK KKPEDSPSDDDVLIVYELtPTAEQK DREGPTDHLESACPLNLPLQNNHTAADMYLsPVRsPK EKEAVItPVASATQSVSR QFLIsPPAsPPVGWK NYTEDIFPVtPPELEETIRDEK VPLAPITDPQQLQLsPLK GSTLDLsDLEAEK NPYLLsEEEDDDVDGDVNVEKNETEPPKGK RNDDIsELEDLSELEDLKDAK RNDDIsELEDLsELEDLKDAK SFsIsPVR SRLtPVSPESSSTEEK SRLtPVsPESSSTEEK GEFSAsPMLK ELSNsPLRENSFGsPLEFR FAsDDEHDEHDENGATGPVKR DLGSTEDGDGtDDFLtDKEDEKAKPPR DLGSTEDGDGTDDFLtDKEDEK NREEEWDPEYtPK YYVPsYEEVMNTNYSEAR ASPITNDGEDEFVPsDGLDKDEYTFSPGK STDSSSYPsPCAsPSPPSSGK GNIETTSEDGQVFsPK S694; S456; T135; S 112; S385; T993; S1420;S 1424; S442;S447; S447; S456; S459; S39; T37;T46; T45;T46; T37;T46; S429;S430; S101; S788; T2204; T640; S138;S151; S151; S1328; S310; S337; S315;S345;S343; S 104; T221; S526;S527; T1156; T1662;S1667;S1671 T941; S711; S711;T722; S98;T108; T1923; S163;S171;S167; T147; S149; S1755;T1762; S595;S606; T137; S181; T211; S450;T455; T2639; S608;S612; T385; S163;S167; T702; S20; S203; S417; S146; S146;S152; S2011; S2013; T269; T269;S272; S1124; S1320;S1329; S366; T190;T195; T195; T874; S133; S1408; S1263;S1267; 8993; 0.48 0.73 0.53 0.62 0.54 0.63 0.39 0.13 0.2 0.54 0.68 0.74 0.56 0.59 0.64 0.69 0.48 0.64 0.71 0.58 0.44 0.6 0.42 0.55 1 0.57 0.45 0.68 0.85 0.72 0.67 0.78 0.37 0.37 0.48 0.72 0.4 0.05 0.6 0.51 0.51 4.67 0.55 0.6 0.72 0.54 0.44 0.47 0.7 0.61 0.52 0.36 0.5 0.47 0.78 0.75 1.08 0.95 0.69 0.64 0.52 0.48 0.45 0.69 0.7 0.93 1 0.57
and Rb (retinoblastoma protein) hyperphosphorylation, allowing cells to enter the cell cycle [72]. In line with this result, we also observe that phosphorylation of Rb
(S608 & S612) and the Rb family member p107 (T385) increase more than 2-fold in
the U87-H cells compared to the control U87-DK cells. These phosphorylation sites directly precede proline residues, a characteristic motif recognized by proline-directed kinases such as the CDKs [59].
Of the 58 proteins identified in this study, only 8 are annotated in the Gene
On-tology database as having a role in the cell cycle. It is surprising that only 15% of the phosphopeptides immunoprecipitated by MPM-2 have a previous association with cell cycle, especially given that MPM-2 is considered to specifically recognize substrates in proliferating cells and mitotic cell lysates [19]. Nonetheless, those proteins that are labeled as having the GO process annotation term cell cycle are enriched (p-value of
0.01) in the subgroup of peptides whose phosphorylation level is upregulated is in the
top quartile in the U87-H cell line as compared to the control U87-DK cells.
Intriguingly, only 59 of the 87 phosphorylation events identified in this study were on a serine or threonine residue followed by a proline, Figure 2-2A. Of the 28 re-maining sites, 20 had an aspartic or glutamic acid in the +1 position, directly to the C-terminal side of the phosphorylated residue. Moreover, 16 of the 68 phosphopep-tides identified in the MS study contained at least one "pS/pT-D/E" site, and no
"pS/pT-P" site, demonstrating that a large fraction of the acid-directed sites were
specifically recognized by the MPM-2 antibody, and were not merely neighbors to proline-directed sites on the same peptide. To ensure that this surprising departure from the canonical MPM-2 epitope was not a byproduct of non-specific binding, a degenerate peptide library experiment was performed to determine whether non-
"pS-P" containing motifs could be directly recognized by the MPM-2 antibody. Peptide
libraries were synthesized on a cellulose membrane and immunoblotted with MPM-2 to discover the in vitro affinity of MPM-2 for positional dependence and amino acid composition of favorable motifs, Figure2-2. Importantly, due to the prevalence of the "pS-P" motif in MPM-2 literature, all libraries degenerate at the +1 position ex-cluded proline in the +1 position, in an attempt to minimize the effect of what might

![Figure 2-2: Degenerate library screen of MPM-2 specificity. (A) Motif logo of mass spec dataset [17]](https://thumb-eu.123doks.com/thumbv2/123doknet/14437388.516282/42.918.147.688.174.695/figure-degenerate-library-screen-mpm-specificity-motif-dataset.webp)
![Figure 3-2: An abstracted database schema of PTMScout with an example peptide measured from JAK2 in the EGF7 experiment [122]](https://thumb-eu.123doks.com/thumbv2/123doknet/14437388.516282/64.918.126.724.163.697/figure-abstracted-database-ptmscout-example-peptide-measured-experiment.webp)
![Figure 3-3: Subset selection of the kinase catalytic domain phosphorylation sites in the EGF4 dataset [132]](https://thumb-eu.123doks.com/thumbv2/123doknet/14437388.516282/68.918.273.580.163.806/figure-subset-selection-kinase-catalytic-domain-phosphorylation-dataset.webp)
![Figure 3-4: BCAR1 subset selection and enrichment in the EGF7 dataset [122].](https://thumb-eu.123doks.com/thumbv2/123doknet/14437388.516282/71.918.139.794.151.762/figure-bcar-subset-selection-enrichment-egf-dataset.webp)
