A Compressive Sensing Algorithm for
Attitude Determination
by
Rishi Vijay Gupta
Submitted to the Department of Electrical Engineering and Computer Science
in partial fulfillment of the requirements for the degree of
Master of Engineering in Computer Science
at the
MASSACHUSETTS INSTITUTE OF TECHNOLOGY
June 2011
©
Massachusetts Institute of Technology 2011. All rights reserved.
Permission is granted to Draper Laboratory to reproduce and publicly distribute
paper and electronic copies of this thesis in whole or in part.
MASSACHUSEPIS INSTITUTE OF TECHN-C)LOGY
JUN 2 1 2011
LIBRARIES
I
ARCHNESFq
A u th or ...
I ...
...
**
Department of Electrical Engineering and Computer Science
May 6, 2011
Certified by...
.r...r.d..
Piotr Indyk
Associate Professor, MIT
Thesis Supervisor
C ertified by ... ... .... ... .... ... .... ... ...
Yaron Rachlin
Senior Technical Staff, Draper Laboratory
Thesis Supervisor
Accepted by... . ...
Christopher J. Torman
Chairman, Department Committee on Graduate Theses
A Compressive Sensing Algorithm for
Attitude Determination
by
Rishi Vijay Gupta
Submitted to the Department of Electrical Engineering and Computer Science on May 6, 2011, in partial fulfillment of the
requirements for the degree of Master of Engineering in Computer Science
Abstract
We propose a framework for compressive sensing of images with local distinguishable objects, such as stars, and apply it to solve a problem in celestial navigation. Specifically, let x E RN be an N-pixel image, consisting of a small number of local distinguishable objects plus noise. Our goal is to design an m x N measurement matrix A with m < N, such that we can recover an approximation to x from the measurements Ax.
We construct a matrix A and recovery algorithm with the following properties: (i) if there are
k objects, the number of measurements m is O((klog N)/(log k)), undercutting the best known
bound of O(klog(N/k)) (ii) the matrix A is ultra-sparse, which is important when the signal is weak relative to the noise, and (iii) the recovery algorithm is empirically fast and runs in time sub-linear in N.
We also present a comprehensive study of the application of our algorithm to attitude determination, or finding one's orientation in space. Spacecraft typically use cameras to acquire an image of the sky, and then identify stars in the image to compute their orientation. Taking pictures is very expensive for small spacecraft, since camera sensors use a lot of power. Our algorithm optically compresses the image before it reaches the camera's array of pixels, reducing the number of sensors that are required.
Thesis Supervisor: Piotr Indyk Title: Associate Professor, MIT Thesis Supervisor: Yaron Rachlin
Acknowledgments
Foremost I thank my advisor, Piotr Indyk, and supervisor, Yaron Rachlin, for guiding my
academic development and this work.
I also thank my academic advisor, Leslie Kaelbling, for her inspiration and helpful advice.
Much of this work has appeared as a publication with coauthors. I thank Piotr Indyk, Eric
Price, and Yaron Rachlin for their contributions to the publication.
I thank Draper Laboratory for funding my master's studies, and the Draper community
for being helpful and supportive. Finally, I thank MIT for being an amazing place to be a
student.
Contents
Abstract Acknowledgements 1 Introduction 1.1 Compressive sensing 1.2 1.3 1.4 1.5 Attitude determination . . . . Motivation for a new algorithm . Model description . . . . Results and techniques . . . . 2 Theoretical results2.1 Definitions and preliminaries... 2.2 Two code constructions . . . .
2.3 The measurement matrix . . . .
2.4 Recovery algorithm . . . .
3 Applications to attitude determination 3.1 Current star trackers . . . . 3.2 Specialization of the general algorithm
3.3 Software implementation . . . .
A The Algorithm in Pictures
Bibliography 6 6 7 8 10 . . . . 10 . . . . 12 . . . . 13 . . . . 14 17 . . . . 17 . . . 21
Chapter 1
Introduction
1.1
Compressive sensing
Traditional approaches to image acquisition first capture an entire N-pixel image and then process it for compression, transmission, or storage. Often, the image is captured at very high fidelity, only to be immediately compressed after digitization. In contrast, compressive sensing uses prior knowledge about a signal to obtain a compressed representation directly, by acquiring a small number of nonadaptive linear measurements of the signal in hardware [CRT06, DonO6]. Formally, for an image represented by a vector x, we acquire the measurement vector, or sketch, Ax, where A is an m x N matrix. The advantage of this architecture is that it uses fewer sensors, and therefore can be cheaper and use less energy than a conventional camera [DDT+08, FTF06, Rom09]. In order to reconstruct the image x from the lower-dimensional sketch Ax, we assume that the image
x is k-sparse for some k (i.e., has at most k non-zero coordinates) or at least be well-approximated
by a k-sparse vector. Then, given Ax, one finds an approximation to x by performing sparse
recovery. The problem is typically defined as follows: construct a matrix A such that, for any
signal x, we can recover a vector : from Ax satisfying
|Ix-|| 1 C - Err(x) (1.1)
where Errk(x) = mink-sparse x' Ix - x'I|, and C is the approximation factor. Note that if x is
k-sparse, then Err(x) = 0, and therefore 2 x. Sparse recovery also has applications to other areas, such as data stream computing [Mut05, IndO7].
The problem of designing matrices A and corresponding recovery algorithms has been a subject of extensive study over the last few years, with the goal of designing schemes that enjoy good compression rate (i.e., low values of m) as well as good algorithmic properties such as low encoding and recovery times.
It is known by now that there exist binary matrices A and associated recovery algorithms that produce approximations , satisfying Equation (1.1) with constant approximation factor C and sketch length m =
O(k
log(N/k)). In particular, a random Bernoulli matrix [CRT06] or a randombinary matrix with column sparsity O(log(N/k)) [BGI+08] has this property with overwhelming probability. It is also known that this sketch length is asymptotically optimal [DIPW10, FPRU10]. See [GI10 for an overview of compressive sensing using matrices with low column sparsity.
1.2
Attitude determination
Spacecraft determine their attitude, or 3-axis orientation, by taking pictures of the sky ahead of them and identifying stars in the image. This function is encapsulated in a star tracker, which is essentially a digital camera connected to a processor. To acquire the initial attitude, the camera
1. Takes a picture of the sky.
2. Identifies a set of starlike objects in the picture, and computes the centroid of each object.
3. Tries to match triangles and quadrilaterals formed by subsets of the centroids to an onboard
database. A match provides approximate attitude information.
4. Uses the onboard database to determine a set of stars that it expects are in the picture, along with their approximate locations. Refines the attitude information by centroiding those stars as well.
Most of the time, a star tracker has knowledge about its approximate attitude, either from the previous attitude computation or from other sensors. In that case, it goes from Step 1 directly to
Step 4, in what we call tracking mode. [Lie02] has an overview of the process.
There are two types of sensors used in star tracker cameras, CCD (charge-coupled device), and
CMOS (complimentary metal-oxide semiconductor). CCD sensors have low noise and capture
a high fraction of the incoming signal, but have power usage and manufacturing costs that are super-linear in the number of pixels and that are high in absolute terms. On the other hand,
CMOS sensors use little power, are cheap to manufacture, and allow random access to pixel values
(important for tracking mode), but capture less of the incoming signal, and are very noisy. Most spacecraft use CCD cameras, but smaller or cheaper spacecraft use CMOS, taking a factor of 10 or higher hit in precision.
1.3
Motivation for a new algorithm
Ideally, we would like to have a camera with the precision of a high pixel CCD camera, but without the extra power and manufacturing costs that drive small spacecraft to use CMOS. The pictures taken by star trackers are naturally very sparse, in that most pixels are either empty or contain
small stars not used in Steps 3 or 4. Also, the algorithms for Step 3 are very robust, and can tolerate a substantial fraction of bogus centroid information [Mor97]. A compressive sensing solution would optically compress the incoming picture, to reduce the size of the CCD array.
However, a standard compressive sensing solution runs into several major problems. First, the L1
mass of the small stars is large compared to the L1 mass of the signal. In other words, Errk(x) =
0(I|x||1), and so Equation 1.1 gives no guarantee at all. Second, multiplying the signal by a compressive sensing matrix A means that we have to split the analog signal, which decreases the signal to noise ratio by as much as the square root of the column sparsity of A [HL07]. Finally, each star is spread over multiple pixels, and makes only a small contribution to some of them. These pixels are needed to centroid the star properly, but compressive sensing recovery techniques are only designed to recover the biggest pixels well.
We address many of these concerns by focusing on a compressive sensing algorithm with
ultra-low column sparsity, or equivalently, with ultra-ultra-low encoding complexity. Compressive sensing
algorithms with low encoding complexity are of general interest as well. Potential advantages in non-star tracking electronic compressive imagers include reduced interconnect complexity [Mei03], low memory requirements for storing the measurement matrix, and gain in image acquisition speed due to reduced operations.
Unfortunately, it is known [Nacl0l that any deterministic scheme with guarantee as in Equation 1.1 requires column sparsity of ((log(N/k)). In the randomized case, where A is a random variable, and Equation 1.1 is required to hold only with constant probability over the choice of A, the same paper shows that any binary matrix A must have column sparsity as stated.
In this paper we overcome the above limitations by employing a two-fold approach. First, we consider a class of images where the k large coefficients or k local objects can be distinguished from each other. Second, we relax the recovery guarantee, by requiring that only a constant fraction of the objects are recovered correctly, and only with constant probability.
1.4
Model description
Our model for sparse images is motivated by astronomical imaging, where an image contains a small number of distinguishable objects (e.g., stars) plus some noise. We model each object as an image contained in a small w x w bounding box, for some constant w. The image is constructed by placing k objects in the image in an arbitrary fashion, subject to a minimum separation constraint. The image is then modified by adding noise. We formalize the notions of minimum separation constraint, distinguishability, and noise in the rest of this section.
Let x be an N-dimensional real vector, and assume N = n2 for an integer n. We will treat x both as a vector and as an n x n matrix, with entries x[i,
j]
for i,j
E [n]. An object o is a w x w real matrix.in X, i.e., elements from [n -w 2. We say that T is valid if for any i
#/
j the translations ti and tj do not collide, i.e., we have ||ti - tjIo > w' for some separation parameter w' = Q(w). For o E 0 andt = (tx, ty) E T, we define t(o) to be a w x w matrix indexed by {t ... tx+w-1} x{ty ... t!Y+w-1}.
The ground truth image is then defined as x = j t(o ).
During our algorithm, we impose a grid G on the image with cells of size w' x w'. Let x, be the image (i.e., an w'2-dimensional vector) corresponding to cell c. We then use a projection F that
maps each sub-image xe into a feature vector F(xc). If y E xc for some cell c, we use F(y) to denote
F(xe) after the entries of x, \ y are set to 0. If y is not a cell and not' contained in a cell, we leave
F(y) undefined.
The distinguishability property we assume is that for any two distinct o, o' from the objects
OU{0},
and for any two translations t and t', we have
IF(t(o))
- F(t'(o'))||r > T (when it is defined) forsome threshold T > 0 and some norm ||-||r. In other words, different objects need to look different under F. For concreteness, the features we exploit in the experimental section are the magnitude (the sum of all pixels in the cell) and centroid (the sum of all pixels in the cell, weighted by pixel coordinates), since the magnitudes of stars follow a power law, and the centroid of a star can be resolved to .15 times the width of a pixel in each dimension. The distinguishability constraint is what ultimately allows us to undercut the usual lower bound by a factor of log k.
The observed image x' is equal to x +p1, where p is a noise vector. The threshold T determines the
total amount of noise that the algorithm tolerates. Specifically, let ||p111F =
Ec ||F(pzc)||r, where pc
is the noise corresponding to cell c. We assume that ||p||F < 7kT for some constant -y > 0, and make no other assumptions about the noise.
1.5
Results and techniques
Theoretical result Assume sparsity parameter k > Clog N for some constant C. We construct a distribution over random binary m x N matrices A, such that given Ax' for x' described above, we recover, with constant probability, a set D of k cells, such that at least k/2 of the cells fully containing an object are included in D'. The matrix has column sparsity O(logk N). Note that if (say) k = N1/2, then the column sparsity is constant. Moreover, the matrix A has only m
0(k
logk N) rows.Empirical result We implement a standard attitude determination routine, with the picture
acquisition step replaced with a simplified version of the theoretical algorithm. Our algorithm performs better recovery on small numbers of measurements and is orders of magnitude faster than comparable compressive sensing methods.
Our techniques Our construction of the measurement matrix resembles those of other algorithms
for sparse matrices, such as Count-Sketch [CCF02] or Count-Min [CM04]: we "hash" each cell c into each of s = O(logk N) arrays of q =
0(k)
"buckets", and sum all the cells hashed to the same bucket. Each bucket defines one measurement of w'2 pixels, which gives m =0(k
logk N). Hashingis done using either the Reed-Solomon code or the Chinese Reminder code2.
The recovery process is based on the following novel approach. For simplicity, assume for now that the image contains no noise, and ignore the effect of two different objects being hashed to the same bucket. In this case, all buckets containing distinct objects are distinguishable from each other. Therefore, we can group non-empty buckets into k clusters of size s, with each cluster containing buckets with a single value. Since qS > N, each cluster of buckets uniquely determines the cell in
x containing the object in those buckets.
In order to make this approach practical, however, we need to make it robust to errors. The errors are due to distinct objects being hashed to the same bucket, the noise vector p, and the grid cutting objects into pieces. Because of these issues, the clustering procedure aims to find clusters containing elements that are close to each other, rather than equal, and the procedure allows for some small fraction of outliers. For this purpose, we use the approximation algorithm for the k-center problem with outliers [CKMN01], which correctly clusters a constant fraction of the buckets. To handle the buckets that are grouped incorrectly, we construct our hash function using a constant rate error-correcting code.
Chapter 2
Theoretical results
A graphical representation of the algorithm is presented in Appendix A. Our scheme works by
"hashing" each cell c into s = O(logk N) different arrays of size 0(k). We can think of this as a mapping g from [N] to [O(k)]8. As long as each character of the mapping is approximately pairwise
independent, then (in expectation) most of the k objects will be alone in most of the array locations they map to. Our reconstruction algorithm clusters the values in the cells, giving us a noisy version y' of the true codeword y = g(c) with a constant fraction of errors. We then efficiently decode from y' to c.
The first and second sections establish families 9 from which we will draw mappings g. The third section uses g to construct a distribution over measurement matrices A, and the fourth section presents an associated recovery algorithm. The main result is stated in Theorem 9.
2.1
Definitions and preliminaries
We need an efficient error correcting code that is also approximately pairwise independent in each character. This section gives precise definitions of our requirements, and the next section gives two codes that achieve them.
Definition 1. A hash family 71 of functions h: A -- B is pairwise-independent if, for any X, 2 E
A and y1, y2 E B with x1 : x2, we have PrhEW- [h(xi) = y1 n h(X2) = y21
In many of our applications the range B is the product of s "symbols" B1 x ... x B,. For a function
f:
A -4 B and i E [s], we use fi(x) to denote the ith coordinate of f.When B is a product space, we will sometimes settle for a weaker notion of pairwise indepen-dence. Rather than requiring pairwise independence for the whole range, we only require pairwise independence in each coordinate:
Definition 2. Let B = B1 x - - - x B,. A hash family W of functions h: A -4 B is
coordinate-wise C-paircoordinate-wise-independent if, for all i E [s], any x1
#
X2 E A, and all yi, Y2 E Bi, we havePrheW[hj(xi) = y1 n hi(x2) = Y2)
-Definition 3. Let B = B1 x ... x B,. A function
f
: A -4 B is C-uniform if, for all i E [s] andall y
E
Bi, PrxCA[fi(x) = y1 C .Definition 4. For any function
f
: B -+ D and family W of functions h: A -+ B,f
o W denotesthe family of A -4 D functions {g(x) =
f
(h(x))I
h 1}.Claim 1. If W is pairwise-independent and
f
is C-uniform, thenf
o ?j is coordinatewise C2_pairwise-independent.
Proof. Let-lbeA-+B and
f
beB -+D=Di x ... x D,. Then for any i E [s], any xi x2 E A,and all Y1, Y2 E Di we have:
Pr [fj(h(x1)) = y1 n fi(h(x2)) - y21
hEl
= Pr [h(xi) =
z1
n
h(x2) = z2n
f(zi)
='y1ffi(z
2) =Y21ziz2B hE
Pr[fj(zi)=y1nf(z2)=Y 2)
zi,z2EB
IBI
Pr [f (zi) = y1n
fi(z
2) = Y2zi,z2EB
= Pr [fi(zi) = y1] Pr [fi(z2) = Y21
z1CB z2EB
<C 2
as desired.
Definition 5. We say that a function
f
: A -+ B for B = B1 x ... x B, is an error-correcting codeof distance d if, for any two distinct x1, X2 A, f(x 1) and f(x 2) differ in at least d coordinates.
We say that
f
is efficiently decodable if we have an algorithmf-
1 running in logo(MIBI
time withf- 1(y) = x for any x E A and y E B such that f(x) and y differ in fewer than d/2 coordinates.
For any prime P > N, the function family Np : ax+b (mod P) for a, b E [P] is pairwise independent
when viewed as a set of functions from [N] to [P].
Lemma 2. If
f
is an efficiently decodable error-correcting code with distance d, then so isf
o h for every h E i p with a | P.Proof. Since a f P, there exists an a- 1 modulo P, and we can efficiently compute it. Hence
h is injective, so
f
o h is an error-correcting code of distance d. Furthermore, (f o h)-(x) a-1 (f- 1(x) - b) (mod P) is efficiently computable.Definition 6. We say that a family
g
of functions g: A -+ B1 x --- x B, is a(C,N,s,d)q-independent-code if
g
is coordinatewise C2-pairwise independent, q |Bj| < 2q for all i E [s],\AI > N, and with probability at least 1 - 1/N over g E
g
we have that g is efficiently decodable with distance d.If
f:
A' -+ B1 x ... x B, is C-uniform and efficiently decodable with distance d andI
BiI
q for alli, then
f
o' p is a (C, N, s, d)q-independent code.We now show that (C, N, s, d)q-independent codes have few collisions in expectation. We set C = 2 in anticipation of the next section.
Lemma 3. Suppose g: A -+ B1 x ... x B, is drawn from a (2, N, s, s - r)q-independent code. Let
S, S' C A. Define the set of "colliding" symbols
X = {(a,i) | a E Si E [s},3a' E S' s.t. gi(a) = gi(a'), a
#
a'}With probability at least 7/8,
IXI
32
SI
IS'
s/q.
Proof. We observe thatE[IXI]
Pr[(a, i)
E
X]
ic[s] aES< 1:Pr[gi(a)
= gi(a')]
iE [s] aES a'ES' a'#$aE E
Pr[gi(a)=
z
n
gi(a')
=
z]
iE [s] aCS a'GS' zEB
iC saGS a'S' zEBS a'#$a
<
SSI
S'|4/q
Hence, by Markov's inequality,
lXi
32SI
IS'I
s/q with probability at least 7/8. O2.2
Two code constructions
We explicitly give two (2, N, s, s - r)q-independent codes. Both are achievable for any parameters with 2N < q' and s < q/log q (and the first code allows any s < q). We let P be a prime in
Reed-Solomon code Let q > s. The Reed-Solomon code fRs: [qr] -+ [q]s is defined for f(x) by
(i) interpreting x as an element of Kh, (ii) defining Xx
E
F,[(]
to be the rth degree polynomial withcoefficients corresponding to x, and (iii) outputting f(x) = (Xx(1), ... , Xx(s)). It is well known to
have distance s - r and to be efficiently decodable [Jus76].
Claim 4. Let f : [P] -+ [q]* be the restriction of fRs to [P]. Then f is 2-uniform.
Proof. We know that fRs is 1-uniform. Since P > qr/2, f is 2-uniform.
Hence
gRS
= f a l-p is a (2, N, s, s - r)q-independent code.Chinese Remainder Theorem (CRT) code Let pi,..., p, E [q, 2q] be distinct primes; note
that the asymptotic distribution of prime numbers implies q/ log q = Q(s). Hence for any x C [N],
any r of the residues mod pi, ... , p. uniquely identify x. The CRT code fcRT: [P] 4 [P1] x ... x [Ps]
is defined by taking the residues modulo each prime. It has distance s - r and is efficiently
decodable [GRS99].
Claim 5. The CRT code fCRT is 2-uniform.
Proof. Let i E [s]. The projection of fcmr onto its ith coordinate is one-to-one over a domain
that is any consecutive sequence of pi integers. Hence over the domain [P], the ratio between the likelihood of the most common and the least common values in the range is < < 2. 0
Hence gcRr = fCRT o lp is a (2, N, s, s - r)q-independent code.
2.3
The measurement matrix
In this section we present the measurement matrix A. A graphical representation of the measure-ment process is presented on the first page of Appendix A. Let 0 = {o1 ... ok} be a sequence of
k features, and let T = {t1 ... tk} be a sequence of (non-colliding) translations in x. Let p be the noise vector, and let x' be the noisy image. Finally, let a,
#,
7, 6, r > 0 be (small) constants whosevalues will be determined in the course of the analysis.
At the beginning, we impose a square grid G with w' x w' cells on the image x', such that w' = w/a. The grid is shifted by a vector v chosen uniformly at random from [w']2. Let S' be the set of cells
that intersect or contain some object ti(oi), and S c 5' be the set of cells that fully contain some object ti(oi). Observe that a fixed object is fully contained in some cell with probability (1 - w/w')2 > 1 - 2a, since each axis of the grid intersects the object with probability w/w'. This
implies that the expected number of cells in S' - S is at most 2ak, which implies by Markov that
IS'
- SI 16ak with probability 7/8. From now on, we will assume the latter event holds. Let k' =|S'|. We choose a > 0 such that k' < 2k.Our measurement matrix A is defined by the following linear mapping. Let G denote the set of cells. Let g: G - B = B1 x - x B, be drawn from a (4, N, s, 4(35 +
#)s)q-independent
code(such as either 9RS or gcRT). Moreover, we require that k/q r; such a code is achievable
per Section 2.2 with s = (logk N) as long as k > Clog N for some constant C (such that both
q(1- 3(3 6+3 ))s > ks/2 > 2N and s < log N/log k < q/log q). For each i = 1... s, we define a
Bi I-dimensional vector zi whose entries are elements in RW'2
, such that for any
j
z=
'
XCgj(c)=j
That is, we "hash" all cells into |Bil > q buckets, and sum all cells hashed to the same bucket. The measurement vector z = Ax' is now equal to a concatenation of vectors z ... z". Note that the
dimension of z is equal to m = w'2
Il
= O(qs) = O(k log N).2.4
Recovery algorithm
A graphical representation of the recovery process is presented on the second page of Appendix A.
The recovery algorithm starts by identifying the buckets that likely contain the cells from S, and labels them consistently (i.e., two buckets containing cells from S should receive the same label), allowing for a small fraction of errors. We then use the labels to identify the cells.
The algorithm runs as follows. For a set of pairs X, let F(X) denote {F(zj) : (ij) E X}.
1. Identify R = {(i, j) :|F(z.)||r ;> T/2} (that is, R, contains the "heavy cells" of the
measure-ment vector z).
2. Partition R into sets R', Rl,..., Rk such that
IR'I
< sk, and such that for each 1 < 1 < kthe diameter of F(R') is at most T/2.
3. For each label l = 1...k, create a vector ul E B such that for each i = 1...s, u
= j
if(i,
j)
c
Rk (if there are many suchj,
ties are broken arbitrarily), or u =_L (an arbitrary erasure symbol) if no suchj
exists.4. For each label 1 = 1 ... k apply the decoding algorithm' for g to u , obtaining a (possibly invalid) decoded cell d'.
We analyze the algorithm by keeping track of the errors at each step.
Step 1 For any cell c E S and i = 1 ... s, we say that i preserves c if ||F(z
(,))
- F(xc)||r T/24and gj(c') 4 gi(c) for all other c' E S. That is, there is no collision from the hashing process, and the total amount of distortion due to the noise y is small. Let P = {(i, gi(c)) : i preserves c}. Note that P C R. We show that P is large and that most of R is in P.
'Technically, we replace each I in u with an arbitrary j before running the decoding algorithm, since the decoding algorithms don't know about I.
Lemma 6. With probability at least 7/8,
|P| > (1 -3)sk.
Proof. Consider any pair (c, i) E S x {1 ... s}, and let
j
= gi(c). If i does not preserve c, it must bebecause either (i) there is another cell c' E S', c' j c such that gi(c') =
j,
or because (ii) the total noise affecting zj, equal to F(j) Eg(c)_j F(pc), has norm at least T/24.By Lemma 3 with probability at least 7/8 the number of pairs affected by (i) is at most 32ksjS'I/q.
The event (ii) is determined by the noise vector p. However, for each i, there are at most <
24yk additional cells c E S that are not preserved under i due to this reason.
Altogether, the total number of pairs (c, i) such that c is not preserved by i is at most
32sk
|S'l
/q + 24-ysk = [32r(1 + 16a) + 24y]sk = #skas desired. E
Lemma 7. With probability at least 3/4,
IR
\
P|
6sk.
Proof. Any element (i,
j)
of R \ P ("heavy but not preserved") must belong to one of the followingthree categories:
1.
j
= gi(c) for c E S such that c is not preserved by i. By the previous lemma, there are atmost 3sk such pairs (c, i) with probability at least 7/8.
2.
j
= gi(c) for some cell c E S' \ S. There are at most 16ask such pairs (c, i), with probabilityat least 7/8.
3. The vector F(pj) =
Eg(c)=j
F(pc) has norm at least T/2. There are at most 2-ysk such pairs(i,
J).
This implies that with probability at least 3/4 the total number of pairs (i,
j)
E R \ P is at most (#+ 16a + 2-y)sk = 6skas desired.
Step 2 Observe that the elements of F(P) can be clustered into k clusters of diameter T/12.
Thus, by the previous lemma, there is a k-clustering of all but 6sk elements of F(R) such that the diameter of each cluster is at most T/12. We now apply a 6-approximation algorithm for this problem, finding a k-clustering of F(R) such that the diameter of each cluster is at most T/2. Such
an approximation algorithm follows immediately from the 3-approximation algorithm for k-center with outliers given in [CKMN01].
Step 3 Consider cells c, c' E S such that c is preserved by i and c' is preserved by i'. If F(
and F(z,,)) belong to the same cluster, then it must be the case that c = c', since otherwise the
distance between them would be at least T - 2T/24 > T/2. In other words, for each 1, if
ul c
Pn
R,contains at least one element of P, then all the elements of ut are "derived" from the same cell.
Lemma 8. With probability at least 3/4, u1 ... Uk contain a total of at most 26sk errors and
(6
+
/)sk erasures (i, 1 such that u =-L).Proof. Let R" = R \ R' = R U . - Rk. Let P'=PfnR', and P" = P n R".
Note that
|P'\
|R'j
6sk. Each error in u 1 ... uk corresponds to a unique element of R"\
P",and we have
jR"
\
P"|
|R" \ P| + |P \
P+
P"\
IR
\
P|
+
|P'|
sk
+
sk
=
26sk.
Additionally, ul ... uk contain at least P" elements total, and so the number of erasures is at most
sk - P"| = sk -
JP|
+ \P'| -53sk + Ssk, where we use |P| (1 - )sk from Lemma 6. 0Step
4
We can replace erasures by errors, and conclude that ul ... uk have a total of at most(36 +
#)sk
errors. It follows that at least k/2 of them have at most 2(36+#
)s errors, and thereforecan be decoded. Therefore, the set D = {dl ...
d}
contains at least k/2 elements of S.Theorem 9. Assume k > C log N for some constant C, a signal x with k objects, and a noise vector
p, all subject to the constraints delineated in the Model description of Section 1. There is a
distribu-tion over random binary m x N matrices A, m = O(k logk N), and an associated recovery algorithm
with the following property. Suppose that the algorithm is given Ax' for x' = x
+
P. Then theal-gorithm recovers (with probability at least 3/4) a set D of k cells, such that at least k/2 of the cells fully containing an object are included in D. Moreover, the matrix has column sparsity Q(logk N).
Chapter 3
Applications to attitude
determination
Star trackers determine their attitude, or 3-axis orientation, by taking pictures of the sky and identifying stars in the image. We provide a detailed review of the current technology in the first section below. We then present a compressive sensing algorithm for attitude determination, along with a discussion about hardware implementation. Finally, we present results from a software simulation of the algorithm.
3.1
Current star trackers
A star tracker is essentially a digital camera, called a star camera, connected to a microprocessor.
We describe various characteristics of the camera hardware and star identification algorithms.
3.1.1 Numbers
We first provide some numbers from [Lie02] and [WL99] to give a sense of scale. As of 2001, a typical CCD star tracker consumes 5-15W of power. A small spacecraft uses 200W of power, and
a minimal one uses less than 100W, so this can be a substantial amount.
A high-end star tracker can resolve approximately the same set of stars that an unaided human
can on a moonless night away from all light pollution. The number of stars in a star tracker's database varies from 58 to many thousands. The camera's field of view can vary from 2 x 2 degrees to 30 x 30 degrees, or anywhere from .01% to 4% of the sky. For comparison, the full moon is about .5 degrees across, and an adult fist held at arm's length is about 10 degrees across. A CCD camera can have up to a million pixels, and the accuracy of the final attitude is usually around .001 degrees (1 standard deviation), compared to .01 degrees for the next best sensors. The attitude is updated anywhere from 0.5 to 10 times a second.
3.1.2
CCD and CMOS
CCD (charge-coupled device), and CMOS/APS (complimentary metal-oxide semiconductor/active
pixel sensor) are the two different types of sensors used in star cameras. We abuse notation and use CCD/CMOS to refer to the sensor, an n x n array of sensors, the architecture of this array, and the star cameras they are a part of. Both CCD and CMOS turn incoming photons into electrons using the photoelectric effect, read the electrons as a single voltage or charge, and then digitize the
charge with an analog to digital converter (ADC).
The CCD has a single ADC located in the corner of the pixel array. A CCD array is read as follows: each pixel repeatedly transfers its charge into a neighboring pixel, so that the charge from any given pixel eventually travels a taxicab path to the ADC. Since the ADC only digitizes one pixel at a time, it takes 0(n 2) time to read the whole array. In addition, each such charge transfer
leaves a fraction c of the electrons behind, where 1 - e equals the charge transfer efficiency. The electrons in each pixel are transferred 0(n) times, and in practice it is costly to achieve c < 10-6,
which puts a bound on the maximum size of a CCD array [Hol98, Fos93]. Even if future technology were to allow a better charge transfer efficiency, it is worth noting that there are a total of 0(n3)
charge transfers, which is super-linear in the number of pixels, and that each charge transfer will still use a high constant amount of power.
On the other hand, CMOS devices have an ADC built into every pixel. This solves all of the problems noted above, and adds another important feature: random access reading. In other words, we can choose to read and digitize only a subset of the pixels, and in practice, that is done, saving power and subsequent digital processing costs [Lie02]. However, the ADCs take up valuable real estate, and reduce the percentage of the chip that is available to collect photons. CMOS devices also generate substantially more noise than CCDs, furthering reducing the signal to noise ratio [LitO1].
In practice, many consumer products such as cell phone cameras use CMOS, while scientific instru-ments use CCDs. Nevertheless, star trackers on small or low-power-budget satellites are starting to use CMOS, forgoing factors of 10 and higher in precision. We give the specification of a CCD tracker and a CMOS tracker in current (2011) production to illustrate the difference, as well as some of the numbers in highlighted in Section 3.1.1. The CT-602 Star Tracker has a CCD camera and is made by Ball Aerospace & Technologies. It uses 8-9W of power, weighs 5.5kg, has 6000 stars in its database, an 8 x 8 degree field of view, 512 x 512 pixels, an attitude accuracy of .0008 degrees, and updates 10 times a second [Bal]. Comtech AeroAstro's Miniature Star Tracker uses < 2W of power, weighs .4-.8 kg, has 1200 stars in its database, a 24 x 30 degree field of view, and 1024 x 1280 pixels, but has an accuracy of only .03 degrees and updates only 2 times a second [Com].
3.1.3
Star tracker operation
We now study the process of attitude determination in more detail. As noted in Section 1.2, we often have an approximate attitude and go directly from Step 1 to Step 4.
0. Celestial intuitions Let the apparent mass (hereafter, mass) of a star be the number of
photons from the star that reach our camera. The masses of the stars in the night sky follow a power-law distribution, with exponent -1.17 [Lie02].
The stars are essentially infinitely far away, and can be treated as point sources of light. In particular, if a star camera were perfectly focused, the light from any given star would land on exactly 1 pixel, and we would not be able to resolve the centroid of any star at higher than pixel resolution. Star camera lenses are therefore intentionally out of focus, so that the light from a star lands on multiple pixels. which we can then average to get a centroid with sub-pixel resolution. The blurring can be mimicked by convolving the image with a Gaussian of radius .5 pixels1 [Lie02], after which most of a star's mass lands on 4-6 pixels. Note that this number is independent of the star's mass, the field of view, or the total number of pixels.
Additionally, all the stars that are visible to star trackers (or humans) are a part of the Milky Way galaxy, which is shaped like a disk. This means that the stars are not distributed uniformly over the sky. The density of stars varies by a factor of 4 [LOA05]; Figure 3-3 in Section 3.3 gives some intuition. Most star trackers with a small field of view are not able to resolve the area perpendicular to the galaxy.
1. Image acquisition The expected number of photons (i.e. mass) captured by a pixel is proportional to the area of the lens and the exposure time. Photons hit a pixel, and eject an electron with some constant probability via the photoelectric effect. The pixel is then read and digitized (Section 3.1.2).
Almost all the noise is introduced at this step. The signal-dependent portion of the noise, shot
noise, is due to random photon arrival times. This is best modelled by a Poisson distribution,
which can be approximated as a Gaussian with a standard deviation equal to the square root of the expectation [Hol98]. For example, if a pixel expects to see 900 photons, it will see 900 photons with a standard deviation of
V9-0
= 30 photons.There is also a large per-pixel component of the noise, which depends on the hardware, temperature, and other factors. See [Hol98] for a summary.
'Technically, we want to use an Airy function, not a Gaussian. But for a blur of radius .5 pixels a Gaussian is a good approximation.
2. Centroiding We locate a set of stars S in the image, by finding pixels with a value several
standard deviations above the mean. We then centroid each star, by either taking the weighted mean of a few neighboring pixels, or by doing a more complicated Gaussian fitting. For a bright star, this can give a centroid resolution of .1 pixels in each dimension, even under moderate noise. There are several errors that can occur here. If the threshold for being a star is low, we may get stars that are composed only of noise. If our catalog is incomplete (as it almost certainly will be), we may get stars in S that aren't in the catalog. Finally, radiation or dust can occasionally cause
a pixel to have an arbitrary value, in which case it might get classified as a star.
3. Star identification In this step, we match the stars in S to an onboard database. If S
has zero or one stars, there is nothing to do, and we give up. Some star trackers may be able to make an identification when |S = 2, but we assume that |SI > 3. We explain the algorithm
from one common star identification algorithm [Mor97], since almost all of them follow the same outline [SM09].
Preprocessing Depending on the size of the lens, the capabilities of the processor, and the expected
signal to noise ratio, anywhere from a few dozen to tens of thousands of stars are selected from a catalog. The star tracker firmware is loaded with a data structure D that stores all pairs of stars that can appear in the same picture, along with their distances.
In space We check subsets of three stars from S to see if they can form a valid triangle using edges
from D. Once we find one, (and if |SI 4), we try to find a fourth star from S such that all
(2)
distances are consistent with D, in which case we declare a match. We then use the 3-4 matched stars to determine an approximate attitude.Even with tens of thousands of stars, it is extremely unlikely that we find a match that is consistent with D that ends up being wrong. In other words, most quadrilaterals consistent with D are far away from all other such quadrilaterals, and most quadrilaterals formed using erroneous stars match nothing. However, it is possible for there to be no noise in Steps 1-2 and still not have a match, due to catalog errors and omissions.
4. Precise attitude computation We use the approximate attitude information and the
on-board database to obtain the rough location of other stars in the picture. The attitude is then refined using the centroids of those stars as well.
Note that with a CMOS imager, if we start with an approximate attitude, we can actually skip most of Step 1 as well, and only read and digitize the handful of pixels under the stars we want to centroid.
3.2
Specialization of the general algorithm
We specialize the theoretical algorithm presented in Chapter 2 to obtain a new algorithm for attitude determination, which we call Attitude Determination Under Analog Folding (ADUAF). The local geometric objects turn in to stars, and the features we use are star centroid and mass. We use fcr as our underlying error correcting code, rather than fRs (Section 2.2).
The biggest change from the theoretical algorithm to the practical algorithm is that we assume the stars are randomly rather than adversarially distributed. This means we no longer need to compose our error correcting code with the hash family
'Wp.
Additionally, we no longer need to shift the grid G by the random vector v, as we do in Section 2.3. In fact, the notion of a grid is no longer needed at all, and we allow the decoded cell d' (Section 2.4) to be any w' x w' patch of the original image.Given the physical cost of splitting the signal, the column sparsity s is set to the smallest value our algorithm can tolerate, which is 2. This has the additional effect of turning the clustering process from Step 2 of Section 2.4 into a much simpler bipartite matching process.
Finally, rather than just recovering the w' x w' patch d', we recover the centroid of di, or the centroid of the star on d'. We then run the recovered centroids through the star identification process of Section 3.1.3. The full algorithm is presented below.
Measurements
If pi and P2 are the primes used to construct the CRT code in Section 2.2, we find primes p' such that p'z
Vip.
Note that we don't literally need p' and p' to be prime, as long as they are relatively prime, since the Chinese Remainder Theorem from Step 4 of the recovery algorithm applies for relatively prime numbers as well. We will use the word prime to refer to p' and p' even when they are just relatively prime.Notating the noisy incoming signal x' as an n-by-n image, we define z' to be a p'-by-p' image with
zi [i,2 i = z'[ci, C21.
ci=ji (mod pi)
c2mj2 (mod pg)
We say we fold x' to obtain z'. Figure 3-1 provides some intuition.
We actually think of each zi as a torus, and identify the top/bottom and left/right edges together, allowing recovery of stars that are on the edge of the folded picture. Since the stars were assumed to be randomly distributed in x', they are randomly distributed within each zi as well. Also, one could define the "measurement vector" z to be a 1-dimensional representation of the pair (z1, z2),
n
lo
3 /U
4s/m7 8 9
Incoming signal x'4
5
6
7 8 9 Incoming signal x' 3 /4/ 6 ssum z2Figure 3-1: Taking measurements with column sparsity 2. Picture idea from [UGN+09].
and construct a measurement matrix A accordingly. as a 2-dimensional image.
However, it is more useful to think of each z'
Recovery algorithm
We follow the presentation of the corresponding paragraph in Section 2.4. For concreteness, we use a few specific numbers from our software implementation in Section 3.3.
1. In each z*, we identify ten 3 x 3 (w x w) cells with high mass such that no 2 cells collide in
more than 4 pixels. We allow the 3 x 3 cells to wrap around the edges of z*, as in a torus. 2. In place of the k-centering algorithm, we greedily choose up to 8 pairs of cells (cI, c2) from
(z1, z2) such that the feature vectors F(c') and F(c2) are close. In our case, F(c) is a triple
of values: the mass of c, along with two coordinates for the centroid of c.
3. No longer needed. Each pair from Step 2 corresponds to one of the u .
4. In place of the error correcting code, we simply apply the Chinese Remainder Theorem in each dimension to recover a 3 x 3 region of the original image for each pair from Step 2. We compute centroids of the recovered 3 x 3 regions, by averaging the centroids (weighted by mass) of the corresponding 3 x 3 regions of z1 and z2. This is now S in Step 3 of Section 3.1.3.
Potential hardware
We have identified several existing hardware architectures that implement the folding mechanism above. In our case, we would use s copies (s = 2 above) of the folding hardware, where s is the column sparsity. We call each of the stacked squares in Figure 3-1 a piece of the image. We denote the number of pieces by T (T
=
9 in both z and z2 in Figure 3-1), or alternatively, r is roughlythe compression ratio N/zi. After being folded, each piece of the image lands on the focal plane, which has an array of z2 pixels.
The most plausible architecture uses mirrors to directly reflect the pieces of the image onto the focal plane. The single-pixel camera [DDT+08] implements a generalized version of this for zi - 1 using
n moving mirrors. We would use r rigid mirrors for each z1, which is a substantial simplification of what they implemented.
Another possibility is to use r different lenses, each of which focuses one piece of the image onto the focal plane [UGN+09]. The challenge with this design will be making all the lenses face the same direction.
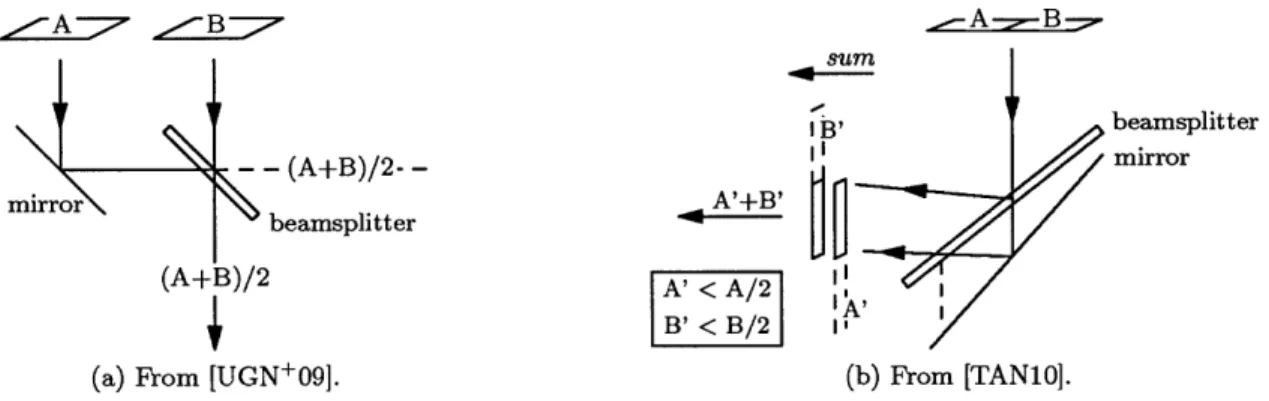
The remaining two architectures are designed for unrelated earth-based tasks, and are more waste-ful of the signal than is appropriate for a star tracker. Nevertheless, they show the extent to which researchers are already thinking about hardware designs for folding. Both of the designs use beam-splitters and mirrors to combine the signal, and lose a factor of r from the signal in the process. Figure 3-2 depicts an element from each design. To extend 3-2(a) to r pieces one would use log r
different such image combiners, and to extend 3-2(b) to r pieces one would use V - 1 stacked beamsplitters plus a mirror to fold in one direction, and
fr
-1 stacked beamsplitters plus a mirror to fold in the other.A -- 7 /B-7 .---A -r_-B-sum 1 B? beamsplitter - - (A+B)/2- _ I mirror mirror A+B' (AB)/2A' < A/2 B' < B/2
(a) From [UGN-09]. (b) From [TAN10].
Figure 3-2: Two examples of how to combine pieces of an image using a mirror and beamsplitter. Dashed lines indicate lost signal.
Finally, it is possible we could split the signal and fold it after it hits the focal plane but before it gets digitized, which would not save on sensor costs, but would reduce the number of ADC computations, and reduce the load on the onboard processors. CCD images quarry an entire row of the image before digitizing [Lit0l], so folding in at least the first dimension could be relatively easy. CMOS imagers are already built directly onto integrated circuits, so additional circuitry for folding is likely to be cheap [RGL+10]. Several (non-satellite) CMOS imagers have already been built that use dense compressive sensing matrices to reduce the number of measurements that need to be digitized [RGL+10, MJS+10}.
3.3
Software implementation
We implement the algorithm presented in Section 3.2, and run experiments on simulated images. Commented source code is available at http://web.mit.edu/rishig/papers/local-geo/.
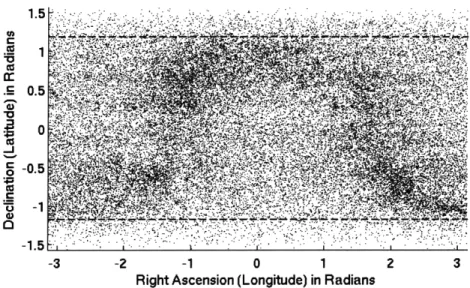
For simplicity, we project the stars onto a rectangular interval, rather than operating on a sphere (Figure 3-3). We index the rectangle by right ascension (longitude) a E [-7r, 7r] and declination (latitude) 6 E [-7r/2, 7r/2]; for example, J = 0 is the equator, and 6 =7r/2 is the north pole. So
that the approximation makes sense, we ignore the portion of the sky where 161 > r/2 - 7r/8 (the dashed blue lines in Figure 3-3). This also has the effect of removing the portion of the sky that has the fewest stars, which some star trackers don't operate on anyway. We assume without loss of generality that the camera is axis-aligned.
Brightest 40000 stars in the Night Sky
1. 5 C . 05
5
g 43 0 -0.5 u - -1I
W2-DR9
-3 -2 -1 0 1 2 3Right Ascension (Longitude) in Radians
Figure 3-3: Mercator projection of the night sky. The dense omega-shaped region is the central disk of the galaxy. We test our algorithm on the area between the dashed blue lines.
We fix n = 800 (N = 640000) for all experiments. We expose the camera to a .08 radian by .08 radian (4.6 by 4.6 degree) patch of the sky, which means that a typical image will have 3 to 10 bright stars (10%-ile to 90%-ile) and 50 to 150 stars that act as background noise. Above, we defined the mass (apparent mass) of a star to be the number of photons from the star that hit our camera. In our pictures, if the median total star mass is scaled to 1, the 10%-ile mass is .6, and the 90%-ile mass is 2.25. The mass of the jth brightest star in the sky is
E(j-1
-1 7
).
We choose the stars for the preprocessed database D (Step 3 of Section 3.1.3) as follows. We extract a subset SAO' from the Smithsonian Astrophysical Observatory (SAO) Star Catalog [Smi],
by taking the 10 most massive stars in every ball of radius .08 radians. SAO' has 17100 stars, compared to 259000 stars in SAO.
the blue lines of Figure 3-3, and use the SAO star catalog to simulate star positions and mass. We convolve the stars with a gaussian of radius .5 pixels, which causes the vast majority of a star's mass to fall within a 3 x 3 box. We then apply poisson noise to account for photon arrival times, and fold the image using two relatively prime numbers. We add gaussian noise (amount varying
by experiment) to each pixel of both folded images to account for all signal-independent sources of
noise. Notably, we do not account for the poisson noise introduced by splitting the signal; rather than applying poisson noise, then folding, and then applying gaussian noise, we should have folded, then applied poisson noise, and then applied gaussian noise.
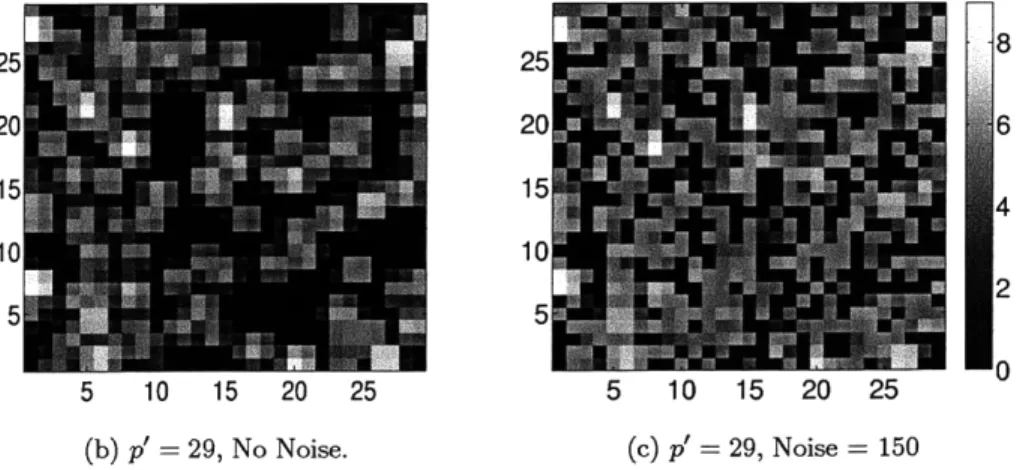
Figure 3-4 has a few pictures to help build intuition about star density and what stars look like. It is generally possible to see where the biggest stars are located, though some fraction of them get
occluded by small stars or noise.
200 400 600 800
(a) Underlying noiseless signal x (zoom in).
5 10 15 20 25
(b) p' = 29, No Noise.
5 10 15 20
(c) p' = 29, Noise = 150
Figure 3-4: log(mass) in sample images from a representative part of the sky. The right applies to all three images. We cut off pixels with values below 0 before taking
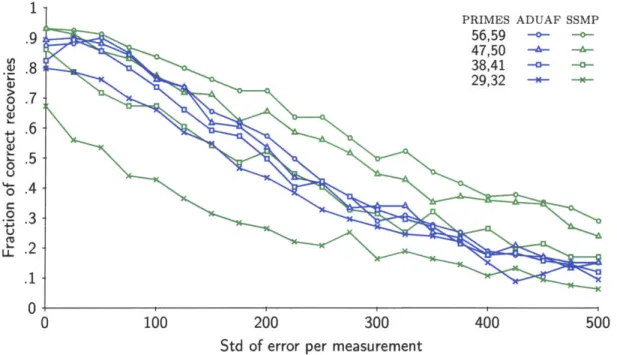
legend on the the log in (c). We run our algorithm, ADUAF, as well as Sequential Sparse Matching Pursuit (SSMP) on 159 images of the sky. SSMP includes a linear (in N) time sparse binary compressive sensing recovery algorithm, with recovery quality on par with other known methods [BI09]. We use the same folded
images, or equivalently, the same measurement matrix, for both algorithms.
ADUAF recovers a list of centroids, and we find and centroid stars in the image recovered from SSMP. We run the star identification algorithm from Step 3 of Section 3.1.3 on the outputs of both
of them, and declare success if they identify the stars correctly. We report our results as a function of the standard deviation of the added gaussian noise (Figure 3-5).
100 200 300 400
Std of error per measurement
500
Figure 3-5: Experimental results. underlying images.
Each point on the figure is computed using the same 159
The first observation we make is that ADUAF works very well down to an almost minimal number of measurements. The product p'p' has to be greater than 800, and the minimal set of primes is 26 and 31. As the number of measurements increases, SSMP catches up and surpasses ADUAF, but we note that running SSMP (implemented in C) takes 2.4 seconds per trial on a 2.3 GHz laptop, while ADUAF (implemented in Octave/Matlab) takes .03 seconds per trial. Computation power on a satellite is substantially lower than that of a low end laptop, and given that the entire acquisition has to happen in .1 to 2 seconds, it seems unlikely that any algorithm linear or near linear in N is going to be practical. Finally, we note that the plot lines for both SSMP and ADUAF could be improved by a more sophisticated implementation of the star identification algorithm.