HAL Id: hal-03078808
https://hal.archives-ouvertes.fr/hal-03078808
Submitted on 5 Jan 2021HAL is a multi-disciplinary open access
archive for the deposit and dissemination of sci-entific research documents, whether they are pub-lished or not. The documents may come from teaching and research institutions in France or abroad, or from public or private research centers.
L’archive ouverte pluridisciplinaire HAL, est destinée au dépôt et à la diffusion de documents scientifiques de niveau recherche, publiés ou non, émanant des établissements d’enseignement et de recherche français ou étrangers, des laboratoires publics ou privés.
Discrete confidence levels revealed by sequential
decisions
Matteo Lisi, Gianluigi Mongillo, Georgia Milne, Tessa Dekker, Andrei Gorea
To cite this version:
Matteo Lisi, Gianluigi Mongillo, Georgia Milne, Tessa Dekker, Andrei Gorea. Discrete confi-dence levels revealed by sequential decisions. Nature Human Behaviour, Nature Research In press, �10.1038/s41562-020-00953-1�. �hal-03078808�
Accepted for publication in Nature Human Behaviour
https://www.nature.com/articles/s41562-020-00953-1
DOI: 10.1038/s41562-020-00953-1
Discrete confidence levels revealed by sequential decisions
Matteo Lisia,*
Gianluigi Mongillob,c
Georgia Milned
Tessa Dekkerd,e
Andrei Goreaf,2
a Department of Psychology, University of Essex, Colchester, UK b Institut de la Vision, Sorbonne Université, Paris, France
c Centre National de la Recherche Scientifique, Paris, France
d Institute of Ophtalmology, University College London, London, UK
e Division of Psychology and Language Sciences, University College London, UK f Université Paris Descartes, Sorbonne Paris Cité, Paris, France
* Corresponding author: [email protected]; ORCID 0000-0003-3554-385X 2 Deceased January 7th, 2019.
Abstract
Humans can meaningfully express their confidence about uncertain events. Normatively, these beliefs should correspond to Bayesian probabilities. However, it is unclear whether the normative theory provides an accurate description of the human sense of confidence, partly because the self-report measures used in most studies hinder quantitative comparison with normative predictions. To measure confidence objectively, we developed a dual-decision task in which the correctness of a first decision determines the correct answer of a second decision, thus mimicking real life situations in which confidence guides future choices. Whilst participants were able to use confidence to improve performance, they fell short of the ideal Bayesian strategy. Instead, behavior was better explained by a model with a few discrete confidence levels. These findings question the descriptive validity of normative accounts, and suggest that confidence judgments might be based on point-estimates of the relevant variables, rather than on their full probability distributions.
Introduction
Decision making is faced with uncertainty for every organism. A growing amount of evidence indicates that humans use estimates about the uncertainty of sensory data to guide their behaviour, for example when combining information from multiple sources1. Moreover, other studies have shown that
humans can judge the accuracy of their perceptual decisions (an ability that belongs to the domain of metacognition) and report degrees of confidence that correlates with their objective performance2. This
sense of confidence is an essential component of decision making (e.g. the decision to undertake a risky operation depends on the confidence in a correct diagnosis), but the underlying computations are unclear. According to one popular view confidence is Bayesian: it should coincide with the posterior probability that a choice was correct, computed following the rules of Bayesian inference. Although human confidence judgements tend to be qualitatively consistent with statistical principles3, such
qualitative agreement is neither necessary nor sufficient to conclude that the underlying computations are indeed Bayesian4 - in the sense that they explicitly use probability distributions to quantify
uncertainty. Indeed, other studies have shown deviations from Bayesian optimality5, which suggest that
confidence judgements could instead be based on simpler or approximated strategies.
One major issue for testing the Bayesian account of human confidence is methodological, and lies in the difficulty of measuring subjective probabilities, i.e. the degrees of belief that a human observer assigns to events. Subjective probability can be formally defined as the marginal rate of substitution6,7:
our subjective probability about the event E occurring or having occurred would be p(E) if we are indifferent to gaining one unit of utility contingent on E against gaining p(E) units of utility for sure. Methods that measure subjective probabilities in perceptual decisions using opt-out or post-decision wagering techniques are straightforward operationalizations of this definition. A well known problem with these methods, however, is that they rely on unverifiable assumptions about the utility function of the participant7 - such methods cannot disentangle subjective probability from factors such as
opportunity costs. More frequently used methods that requires explicit confidence ratings suffer from miscalibrations and response biases2,8,9 that hinder a rigorous, quantitative comparison of human
behavior with the predictions of the Bayesian account. Yet another approach involves confidence forced-choice paradigms10, in which observers engaging in perceptual discrimination can improve their
performance by choosing the less uncertain among pair of stimuli. While this technique allows quantitatively accurate measurement of the ability to discriminate different levels of uncertainty across stimuli and tasks, it cannot detect global biases in confidence: observers may make accurate comparative judgements while overestimating or underestimating by a large amount their probability of being correct.
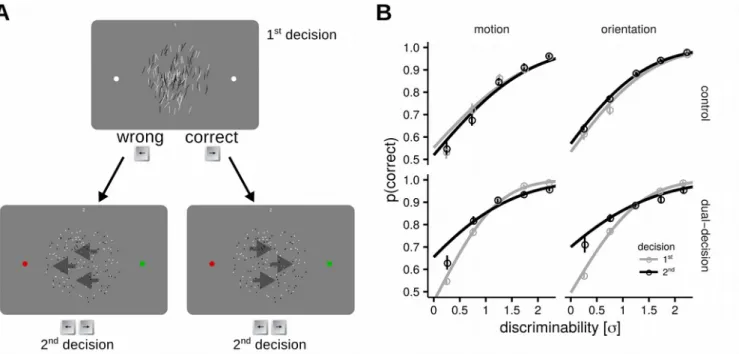
Here, we present an approach for studying subjective probabilities that allows us to detect confidence biases and directly compare human behaviour with the ideal Bayesian strategy and alternative models. In our experiments, human observers were presented with two consecutive signals and asked to decide whether they were above or below a reference value. The key innovation was that the statistics of the second signal were made contingent upon the decision-maker making a correct decision about the first signal. More specifically, correct/incorrect first decisions resulted in signals above/below the reference value for the second decision. An implementation of this experimental protocol is shown in Fig. 1A: participants first indicate whether the orientation of the random array of lines is tilted left or right from vertical (first decision). After this response, they are presented with a dynamic random-dot motion stimulus, and asked to report its direction (second decision). Crucially, the direction of the random-dot stimulus depends deterministically on the correctness of the first decision: if the first decision was correct, then the motion will be to the right in the second decision, otherwise it
will be to the left. Participants were informed about this rule, and were requested to use it to maximize their accuracy. It was impossible to know with certainty whether the first decision was correct and what the second response should be, as the difficulty of both stimuli was varied randomly from trial to trial, independently of whether the correct response was left or right. However, participants could assess their confidence in being correct on the first decision and use it to update prior expectations in the second decision and improve their performance. This paradigm mimics realistic situations in which confidence in past decisions, in absence of immediate feedback, is used to guide behaviour and inform future decisions, rather than being reported onto a rating scale without real consequences.
Figure 1. Dual-decision paradigm and results. A. Dual-decision paradigm: in this example the first decision is about the
average tilt of an array of lines, and is followed by a second decision about the predominant direction of a random dot motion pattern. The central area of the screen where the stimulus was presented was sided by two dots, which were white for the first decision but turned red and green for the second one, to remind which directions were to be expected in case of incorrect and correct first response, respectively. The difficulty of both decisions (the opposite of the evidence discriminability, e.g. mean tilt from vertical or motion coherence, quantified as standard deviation of internal noise, σ) is) is drawn from the same uniform distribution (and therefore is, on average, equal), however the direction of the signal in the second decision (left vs right) was made dependent on the accuracy of first response. Each participants ran the task in both ways (i.e. orientation-motion and motion-orientation) in both the dual decision task and in a control condition where the direction of the signal was randomly drawn regardless of their responses. B. Performance plotted as a function of discriminability in the control conditions (top facets) and in the dual-decision conditions (lower facets). In the dual-decision
task performance at either of the two visual tasks is higher in the second decision, especially for trials where the discriminability is small and, in the absence of prior information, performance near chance. Note that the data was grouped according to the perceptual task (motion, orientation) to highlight the effect of decision order within a single perceptual task. Thus, the panels displaying performance in motion and orientation judgments contain data from two different sessions with alternated task order. Error bars represents standard errors of the mean across participants; the curves show probit fits to the aggregated data.
Results
Confidence as a prior in sequential decisions: the dual-decision task
The paradigm used in the experiments is illustrated in Fig. 1A with an example of the orientation-motion discrimination task (experiment 1, see Methods for details). Participants made a first decision about the mean tilt of the array of lines, followed by a decision about the direction of a random-dot motion stimulus. Correct/incorrect first decisions determined whether the direction of the random dot motion pattern was rightward/leftward, respectively, and this rule was known to participants. All participants also ran a version of the experiment with the two discrimination tasks presented in the reverse order (first motion then orientation), see Methods for details. To control for sequential effects on responses between first and second decisions we included a control condition in which the second stimulus was independent of the first decision. We collected 2 independent datasets (with dataset 2 being a replication run on a different cohort of participants; see Methods). For completeness here we present statistical tests conducted both on the aggregated data as well as on the two datasets separately. Overall,we found a significant effect of decision order in the dual-decision condition (Fig. 1B): the mean odds-ratio of participants responding correctly in the second decision relative to the first one was greater than one: 1.51, 95% CI [1.28, 1.61], t(28)=6.03, p=1.66×10⁻⁶. The effect was significant when
tested separately in dataset 1, mean odds-ratio 1.48, 95% CI [1.24, 1.64], t(13)=4.78, p=7.19×10⁻⁴; as
well as in dataset 2, mean odds-ratio 1.55, 95% CI [1.21, 1.74], t(14)=3.88, p=3.33×10⁻³
(Bonferroni-corrected p-values). There was no statistically significant effect of decision order in the control condition: 1.07, 95% CI [0.96, 1.19], t(28)=1.21, p=0.23; the estimated Bayes factor (null/alternative) indicated that the data were 3.46 times more likely under the null hypothesis, indicating moderate support for the null hypothesis. We obtained similar results when analyzing the control condition separately for each dataset: dataset 1, mean odds-ratio 0.97, 95% CI [0.84, 1.15], t(13)=0.33, p=1.00; dataset 2, mean odds-ratio 1.17, 95% CI [1.00, 1.33], t(14)=2.39, p=0.06 (Bonferroni-corrected p-values). In sum, these analyses show that participants were able to exploit the structure of the task and use their confidence to improve their performance in the second decision. Subsequent analyses focused on the dual-decision condition and were conducted on the aggregated data; importantly the size of the effect of decision order in the dual-decision condition did not differ across the two datasets: mean difference in odds-ratio 0.07, 95% CI [-0.28, 0.41], t(27)=0.18, p=0.85, the Bayes factor (null/alternative) was 3.70, indicating moderate support for the null hypothesis.
Ideal Bayesian observer
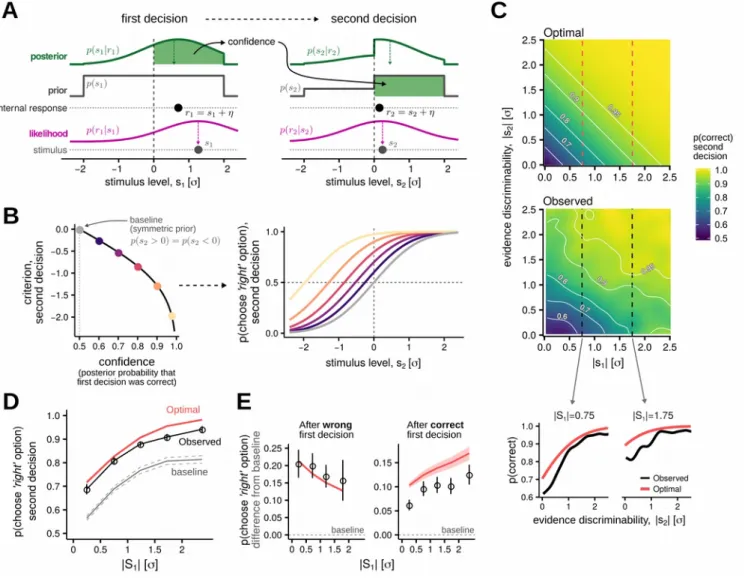
We considered how a Bayesian observer would solve this task (Fig. 2A). The observer’s task is to decide whether the stimulus value (e.g., the mean tilt from vertical in the orientation task) is greater or smaller than a reference level, call it zero. However, the observer has access only to a noisy estimate of the stimulus value. To decide whether the stimulus is greater or smaller than zero, the Bayesian observer would integrate the posterior probability of the stimulus over the corresponding semi-interval and choose the most likely alternative. The probability of the chosen alternative also corresponds to their confidence in the decision (the posterior probability that the choice was correct). The confidence is then used to update prior expectations about the second signal: the Bayesian observer assigns a prior probability equal to their confidence to the possibility that the second signal will be positive (e.g. corresponding to a ‘right’ tilt), and the complement of this probability to the alternative possibility. Updating the prior amounts to shifting the criterion used for the second decision by an amount that
increases with confidence (Fig. 2B; see Supplementary Information for details). Trials with higher confidence in the first decision then result in a larger prior probability for ‘positive’ stimuli and, hence, a stronger bias for responding ‘right’ in the second decision (Fig. 2B). This bias can be quantified by examining how choice probabilities in the second decision vary as a function of the discriminability of the first stimulus. Note that, because the signal sign in the second decision depends on the accuracy of the first decision, an increase in the discriminability of the first stimulus will result in an increased rate of responding ‘right’to the second stimulus regardless of observer’s use of confidence information (Fig. 2D). Thus, we examined differences in choice probabilities relative to baseline probabilities that would be obtained given completely independent responses to the two stimuli. When averaged over all trials, the observed pattern of choices displays a trend similar to that predicted by the Bayesian model (Fig. 2D), which is remarkable considering that this model is fully constrained by the data. To provide a more stringent comparison between human behaviour and the Bayesian model, we next split data according to the accuracy of the first decision: confidence should decrease with greater signal discriminability after an incorrect decision, and increase after a correct one3. However, while human
participants closely match the ideal after incorrect first decisions (Fig. 2E, left sub-panel), they systematically chose ‘right’ less frequently than the Bayesian observer after correct first decisions (Fig. 2E, right sub-panel). This pattern can be interpreted as an under-confidence bias and suggests deviations from the Bayesian strategy. Moreover, the finding of an under-confidence bias is inconsistent with sampling-based approximations of the Bayesian strategy, as these would predict an opposite over-confidence pattern (see Supplementary Information).
Human performance is not explained by a fixed bias
One possible explanation for the observed sub-optimality of behaviour is that participants did not monitor their confidence after each decision, but rather adopted a fixed bias towards responding ‘right’ in the second decision. Indeed, since they performed above chance in the first decision (mean proportion of correct first decision: 0.80), a fixed bias would improve their performance in the second. We estimated the best-fitting fixed bias for each participant and compared the predictions with the observed behaviour. As shown in Fig. 3A, the fixed bias model fails to explain how choice probabilities in the second decision vary with the discriminability of the first stimulus. As a further test, we fit logistic regressions for each participant to measure the influence of the accuracy of the first decision on the probability of choosing 'right' on the second decision. The results of this analysis indicate that, even after controlling for stimulus values, participants were significantly more likely to choose ‘right’ in the second decision after a correct first decision than after an incorrect one: odds-ratio 2.61, 95% CI [1.84, 3.55], t(28)=5.71, p=3.99×10⁻⁶ , indicating that they monitored their confidence on
a trial-by-trial basis rather than used a fixed strategy. Moreover, when adding the discriminability of the first stimulus as a predictor, we found that it modulates the probability of choosing ‘right’ in the second decision: for each unitary increase in discriminability, the odds-ratio increases multiplicatively by a factor of 1.95, 95% CI [1.42, 3.36], t(28)=2.95, p=0.006, after a correct response and decreases by a factor of 0.68, 95% CI [0.49, 0.95], t(28)=2.18, p=0.037, after an incorrect response. Taken together these results allow us to reject the hypothesis that the bias toward responding ‘right’ in the second decision was constant across trials and instead conclude that participants adjusted their criterion on a trial-by-trial basis
Figure 2. Ideal Bayesian model and comparison with human behaviour. A. Representation of probability density
function and belief updating in the Bayesian observer, first and second decision represented from left to right. The physical stimulus evokes an internal estimate or response corrupted by Gaussian noise, η~NN(0, σ) is2). The ideal observer knows about
the variability of its perceptual system and computes a posterior distribution over possible stimulus values. After having made the first decision, the ideal observer integrate the posterior distribution over the chosen semi-axis, to evaluate its confidence, that is the subjective probability that the decision was correct, given the evidence. The confidence is then used to update its prior for the second decision: a prior probability equal to the confidence is assigned to the possibility that the stimulus values will be drawn from the positive (rightward) semi-axis. B. It can be shown (see Supplementary Information) that updating the prior amounts to shifting the decision criterion: here we show on the left the optimal criterion shift as a function of the confidence level, and on the right the psychometric functions which describe choice probabilities for several confidence levels, ranging from 0.5 (grey) to 0.975 (yellow). C. Optimal and observed performance in the second decision, plotted as a function of both first and second stimuli discriminabilities (the 2D surface showing the observed performance was computed by smoothing the accuracy in individual trials, pooled from all observers, with a Gaussian kernel with standard deviation of 0.2). Although participants were able to use the structure of the task to improve their performance in the second decision (see also Fig.1B), their performance did not reach the ideal benchmark provided by the ideal Bayesian observer, as shown also by the two example cross-section at the bottom. D. Choice probability in the second decision was influenced by the discriminability of the first stimulus. This pattern is better appreciated when data are plotted as a difference from the baseline, that is a psychometric function that describes what would be the choice probabilities in the absence of prior information (corresponding to a confidence level of 0.5, illustrated with the grey dot and lines in panel B). All error bars indicate bootstrapped standard errors.
A biased-Bayesian model does not fully account for sub-optimal choice behaviour
An alternative explanation for the under-confidence pattern (Fig. 2D) is that participants might systematically overestimate their sensory noise (see Supplementary Information for details). To test for this possibility we computed for each participant how much the estimate of the noise should have deviated from the true value to explain the under-confidence pattern. We found that on average participants should have over-estimated their sensory noise by a factor of 2.94, 95% CI [1.99, 4.03]. This biased Bayesian model can account well for the under-confidence following correct first decisions (and therefore improve the overall fit compared to the unbiased Bayesian model, since correct first decisions were more frequent). However, over-estimating the internal noise reduce the bias toward responding ‘right’ both after correct and incorrect first decisions, thus degrading the model’s ability to predict performance after incorrect decisions (Fig. 3B). This indicates that participants not only were biased toward under-confidence (relative to the ideal) but also that confidence bias varied depending on the discriminability of the stimulus.
Non Bayesian models with discrete confidence levels provide the best description of human behaviour
The systematic deviations from Bayesian confidence exposed above could result from observers that are under-confident at large and small discriminability, but over-confident at intermediate discriminability. In other words, the function linking evidence to confidence must have a slope much larger than the one of the Bayesian observer in a small range of discriminabilities (going from small to intermediate). The simplest function with these characteristics is a step function (Fig. 3C). We note that a step function would result naturally if observers make decisions using a point estimate of the stimulus. In this case, confidence assessments must be obtained by comparing the estimate to fixed, possibly learned, criteria. If the observer has only one confidence criterion, then the resulting evidence-confidence function would have two evidence-confidence levels (low and high). In this case the observer would shift their decision criterion to increase the probability of responding ‘right’ only when in the high-confidence state (see Supplementary Information for details). We estimated the parameters of the discrete-confidence model and compared it against the alternative models described above. We compared the goodness of fit of models using the Akaike Information Criterion11 (AIC), which takes into account model complexity. An analysis of simulated data confirmed that the models were distinguishable and correctly recovered (see Extended Data Figure 3). The smallest AIC, indicating better fit, was attained by the confidence model. The AIC difference between the discrete-confidence model and other models (summed over subjects) revealed little or no support35 for the remaining models: the difference was 151 for the biased-Bayesian model, 95% CI [67, 253]; 343 for the fixed-bias model, 95% CI [163, 597]; and 1591 for the ideal Bayesian model, 95% CI [1020, 2240]. Additionally, we compared the models using a random-effects approach12,13, which assumes that different participants could have used different strategies, corresponding to different models, to generate their behavior (see Supplementary Information for details). The protected exceedance probability of the discrete model (the second-order probability that participants were more likely to use this model to generate behavior) was >0.99 and the Bayesian omnibus risk (the posterior probability that all models have the same frequencies) was 1.70×10⁻⁴ . The discrete model thus provides a better fit than the alternatives and can explain better the pattern of under-confidence following correct first decisions combined with the relatively high confidence following incorrect decisions (Fig. 3C). These high-confidence errors would occur whenever the internal signal not only has the opposite sign to the
physical stimulus (due to random noise fluctuations), but is also large enough to exceed the confidence criterion.
Figure 3. Alternative sub-optimal models. A. Fixed-bias model. B. Biased-Bayesian model. C. Discrete confidence
model. In both A, B and C the left panel shows the functions linking confidence to evidence in each of the models (for comparison each also panel includes the function of the ideal Bayesian observer); these functions were generated using the median of the estimated parameters across observers. Right panels show data and model predictions. Note in particular that the biased-Bayesian model, whilst providing an overall good fit to the data, tends to under-estimate the probability of choosing ‘right’ after a wrong decision more than the discrete model. This pattern is evident also in individual data (see Extended Data Figure 1). D. Model comparison: the top panel represents model frequencies estimates using a random-effects approach that allows heterogeneity in the models that participants used to generate behaviour12; the annotation
reports the (protected) exceedance probability of the winning discrete-confidence model, together with the Bayesian omnibus risk (BOR), i.e. the probability that observed differences in model frequencies are due to chance. The bottom panel represent differences in the Akaike Information Criterion, relative to the winning model, summed over subjects (see Extended Data Figure 2 for a plot of individual AIC values). All error bars and bands indicate bootstrapped standard errors.
Discussion
We presented an approach to study confidence in perceptual decisions objectively. Our protocol involves a sequential decision task in which participants may improve their performance in a second decision by using their confidence in the first. This experimental protocol not only allows for investigation of metacognitive monitoring, but also of metacognitive control of behaviour14. It can
therefore be regarded as a laboratory proxy of real-life situations where current decisions might depend on the pending outcomes of previous choices. One advantage of our experimental protocol is that it permits quantitative testing of hypotheses about the human sense of confidence without requiring arbitrary assumptions, for example about how participants map their subjective confidence onto an external rating scale in the case of self-report measures. Additionally, the current approach has the advantage that the decision strategy depends only on internal sources of uncertainty, as opposed to external ones, such as stochasticities in the environment, that typically elicit conservative and sub-optimal placements of decision criteria15.
Taken together our results revealed that participants performing the dual-decision task can meaningfully use confidence in a prior choice to inform subsequent decisions. However participants also exhibited specific and systematic deviations from the predictions of the ideal Bayesian model. Our analysis revealed that the relationship between the internal signals (the sensory evidence) and the confidence does not have the shape that would be expected if subjective confidence were computed as if by a Bayesian observer, by integrating a posterior probability distribution over the values of the stimulus that are consistent with the choice made. The pattern found in our data could instead be accounted for by an alternative, non-Bayesian model with only two discrete levels of confidence. This model posits that confidence is discretised in few distinct levels, as also suggested by previous work16.
More specifically, in our discrete model there would be two distinct confidence states: confident - i.e more likely that the response was correct - vs. non-confident - i.e., equally likely that the response was correct or incorrect (see Fig. 3C). This one confidence criterion variant of our model provided the best and most parsimonious description of the empirical data.
In the discrete model, sensory evidence is transformed to confidence via a discrete step function. This suggests that human observers do not assign numerically precise subjective probabilities to perceptual interpretations and implies that confidence in a perceptual decision may be based on only a single point estimate of the most likely stimulus, rather than on a full probability distribution over all possible stimuli5. Whilst this algorithmic description of the mechanisms underlying subjective
confidence valuation may seem simplistic, it could be the natural consequence of a limit in how much information can be accessed and used for meta-perceptual judgments. In fact the discrete model effectively compresses (in the information-theoretical sense) the amount of information that is encoded from the first decision and remembered for later use in the second decision (it compresses this information to only 1 bit). One intriguing possibility therefore, is that the critical constraint preventing subjects from accurately assigning probabilities and achieving optimality is a capacity limit in the information that is encoded for later use. This constraint could be formulated as a maximum limit in the mutual information between the internal evidence used in the decision and the internal variable representing the degree of confidence. This idea fits well with “second order” models of meta-cognition, which postulate a separation (in space and/or time) of the internal states supporting decision and confidence17 and assume that the samples of sensory evidence guiding decisions and confidence are
coupling emerges from the loss of information during confidence valuation. According to this idea the internal states supporting decisions and confidence could be viewed as the input and output of an information channel with limited capacity (i.e. with an upper bound on the rate at which information can be transmitted reliably). Our results thus provide additional support for the idea that any rational account of confidence needs to incorporate implementational constraints and resource limitations18 to
be descriptively accurate.
It is interesting to note that this pattern, in which subjective probabilities both overestimate and underestimate the objective probability in distinct sub-domains of the same task, resembles the distortions of subjective probability that have been found also in non-perceptual tasks, such as those involving decisions from experience19, suggesting that there may be common limitations in the internal
representation of subjective probabilities across different tasks. Additionally, the finding that confidence can be used to improve performance in our dual-decision task across different perceptual tasks (here motion and orientation) is, in principle, consistent with previous claims that confidence may be represented on a common scale and act as a ‘common currency’ between different perceptual judgments20,21. Indeed, in an additional ‘within-task’ experiment that involved the same type of
perceptual judgment in both decisions, we found a pattern of deviation from optimality that was qualitatively similar to that observed in our main experiment. However, quantitative modelling of the within-task experiment failed to provide decisive evidence in favor of either the discrete or biased-Bayesian models, leaving open the possibility that participants might be able to make slightly more efficient use of information when both decisions involve the same perceptual judgment (see Supplementary Results for details and a discussion of caveats in the interpretation of within-task experiments).
Finally, our results have implications for the current investigation of the neural substrate of confidence and metacognition, because many of these studies assume, more or less explicitly, that subjective confidence corresponds to the Bayesian posterior probability22,23. However, the evidence
supporting the hypothesis that Bayesian inference is algorithmically implemented in the brain is debated5,24,25 leaving open the possibility that the algorithms implemented by the brain may involve
heuristic shortcuts25. Distinguishing these possibilities requires novel experimental and theoretical
approaches to test the validity of Bayesian inference as a process model26 for the human sense of
confidence. In the present study we have not only found further evidence that brain processes that subtend confidence judgments do not conform to the ideal benchmark represented by the Bayesian models, but also provided a new experimental protocol that we believe will be a valuable tool for future investigations of confidence and metacognition and for translating advances in this field into concrete, theory-driven applications27.
Methods
Participants
All experiments were performed in accordance with the requirements of the Declaration of Helsinki. The experimental protocols were approved by the Research Ethics Committee of the School of Health Sciences of City, University of London and by the UCL Research Ethics Committee. A total of 31 subjects participated in the experiments (mean age 31, standard deviation 11; 12 females). The first 16 participants (dataset 1) ran the experiment at City University (London, UK). The remaining 15 participants (datset 2) were testedt in a replication of the experiment ran at the University College London, Division of Psychology and Language Science (London, UK), using the same procedure and an equivalent experimental setup. Two participants displayed a very large response bias in one of the two tasks (see Analysis) and were excluded from the analysis. No statistical methods were used to pre-determine sample size; sample size was chosen to be similar to those reported in previous studies28,29.
All participants had normal or corrected-to-normal vision and gave their informed consent in written form prior to participation. All participants were naïve to the specific purpose of the experiment. Naïve participants were compensated with £10 pounds for each hour of experiment.
Behavioural tasks
Behavioural protocols required participants to make a sequence of two perceptual decisions each trial. There was no maximum time limit to give the response and in all tasks participants were explicitly asked to prioritize accuracy over speed (nevertheless response times covaried with confidence, see Supplementary Results, Analysis of response times). Experimental protocols were implemented using MATLAB (The MathWorks Inc., Natick, Massachusetts, USA) and the Psychophysics Toolbox30,31.
Participants were asked in each decision to either discriminate the mean orientation (left or right from vertical) of an array of lines, or the direction of motion (left or right) of dynamic, random-dot motion stimulus. All trials always included both discrimination tasks (e.g., first orientation then motion, as in Fig. 1, or vice-versa) but the order differed across sessions. The lines were 150 black and white segments (0.7 degrees of visual angle or dva long, anti-aliased), presented on a grey background and randomly placed using a uniform distribution over a circular area (diameter 8 dva) placed at the center of the screen. The orientation of the lines were sampled from a Gaussian distribution with varying mean and standard deviation fixed at 15 degrees. The random-dot stimulus was made of 200 black and white dots (diameter 0.1 dva), presented within the same circular area, moving at a speed of 4 dva/sec, with a lifetime of 4 refresh cycles (≈67 msec). Both lines and dots were presented for 300 msec. A number (1 or 2) was present on top of the display to remind the participants whether the current decision was the first or the second of each trial, together with two dots on the left and right side of the stimulus, which were both white for the first decision but red and green for the second, indicating the expected alternative in case of incorrect and correct first decision, respectively. Stimuli were presented on a LCD monitor, 51.5cm wide, placed at 77cm of viewing distance (the distance was kept constant by means of a chin rest), in a quiet, dimly lit room. The monitor resolution was 1920×1200.
The experiment was split into three sessions run on separate days; participants were compensated with 10£ for each hour of experiment. In the first session, participants completed 300 trials of the control task in which the first and second decisions were independent. Each trial comprisied two perceptual decisions. In one block (150 trials) the first decision was about the orientation of the lines
while the second was about motion direction. This order was reversed in the second block. An auditory beep after the second decision indicated whether subjects responded incorrectly in either of the two decisions.
In each of the following two sessions participants completed 300 trials of the dual-decision task, where the correctness of the first response was predictive of the direction of the second stimulus. The order of the two discrimination tasks varied across sessions with order counter-balanced across participants. Before each session of the dual-decision task, participants were reminded of the conditional rule and ran a short practice session. The practice continued until participants confirmed they understood the structure of the experiment and were comfortable to continue to the experiment. In the dual-decision trials, an auditory beep after each trial indicated if participants responded correctly to the second decision. Stimulus discriminability (mean tilt of the lines or motion coherence) were sampled randomly from a uniform distribution, spanning from 0 to a maximum tilt of 12 degrees or 80% coherence in the initial control task. The maximum values in the subsequent two sessions were set to 2 standard deviations of internal noise (σ) is, as estimated from control trials; see Analysis for details).
Analysis
Choices in the second decision (coded either as left vs right or correct vs incorrect) were analyzed by means of logistic regressions fit at the individual level (for details of logistic regression models see the Supplementary Information: Model-agnostic analyses). Effects were tested at the group level either by computing bootstrapped confidence interval on the estimated odds-ratios, or by means of t-tests on the coefficients of the logistic regression (which corresponds to the logarithm of the estimated odds-ratios and whose distribution could be assumed normal, as indicated by Shapiro-Wilk tests). Bootstrapped confidence intervals were computed using the bias-corrected and accelerated method32. All tests were two-tailed and were run with an alpha level of 0.05. In the case of non significant t-tests, evidence for the null hypothesis was estimated by means of Bayes factors (null/alternative), computed using the JZS prior33 (which consists of a Cauchy prior on the standardized effect size and uninformative Jeffreys prior on variances). All analyses were performed in the open-source software R34
.
Estimation of internal noise. For each participant we estimated the standard deviation of the
internal noise (σ) is) by considering only first decisions and control trials, in which the prior probability of the stimulus was identical between left and right alternatives. To account for the possibility that participants might have made attention lapses (e.g. stimulus-independent errors) or be biased, we fit 4 different psychometric functions, ranging from the simplest function with only one free parameter (that is the noise parameter, σ) is), to a most complex function that had 3 free parameters, including a lapse rate parameter and a bias term (a non-zero location parameter). In all the 4 psychometric functions the parametric form was a cumulative Gaussian (see Supplementary Information for details), so each function included the same noise parameter (σ) is). Each psychometric function provided a slightly different estimate of the internal noise σ) is. For analyses, we combined the 4 estimates by weighting them according to the Akaike weight35 of each psychometric function. This results in a more robust estimate of the noise that is not conditioned on any of the specific psychometric functions considered but instead permits all scenarios whilst reducing the chance of overfitting. The model-averaged estimates were used to transform the values of the stimulus from raw units (degrees or coherence) to units of internal noise (σ) is). Two participants were excluded from subsequent analyses because their first decisions in one
of the two task displayed a large systematic bias (more than 2 standard deviations of the average bias of all participants).
Computational modelling.
To model performance in our task we considered that observers can have access only to a noisy estimates of the stimulus levels, corrupted by Gaussian noise (i.e. the internal response as defined in signal detection theory). We then developed alternative computational models implementing different strategies and compared their ability to account for performance in the second decision. We fit models to individual data by numerically finding the values of the free parameters that maximized the (log) likelihood of choices in the second decision. Only second decisions were used in the model comparison since all the models make similar prediction for the first decision, but differ in how they use information from the first choice to inform the second decision. We performed two types of model comparisons, both based on the Akaike Information Criterion11 (AIC) as a measure of fit quality. First we compared the AIC values of each model, summed across subjects. However, this analysis assumes that all participants used the same strategy (corresponding to a given model) to generate their behavior. Therefore we also performed a more conservative analysis, which takes into account the possibility that different subjects may have used different models to generate their behavior and aims at inferring the probability of each model12 (see Supplementary Information for details). Additionally, to ensure that the models are distinguishable, we generated synthetic data and verified that the generative models could be correctly recovered based on their AIC values (see Extended Data Figure 3).
In the following we summarise the main features of the computational models tested; the mathematical details are provided in the Supplementary Information.
Ideal Bayesian observer. The ideal Bayesian observer has full knowledge of the statistics of the
internal noise and can use this knowledge to accurately compute the posterior probability of having responded correctly (i.e. its confidence). The confidence is then used to update prior expectations for the second stimulus; in the Supplementary Information we show that updating prior expectations amounts to shifting the decision criterion and we provide a derivation of the optimal shift in decision criterion, given the internal response and the level of internal noise. The only parameter of the ideal model is the internal noise standard deviation (σ) is), however since this is estimated only from first decisions, this model can be regarded as having no free parameters.
Bayesian sampler. This class of models represents a sampling-based approximation of the ideal
Bayesian model. According to this model the observer does not have access to the full probability distribution of their internal response, but can approximate it based on a finite number of samples. The performance of this model will approach the ideal Bayesian model as the number of samples grow to infinity, however it is expected to display systematic biases for a small number of samples. In the Supplementary Information we show that these biases are characterised by over-confidence, that is in the opposite direction with respect to what we found for most of our subjects. These sampling-based approximations of the ideal Bayesian model are thus inconsistent with our behavioural results.
Biased-Bayesian. This model performs a Bayesian computation, but is sub-optimal because it uses
an incorrect estimates of its own internal noise. Specifically, while the variability of its internal response is described by a Gaussian distribution with standard deviation σ) is, to assess its confidence the biased-Bayesian observer uses mσ) is (with m>0). The only free parameter is the factor m characterising the extent by which the internal noise is mis-estimated. If m=1 the biased-Bayesian model is equivalent to the ideal Bayesian, whereas it will display systematic global biases for values different from 1.
Values of m>1 indicate over-estimation of the internal variability, and will lead to global under-confidence biases, whereas values 0<m<1 indicate under-estimation of internal variability and will lead to over-confidence.
Discrete confidence. This model does not assume any knowledge about the nature of the internal
stochastic processes linking the stimulus to the internal response. Therefore the only information available to monitor the uncertainty of the decision is the distance of the internal response (which can be considered a point-estimate) to the decision criterion; specifically, it assess confidence by comparing the internal response to an additional confidence criterion. This model’s confidence can therefore be described as a set of discrete ‘states’: a ‘confident’ state that is obtained when the internal response exceed the confidence criterion; and a complementary ‘uncertain’ state. Only when in the ‘confident’ state will it shift the criterion used for the second decision. It has two free parameters: one first parameter determining the location of the confidence criterion, and a second parameter indicating by how much it will shift the decision criterion (for the second decision) when ‘confident’ about the first.
Fixed-bias. This is the model of an observer that does not monitor uncertainty on a trial-by-trial
basis, and instead adopts a simple fixed-bias that increases the probability of choosing the ‘right’ option in the second decision. It has one free parameter, which corresponds to the decision criterion used in the second decision.
Data availability
The data that support the findings of this study are available at https://osf.io/w74cn/.
Code availability
The code for models and analyses that support the findings of this study is available at https://osf.io/ w74cn/.
References
1. Ernst, M. O. & Banks, M. S. Humans integrate visual and haptic information in a statistically optimal fashion. Nature 415, 429–433 (2002).
2. Mamassian, P. Visual Confidence. Annual Review of Vision Science 2, annurev-vision-111815-114630 (2016).
3. Sanders, J. I., Hangya, B. & Kepecs, A. Signatures of a Statistical Computation in the Human Sense of Confidence. Neuron 90, 499–506 (2016).
4. Adler, W. & Ma, W. J. Limitations of proposed signatures of Bayesian confidence. bioRxiv (2018). doi:10.1101/218222
5. Rahnev, D. & Denison, R. N. Suboptimality in Perceptual Decision Making. Behavioral and Brain Sciences 41, 1-66 (2018).
6. De Finetti, B. La prévision: ses lois logiques, ses sources subjectives. in Annales de l’institut Henri Poincaré 7, 1–68 (1937).
7. Savage, L. J. Elicitation of Personal Probabilities and Expectations. Journal of the American Statistical Association 66, 783–801 (1971).
8. Drugowitsch, J., Moreno-Bote, R. R. & Pouget, A. Relation between Belief and Performance in Perceptual Decision Making. PLoS ONE 9, e96511 (2014).
9. Fleming, S. M. & Lau, H. C. How to measure metacognition. Frontiers in human neuroscience 8, 1–9 (2014).
10. Barthelmé, S. & Mamassian, P. Evaluation of Objective Uncertainty in the Visual System. PLoS Computational Biology 5, e1000504 (2009).
11. Akaike, H. A new look at the statistical model identification. IEEE Transactions on Automatic Control 19, 716–723 (1974).
12. Stephan, K. E., Penny, W. D., Daunizeau, J., Moran, R. J. & Friston, K. J. Bayesian model selection for group studies. NeuroImage 46, 1004–1017 (2009).
13. Rigoux, L., Stephan, K. E., Friston, K. J. & Daunizeau, J. Bayesian model selection for group studies - Revisited. NeuroImage 84, 971–985 (2014).
14. Nelson, T. O. Metamemory: A Theoretical Framework and New Findings. in Psychology of Learning and Motivation 26, 125–173 (Elsevier, 1990).
15. Ulehla, Z. J. Optimality of perceptual decision criteria. Journal of Experimental Psychology 71, 564–569 (1966).
16. Zhang, H., Daw, N. D. & Maloney, L. T. Human representation of visuo-motor uncertainty as mixtures of orthogonal basis distributions. Nature Neuroscience 18, 1152–1158 (2015). 17. Fleming, S. M. & Daw, N. D. Self-evaluation of decision performance: A general Bayesian
framework for metacognitive computation. Psychological review 124, 1–59 (2016).
18. Adler, W. T. & Ma, W. J. Comparing Bayesian and non-Bayesian accounts of human confidence reports. PLOS Computational Biology 14, e1006572 (2018).
19. Zhang, H. & Maloney, L. T. Ubiquitous log odds: A common representation of probability and frequency distortion in perception, action, and cognition. Frontiers in Neuroscience 6, 1–14 (2012). 20. De Gardelle, V., Le Corre, F. & Mamassian, P. Confidence as a common currency between vision
and audition. PLoS ONE 11, (2016).
21. de Gardelle, V. & Mamassian, P. Does Confidence Use a Common Currency Across Two Visual Tasks? Psychological Science 25, 1286–1288 (2014).
22. Meyniel, F. & Dehaene, S. Brain networks for confidence weighting and hierarchical inference during probabilistic learning. Proceedings of the National Academy of Sciences 114, E3859–E3868 (2017).
23. Bang, D. & Fleming, S. M. Distinct encoding of decision confidence in human medial prefrontal cortex. Proceedings of the National Academy of Sciences 115, 6082-6087 (2018).
24. Laquitaine, S. & Gardner, J. L. A Switching Observer for Human Perceptual Estimation. Neuron
97, 462-474.e6 (2018).
25. Gardner, J. L. Optimality and heuristics in perceptual neuroscience. Nature Neuroscience 22, 514-523 (2019).
26. Maloney, L. T. & Mamassian, P. Bayesian decision theory as a model of human visual perception: Testing Bayesian transfer. Visual Neuroscience 26, 147 (2009).
27. Huys, Q. J. M., Maia, T. V. & Frank, M. J. Computational psychiatry as a bridge from neuroscience to clinical applications. Nature Neuroscience 19, 404–413 (2016).
28. Meyniel, F., Schlunegger, D. & Dehaene, S. The Sense of Confidence during Probabilistic Learning: A Normative Account. PLoS Computational Biology 11, 1–25 (2015).
29. Aitchison, L., Bang, D., Bahrami, B. & Latham, P. E. Doubly Bayesian Analysis of Confidence in Perceptual Decision-Making. PLoS Computational Biology 11, 1–23 (2015).
30. Kleiner, M., Brainard, D. & Pelli, D. What’s new in psychtoolbox-3. Perception 36 ECVP Abstract Supplement (2007).
31. Pelli, D. G. The VideoToolbox software for visual psychophysics: transforming numbers into movies. Spatial vision 10, 437–442 (1997).
32. Efron, B. Better Bootstrap Confidence Intervals. Journal of the American Statistical Association,
82, 171-185 (1987).
33. Rouder, J.N., Speckman, P.L., Sun, D., Morey, R.D., & Iverson, G. Bayesian t tests for accepting and rejecting the null hypothesis. Psychonomic Bulletin & Review 16, 225-237 (2009).
34. R Core Team. R: A language and environment for statistical computing. (R Foundation for Statistical Computing, 2020).
35. Burnham, K. P. & Anderson, D. R. Model Selection and Multimodel Inference: A Practical Information-Theoretic Approach. (Springer New York, 2002).
Acknowledgements
This work was partially supported by funding from the French National Research Agency (grant ANR-12-BSH2-0005 to A.G.). The funders had no role in study design, data collection and analysis, decision to publish or preparation of the manuscript. We thank Joshua A. Solomon and Michael J. Morgan for providing facilities. This paper is dedicated to the memory of Andrei Gorea, whose creative, untameable and questioning mind inspired this project and made it possible.
Author contributions
M.L., A.G. and G.Mo. conceived the study. M.L., and G.Mo. developed the computational models. M.L. programmed the experiments. M.L. and G.Mi. collected the data. M.L analysed the data. M.L, G.Mo. and T.D. interpreted the results. M.L. wrote the paper with feedback from all authors.
Competing interest