HAL Id: hal-00753151
https://hal.archives-ouvertes.fr/hal-00753151
Submitted on 13 Mar 2018
HAL is a multi-disciplinary open access
archive for the deposit and dissemination of
sci-entific research documents, whether they are
pub-lished or not. The documents may come from
teaching and research institutions in France or
abroad, or from public or private research centers.
L’archive ouverte pluridisciplinaire HAL, est
destinée au dépôt et à la diffusion de documents
scientifiques de niveau recherche, publiés ou non,
émanant des établissements d’enseignement et de
recherche français ou étrangers, des laboratoires
publics ou privés.
Towards a crisis performance-measurement system
Carine Rongier, Matthieu Lauras, François Galasso, Didier Gourc
To cite this version:
Carine Rongier, Matthieu Lauras, François Galasso, Didier Gourc. Towards a crisis
performance-measurement system. International Journal of Computer Integrated Manufacturing, Taylor & Francis,
2013, 26 (11), pp.1087-1102. �10.1080/0951192X.2012.684711�. �hal-00753151�
Towards a crisis performance-measurement system
Carine Rongiera, Matthieu Laurasa,b*, Franc¸ois Galassoa,cand Didier Gourca
aIndustrial Engineering Department, Universite´ de Toulouse, Mines Albi, Route de Teillet, 81000 Albi, France;bDepartment of Industrial Organization, Logistics and Technology, Toulouse Business School, Universite´ de Toulouse, 20 Boulevard Lascrosses,
31068 Toulouse, France;cIUT de Rodez, Universite´ de Toulouse, 33 avenue du 8 mai 1945, 12000 Rodez, France (Received 30 May 2011; final version received 31 March 2012)
During a crisis, the main goal for decision-makers consists in restoring a stabilised nominal mode. The stakeholders face considerable pressure and drastic constraints in response time and coordination. This study proposes a method to support these stakeholders in making responsive and accurate decisions while carrying out a performance evaluation of the activities that run during the crisis-response process. This method is composed of four steps: (1) characterisation of the crisis-response system, (2) selection of system components to evaluate in priority, (3) determination of performance dimensions to consider and (4) creation of indicators. Currently, performance evaluation is only used subsequent to a crisis, due to difficulties in gathering and aggregating information into trustable performance indicators. This paper proposes a method to obtain a relevant and dynamic decision-support system. Decision-makers will use it to resolve the crisis based on performance evaluation, in addition to the essential experience they undergo. A case study of crisis management within the French Red Cross non-governmental organisation is developed, through a Web-based prototype, in order to explain how performance indicators can both support crisis-response management and improve the collaboration of stakeholders.
Keywords: disaster management; crisis management; performance assessment; humanitarian organisation process; performance indicators; performance-measurement system
1. Introduction
The global objective of this research project is to help managers in charge of a crisis situation support the actors involved, so that they all work together efficiently, according to a tight schedule. There are two groups of actors in the emerging ecosystem that is established for the crisis response. Firstly, there are actors in the field, using their specific abilities (i.e. to perform business activities such as evacuating injured people, repairing a road, etc.), and secondly, there are the managers of these actors in the field, who can be grouped into a crisis cell with a single authority. Each head is in charge of, firstly, the activities of the actors in the field and, secondly, the transfer of information inside the crisis cell. Although the actors share the same global aim, they do not deal with the same problem. Therefore, as explained in Vitale et al. (1994), the communication and exchange of qualitative information between the crisis stakeholders are not sufficient to give each member a global view of the crisis and to support decision-making effectively. They also need quantitative information.
The increased frequency and scale of disasters, the scarcity of resources, the funding competition and the
need for accountability require more efficient, effective and transparent crisis operations (Balcik 2008). When a crisis occurs, the system leaves its nominal mode and the goal for the actors is to restore such a mode. The challenge is to be able to orchestrate and to implement their response. Of course, stakeholders have to react quickly but they also have to deal with a high level of pressure and numerous constraints. More specifically, stakeholders have different roles or decisional levels and sometimes act through distant relationships. For example, the team members are managed by team leaders in the field, who, in turn, are in touch which crisis managers at the headquarters. This increasing complexity should impose the use of decision-making support systems and, particularly, of performance-measurement systems (PMSs). But few if any crisis specialists go as far as to implement these kinds of systems. This goes against traditional recommenda-tions found in the academic and business world. Currently, the existing response processes are mainly based on experience, and decision-support systems are not yet familiar to crisis stakeholders. Particularly in the case of humanitarian organisations intervening in disasters, best practices are only developed from the
*Corresponding author. Email: [email protected] 2012, 1–16, iFirst article
ISSN 0951-192X print/ISSN 1362-3052 online ! 2012 Taylor & Francis
http://dx.doi.org/10.1080/0951192X.2012.684711 http://www.tandfonline.com
reporting of results drawn up after each crisis. Although it is known that the capitalisation of data is useful whatever the situation is (there are many ongoing research works on ontology in crisis context such as Faraotti et al. (2009) and WenJun et al. (2009)), the quality of the response cannot be accurately measured with such an approach, due to several limiting factors (Davidson 2006, Kovacs and Spens 2007):
. detection and resolution of problems and diffi-culties in crisis resolution are mainly done a posteriori and not in ‘real time’;
. information is quasi-exclusively qualitative and cannot be interpreted differently by stakeholders and
. collaboration between stakeholders is very in-tuitive and no factual overview of the crisis response is available during operations.
For all these reasons, our research project focuses on this question of providing a decision-support system for crisis stakeholders by developing a metho-dology to design a dedicated PMS. The reasoning suggested in this paper aims to provide a guide for the actors during the response. In concrete terms, this paper presents a method for the actors, close to a roadmap, to create a PMS that could be used during the response phase and an instantiation of this methodology on a use case through a Web-based prototype. This new method, combined with the indispensable expertise of the actors, should improve the impact and efficiency of crisis-response processes.
Our findings are presented in four parts.
Firstly, Section 2 presents the research statement, while Section 3 provides a state-of-the-art review. Then, Section 4 deals with the improvement in the monitoring of crisis response that comes from using performance assessment. Finally, an application with the French Red Cross (FRC) is described.
2. Research statement
The notion of crisis or disaster is a manifest component of our research work. The meaning of these words has changed greatly since their initial appearance and differs from one field to another. Some authors talk about crisis or disaster to show the urgent aspect of a situation, considering the suddenness of the event and the required speed of response, while others simply use them to denote a change. The two words (crisis and disaster) are often used to describe this concept. Usually, a crisis is considered man-made and a disaster a natural phenomenon (Mukhopadhyay 2005). In this paper, the two words are used equally to
qualify a serious threat that affects the basic structures or values and fundamental standards of a social system. In situations of strong pressure and high uncertainty, this requires crucial decisions to be taken (Rosenthal and Charles 1989).
These definitions show how complex and dynamic a crisis is. It underlines the fact that it is necessary to make decisions in a very short time to lead to an adaptation of the system (Jacques and Gatot 1996). Moreover, it introduces the dynamic aspect of a crisis. Basically, a crisis situation evolves all the time, making it difficult to manage.
According to Alexander’s cycle management (Alex-ander 2002) and a review of the literature, the disaster management cycle is composed of: prevention, pre-paration, response and recovery. Our study concen-trates on the third phase: the response. This phase integrates all the actions to be carried out as soon as the event leading to the crisis takes place, such as the release of the emergency plan or the evacuation of a threatened population. At this level, the main aim is to set up actions that will work on the system in crisis in order to bring it back to a normal situation as soon as possible.
Thus, our research statement consists in finding a method giving crisis stakeholders information on where they are, how they are doing and where they are going. In other words, the main purpose of this paper consists in proposing a method to design a PMS to support the management of the response in case of crisis.
Like any computer-based information system, the design of such a PMS supposes to reach two goals to be effective: (i) good definition of the user’s require-ments and (ii) relevant technical requirerequire-ments and a good implementation. This paper only focuses on the first dimension.
Bourne and Bourne (2005) indicate that a good PMS should help decision-makers in five effective ways:
. establish the current position; . communicate direction;
. stimulate action in the most important areas for business;
. facilitate learning and . influence behaviour.
These objectives are clearly the ones we want to reach in a crisis context through our research work. A PMS is defined by Neely et al. (1996) as a set of metrics and performance ratios, used to quantify both the efficiency and the effectiveness of actions. Following this definition, we can remark that a PMS is not necessarily computer-based. In other words, our research work consists in designing a method to define
a set of performance measurements that can reflect the real state of the system through indicators (from Gunasekaran and Kobu 2007). Once the measure-ments are made, they are compared with the objectives to obtain the performance assessment inducing a closed loop illustrated in Figure 1.
Once the assessment made, the performance can be improved if necessary.
3. Salient features of performance assessment methods and systems in a crisis context
In this section, a brief overview shows the reader what a performance assessment consists of, particularly in a crisis context. This section focuses on the state of the art with regard to the implementation of indicators in times of crisis.
Many authors have reviewed the literature on performance measurement, performance metrics, per-formance assessment and/or perper-formance management (Chow et al. 1994, Beamon 1999, Bourne et al. 2003, Kleijnen and Smits 2003, Folan and Browne 2005, Chan et al. 2006, Alfaro et al. 2009, Martin and Patterson 2009, Akyuz and Erkan 2010). Both accounting management and operations management have dealt with these subjects. Theories and methods cover the whole range of performance influences on decision levels, from strategic to operational decisions (Lohman et al. 2004).
3.1. Performance and business process
The idea of identifying an activity as the atomic entity on which performance must be achieved is not new. Activity-based costing and activity-based management (ABC/M) have promoted this idea for a long time. They are concerned with information on costs and margins (Cokins 2001). The ABC assigns costs to activities on the basis of their use of resources and then allocates costs to products according to their ratio of activity consumption. If the principle seems intuitively obvious, access to pertinent information in order to implement the method is frequently a limitation
(Ghalayini et al. 1997). Moreover, the volume of information processed by the method is controlled by the definition of Key Performance Indicators (KPIs) that are supposed to be meaningful for ABM through the use of well-structured dashboards (showing pro-gress of actions applied to strategy, value perceived by the customer, performance of competitors, quality and improvement steps). It is quite clear that the extrapola-tion of such approaches to crisis situaextrapola-tions is not easy. In addition, some ABM dashboard dimensions (i.e. customer, competitor) could become fuzzy in such a context. This is an illustration of some of the blockages that any extension of PMS to crisis management has to deal with.
The holistic process PMS (Kueng 2000), the performance prism (Neely et al. 1996), the process-based framework (Chan et al. 2006) or the Fraunhofer approach (Bourne et al. 2003) are initiatives that also have developed the idea of PMS design based on business processes. The pertinence of KPIs is enhanced by the knowledge captured in process representation. Process models are oriented graphs of activities that naturally provide a solution to support the aggregation of data and to quantify KPIs. This is emphasised by the fact that a business process model frequently has many levels of decomposition and that KPIs can be distributed among those levels at approximately the right scale of activity detail.
As previously stated, in the context of a crisis, a business process representation is a necessity to check the common agreement of businesses and put a frontier between what can be shared among partners and what cannot be shared (Charles and Lauras 2011). Because of this search for agreement, the supply chain operations reference (SCOR) model has received a lot of attention from business practitioners. The SCOR model (SCC 2003) provides a unified representation of supply chains with five general processes: plan, source, make, delivery and return. Each process can be refined into sub-processes, which are themselves decomposed into sub-sub-processes, and so on. The first granularity levels of the reference model are generic enough and can be used to compare several companies of a given sector. Three categories of KPIs are proposed in the SCOR model dashboard (Bolstorff 2002) depending on what they are related to:
. customers (service, flexibility, effectiveness– swiftness);
. internal processes (costs and efficiencies) and . shareholders (profitability, return on
investments).
Although these performance indicators are at-tached to processes and well formulated, they remain
Figure 1. Principle of performance assessment (from Berrah 2002).
very difficult to set up within an existing supply chain. Moreover, differences between crisis supply chains and business supply chains are too important (Charles and Lauras 2011) to consider applying this model to a crisis context: stakeholders, categories of flows, funding process, dynamics and complexity of environment, operation lifecycle, etc. In addition, the SCOR model does not ‘try to close the loop’, and there is no suggestion that the KPIs should be used to manage the system. Thus, without a method, it could be rather difficult – even random in some cases – to infer the necessary corrective actions.
According to these methods, the key element is the cutting up of the system into several axes and the creation of specific indicators for each axis.
Thus, it is necessary to determine on which level the assessment is made, i.e. to identify the various business processes that need to be monitored.
3.2. Performance and decision-making processes The basic purpose of any measurement system is to provide feedback, relative to predefined goals, that increases the chances of achieving these goals effi-ciently and effectively. Measurement gains true value when used as the basis for timely decisions. Conse-quently, many PMS methods link performance to decisions. The strategic PMS (Vitale et al. 1994), the performance-measurement questionnaire (Bourne et al. 2003, Chan et al. 2006), the strategic measure-ment analysis and reporting technique system (Cross and Lynch 1989) or the Cambridge University’s PMS method (Bourne et al. 2003) can be quoted as examples. They insist on the need to split decisions into many levels depending on their weight on the organisation and their time effect. Thus, decisions do not have the same impact on the system, depending on whether the level is strategic, tactic or operational. These methods also look for the sensitivity between KPI variations and alternative decisions by direct investigation. But if the information on performance is condensed in KPIs, it is also possible to synthesise it on decisions using the well-known performance determi-nant, a concept first introduced by the balanced scorecard method (Kaplan and Norton 1996). The performance determinants have been natively defined as a control variable because one of the main criteria to select them is a sensitivity evaluation of their influence on the system.
All the previous methods focus on strategic management, and even if a reference to internal processes is proposed as an improvement policy, there is very little information about the method of how to achieve it. Particularly in a crisis context, it is crucial to
set up KPIs to help actors face the most difficult decisions in a very short time, i.e. the most critical ones. So, it is necessary to identify the most critical activities among all the activities of the system.
Thus, a key question is how this classification of critical activities should be made.
3.3. Key performance indicators
Lorino (2003) defines the performance indicator as a piece of ‘information that can help an actor, individual or more generally, a collective, to lead action towards the realisation of an objective or can allow evaluation of the result of it’.
In a normal situation, the performance is the con-vergence of several dimensions: relevance, efficiency, effectiveness, responsiveness, flexibility and resilience (Marcon et al. 2003, Tang 2006, Durieux-Paris et al. 2007, Humez 2008). These dimensions basically aim to identify the origins of the performance of a business process or activity in order to guide more directly the decision-making. Efficiency, for instance, expresses whether the resources were well used to reach the results. Then, if a problem occurs with such a KPI, the decision-maker knows that s/he has to work on the appropriate-ness of resources and means to be more capable.
If these dimensions are available in a normal situation, in a crisis situation the needs regarding performance assessment are different because of the reasons given previously (several different actors, a short reaction time, etc). It is thus necessary to know whether the dimensions listed above are applicable in this case or if there are new dimensions.
Thus, in the case of a disaster, it is useful to determine the dimensions that will predominate.
3.4. Performance assessment methods in a crisis context
This section sums up the needs identified or the research undertaken by several authors on the subject of performance in a crisis situation. Obviously, the organisations must improve their response to crises for various reasons:
. crises are increasingly visible through the media, which means that the organisations gamble with their reputation in each crisis;
. the economic conditions are less and less favourable (less donors, who want some feed-back about how their donation was used). Finances should be controlled and optimised and
. ‘Disasters are more frequent so the organisations must reinforce their practices’ (Dautun 2007), because they will have to respond to crises more often.
Performance assessment can lead to such improve-ments by monitoring the crisis response.
With regard to humanitarian crises, which are probably the most representative application case, Davidson (2006) explains that humanitarian aid agencies are keen to use performance assessment to improve their crisis management, but progress is slow because little information exists concerning perfor-mance. She has started developing KPIs for humani-tarian supply chains. Balcik (2008) explains why the humanitarian organisations need tools to help them manage the response to a crisis. She even affirms that ‘measuring the performance of the relief chains has become vital for all the organisations involved in disaster management’. Moreover, she considers that there are few elements about performance assessment in humanitarian supply chains in the literature, even though it is a crucial element (Balcik 2008). In 2008, this topic had not yet been developed and still has not been. Currently, the concept of performance within governmental organisations (NGOs) is either non-existent or poorly understood. Improving performance means understanding what it is and what the ways of improvement are. As regards the indicators, either they are not relevant and thus quickly abandoned or theoretically listed but not actually used. Thus, there is clearly a gap between the well-known and developed concept of performance in a company and the vision of the humanitarian sector where performance is not well known and decidedly unused.
A search of articles by keywords shows that the literature is dense concerning performance in normal situations and crises. On the other hand, the literature is very reduced on the subject of performance in situation of crisis, which means that the link between ‘perfor-mance’ and ‘crisis situations’ has not yet been made. Research works on performance in crises have only started recently (Schulz and Heigh 2009). The informa-tion currently available often comes from the practi-tioners and not from the field of research (Kovacs and Spens 2007). One of the most representative examples is probably the quality COMPAS method (URD 2009) that has been developed by URD Group since 1999 (the last version was published in 2009). This method is a quality assurance step that has been designed specifi-cally for humanitarian aid work. It can be used for project management and project evaluation, and its overall objective is to continuously improve the quality of services provided to crisis-affected populations. Although the project evaluation part could be
considered as a very interesting source for our study, it appears that the COMPAS only gives a global perspective of the key characteristics of the crisis-response project. The main objective of this method is finally to be able to justify actions made to donators on the one hand, and to improve their processes for future interventions on the other hand. However, there is no way to define KPIs to support decision-making during the crisis-response operation with COMPAS.
Further research work in this field should be investigated.
3.5. Performance assessment systems in a crisis context
Nowadays, a lot of information systems exist and can support crisis-response processes. These systems are generally called crisis information management sys-tems (CIMSs). The aim of such a CIMS is to provide a complete suite of Information and Communication Technologies functions addressing many requirements from the emergency management community (Iannella et al. 2007).
Six groups of tools could be identified according to (see. Table 1):
(1) the part of the crisis situation concerned by the tools: impacted system and crisis-response processes and
(2) the principal features of the tools: communica-tion, gathering of data and decision support. A lot of systems are used to provide and spread information on the crisis description and/or its manage-ment is available (see cells 1 and 2 of Table 1). One of the most representative examples is ‘Reliefweb’ (http:// reliefweb.int/ )which is an Internet platform dedicated to communication in a humanitarian disaster context. For each crisis, this platform records raw information in order to inform other stakeholders about the last events. People are consequently kept informed of the crisis situation, its evolution and the ongoing opera-tions. Nowadays, a great majority of crisis decision-centres uses such a system to communicate. Never-theless, these kinds of systems could be considered as basic (with very little added value).
The tools presented in cells 3 and 4 of Table 1 relate to systems that gather data in order to characterise the crisis (victims, damage, position, etc.) or the response operations (means engaged, geographical position, status of operation, etc.). This category of systems is led by a huge number of geographical information systems, for instance, ‘CartONG’ (http://www. cartong.org/), generating maps on epidemiology,
topography, place of crisis during humanitarian crises or ‘GEOPhoenix-operations’ (http://www.geocon-cept.com/-Gestion-de-crise,810-.html) to follow in real time the position of the emergency vehicles. In this category of systems, a new type of enterprise resource planning (ERP) appears slowly. The Sigmah 1.0 project is one example of this trend (http:// www.sigmah.org). This project consists in developing a simple, easy-to-use tool which centralises and cross-references all the data associated to a crisis response in the humanitarian sector. If Sigmah is limited to the data management functionalities for the moment, the consortium wishes to propose a more complete system which could support the decision-making in crisis situation. A new 2.0 version should be developed in that sense.
The last category of tools relates to the decision-support systems in crisis situations (see cells 5 and 6 of Table 1). There are very few tools available in this category today. Nevertheless, some systems propose functionalities that simulate the evolution of the behaviour of the crisis system. For instance, the ‘PAREFEU’ tool (http://www.isted.com/pole-ville/ sig_risques/sig_risques_ch3_art5.pdf) carries out the simulation of the propagation of a fire. Despite this kind of tool dedicated to the impacted system, no decision-support system dedicated to the response processes seems to exist. However, as discussed in Section 1, there is a real need for tools that can support decision-making in crisis situation, particularly in order to know, rapidly and effectively, which activity needs to be improved.
We can remark that all these systems are comple-mentary during a crisis situation. This analysis shows clearly that some functionalities are still missing in existing tools; particularly the decision-support function-alities. Iannella et al. (2007) confirm this conclusion. Through a CIMS framework composed of 3 layers and
12 functions, the authors list all the functionalities that exist in current CIMS. No decision-support function appears in this framework. Actually, the authors explain that CIMSs only propose aggregated reports (text files), budgets, expenditures or geospatial images. Due to this lack and given that it constitutes a main need for crisis experts today (confirmed in our case by the FRC and the project managers of the Sigmah project in which 10 humanitarian organisations intervene), we have chosen to focus our research work on this point. Thus, based on the literature review previously described, Section 4 presents the method that we propose to design a crisis PMS.
4. Defining a crisis PMS
The methods and tools presented in the literature review provide frameworks for decision support. However, project managers remain on their own to make an efficient use of such tools. The main afford of the herein proposed method, represented in Figure 2, is to guide decision-makers through four steps. At each steps, tools are associated in order to facilitate both the under-standing of the method and its application. Particularly, Steps 1–3 bridge the gaps discussed in the literature review. The fourth step designs accurate KPIs.
4.1. Step 1: on what level is the assessment made? The creation of performance indicators implies an analysis of the organisation to determine on which part the assessment must focus. Such an analysis can be done from scratch, as a project relying on the under-standing of the crisis by practitioners that have to deal with a partial view of what the crisis is or could become. The main interest of Step 1 is to use a process structure sufficiently generic to integrate all the activities and processes that have to be considered in the response phase. It has two main advantages for
Table 1. Different categories of tools used in a crisis situation.
Function of tools
Field concerned
Impacted system Crisis-response processes
Communication 1 2
Examples of information systems: Reliefweb.int,
One response, SAHANA, Emergesat, CRISISTM Examples of information systems: Reliefweb.int,,One response, SAHANA, Emergesat, EM2000, EOC System, OpsCenter
Gathering of data 3 4
Examples of information systems: CartONG, Parefeu, Responsphere, Rescue, Emergesat, E-Team, LEADERS
Examples of information systems: Sigmah 1.0, Geophenix-operations, CartONG, E-Team, Country Response Information System
Decision support 5 6
Example of information systems: Country Response Information System, Parefeu
Examples of information systems: none.Some projects are under development such as the Sigmah 2.0 project (2011–2014)
practitioners: (1) to have off-the-shelf processes in order to gain time and (2) to have a reference model in order to position themselves during the deployment of the response phase.
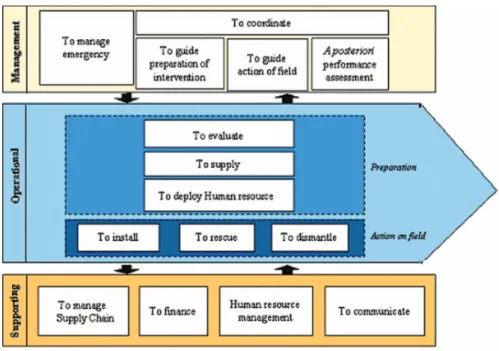
The structure of these processes, based on the generic structure described by Porter (1985), can be applied to various types of crises. Generic business processes concerning the response phase have been defined. Then, some processes specific to crisis manage-ment have been added or adapted to the Porter structure, particularly based on NGO reports (for example, situation reports or the single form for huma-nitarian aid actions). On this basis, a cartography for the response process has been defined (see Figure 3).
In order to model the different parts of the response system, we have used the business process management concept according to the rules of standard ISO 9000:2000.
The map in Figure 3 shows three types of processes: . Type 1: management
The management of emergency process validates the importance of starting an intervention. Then, there is a process that describes field management and another which explains the preparation of the intervention. There is also a unit to coordinate these processes and to manage collaboration with other stakeholders. Finally, a process is devoted to an a posteriori report, so that actors can draw up reports on response and provide feedback. . Type 2: operational
There are processes for preparation and pro-cesses for actions conducted in the field.Prepara-tion is composed of the evaluafield.Prepara-tion that takes place at the beginning of the response and which is updated regularly, the supply of material resources and the deployment of human re-sources.
In the field, there are three processes: the install process which consists in deploying hu-man and material resources on the area of intervention; the rescue process which is the implementation of activities of response; and finally, the dismantlement process, which consists in clearing the area of intervention and leaving.
Figure 3. Cartography for a generic response process. Figure 2. Method developed.
. Type 3: supporting
The supporting processes consist in putting human and material resources at the actors’ disposal. There are also financial aspects and activities of communication to manage.
Each process is made up of sub-processes, not detailed at this stage. The sub-processes depend on the kind of response. Thus, a process in the generic cartography can have different sub-processes, for example, according to the typology of the disaster. The generic process ‘to rescue’, for example, is available whatever the type of rescue may be (medical assistance, food aid or develop-ment aid), but the sub-processes will be different. Indicators can monitor each process or sub-process. The next section shows how and why critical activities can be selected.
4.2. Step 2: selection of processes using a risk analysis Performance assessment can slow down the progres-sion of the response if teams spend too much time measuring unimportant values either directly by causing a waste of time or indirectly by generating errors whose resolution would mobilise too many resources. It therefore seems more relevant to put indicators on the less reliable parts of the system.
Step 2 is dedicated to the selection of such less reliable processes or activities identifying the most critical risks in order to limit the quantity of indicators to be managed and data to be gathered.
As discussed in the literature review, it seems logical to link the concept of crisis with the concept of risk. The notion of risk is very intuitive but its definition is not. Risk can be defined as: ‘the possibility of the occurrence of an event having positive or negative consequences. Risk is characterised by two dimensions: its probability and the measure of its potential effects’ (Gourc 2006).
Thus, based on the Failure Mode, Effects and Criticality Analysis method, a risk analysis is under-taken in order to index the most critical processes and to monitor how they are carried out using the indicators. The risk analysis consists in identifying risks for processes defined in the map (Figure 3). For each defined risk, causes and consequences are given. Then, for each risk, its criticity, which is the product of its gravity, its detectability and its occurrence, is calculated. If the result exceeds a given threshold, the risk is considered critical, and thus the process associated with this risk is also considered critical. According to the kind of crisis, it is possible to attach more importance to one of the criteria, such as gravity in the case of a natural disaster.
4.3. Step 3: determination of predominant performance dimensions
A first complexity due to the modelling of a lot of processes to be evaluated is raised and solved through Steps 1 and 2 leading to a better understanding of the crisis. Thus, it is now important to guide the managers for the determination of its evaluation framework. The state-of-the-art review (Section 3) highlights that some authors propose measuring and analysing the perfor-mance according to several perforperfor-mance dimensions. As explained in Section 3.3, the purpose of these dimensions is to propose a structured way to explain the origin of the performance or non-performance of a business process or an activity. Thus, it would make it easier for stakeholders to diagnose existing problems on this business process or activity and consequently to make appropriate decisions to improve the perfor-mance level. Therefore, the scientific challenge consists in identifying which dimensions should be analysed in a time of crisis, starting from the dimensions defined in the literature, in particular from the practitioners’ viewpoints.
This concept started with three complementary performance dimensions (relevance, effectiveness and efficiency) that expressed the relationship among the objectives (or constraints), results and resources (or means) assigned to an activity or a business process (Marcon et al. 2003, Mollard 2006). Effectiveness measures whether the results of the activity meet its objectives. Efficiency expresses whether the resources are well used to reach the results. The relevance measures the adequacy between the means and the objectives. As a reminder, a business process is a set of activities, which can be defined as tasks that produce results for a customer by using means and following given objectives.
A system, an organisation or a crisis-response situation has several characteristics that must be considered. Consequently, we proposed a dedicated framework to structure the performance analysis in crisis context (see. Figure 4).
The characteristics in Figure 4 are defined as follows:
. Objectives: these are the targets to reach. Objectives and indicators are defined simulta-neously. Each indicator controls the achievement of a part of the objectives.
. Means: these are the organisation’s resources at disposal to make the system function.
. Results: this is the real state of the system. The results are obtained through the measurement of the indicators.
. Donators/beneficiaries: in its schematisation, Mollard (2006) proposes integrating the ‘public’
aspect, which corresponds to the customers, called the ‘evolution of the triangle of perfor-mance assessment’. Balcik (2008) attempts to characterise the humanitarian supply chain’s customer. Contrary to commercial supply chains, it is not the person who pays who receives the product. Thus, it is important to differentiate the donator from the beneficiary. So, there are two customers in a humanitarian supply chain: donators and beneficiaries.
In this framework (Figure 4), the dimensions of performance have been identified from a literature review of performance (see Section 3.3) in a normal situation and from the various characteristics of a crisis situation. These dimensions make it possible to assess the performance of the system. They are as follows:
. Relevance: the articulation between the means and the objectives.
. Efficiency: represents the adequacy between the means and the results.
. Satisfaction: represents the donators’ satisfaction.
. Expectations: the identification of the benefici-aries’ needs.
. Impact: the bond among the means, the objec-tives and the results, which represents the effectiveness of the response in the crisis situation. . Agility: the combination of effectiveness,
respon-siveness and flexibility.
Customers, who are both the donators and the beneficiaries, play an important role, so we have retained the dimensions proposed by Mollard (2006): satisfaction and expectations. Moreover, the dynamic aspect is fundamental during a crisis, so reactivity and flexibility have to be assessed. Finally, we consider that the crisis management system, composed of means,
results, objectives and customers, is similar to any system, so one can refer to effectiveness, efficiency, effectivity and relevance (Marcon et al. 2003). Accord-ing to the literature, effectiveness, reactivity and flexibility can be named agility. The word impact is more appropriate to a crisis situation than effectivity.
Thus, these dimensions of performance are the key components upon which the subsystems of the organisation in crisis shall be evaluated, and are taken into account in the creation of our PMS.
4.4. Step 4: the definition of key performance indicators
For each critical activity, one or more indicators of performance must be determined in order to complete the performance assessment. According to the litera-ture review, we characterised these indicators by a wording, which describes what the indicator measures, by a formulation, which shows the calculation to be made to obtain the result, and finally by their dimension of performance.
Practically, this step firstly consists in focusing on the business process or activity that the process owner wants to monitor (see Steps 1 and 2). Secondly, s/he has to define the main performance dimensions s/he wants to follow during the execution of the business process. This identification should be based on several dimen-sions that we have defined in Step 3. Obviously, all the dimensions should not be monitored for each activity. For example, the process owner might give a priority to the agility dimension to manage an activity of rescue, whereas s/he might give a priority to the efficiency dimension to manage an activity of transportation. Thirdly, the process owner has to define a set of KPIs judged as representative of the performance dimension retained for the selected business process or activity. In order to define these KPIs, stakeholders can use their own expertise and some specific database (COMPAS framework or European Commission Humanitarian Operation (ECHO) requirements for the humanitarian sector, for instance).
The indicators created are indexed in a summary table (see example in Table 1), which can be considered as a dashboard, in order to facilitate their use.
4.5. Synthesis of our main contributions
To see the different contributions of our research work, a comparison between a crisis management with our method and without it is presented in Figure 5. Three major added values can be considered:
. Concerning the management: our method gives a description of the response processes and
Figure 4. Crisis performance assessment framework.
activities and then measures the KPI. The results of the KPI give more relevant and reliable data for decision-making compared to the one the decision-makers used to have.
. Concerning the reporting: a real-time reporting on the state of activities that are finished and/or in progress is made possible. Efforts to capitalise and produce experience feedbacks are conse-quently limited.
. Concerning the communication and collabora-tion between stakeholders: our method gives the possibility to share and exchange dynamically (and not only at the end of operations) objective and quantitative information in addition to the traditional informal reports.
5. Application case: FRC organisation
This study was carried out in cooperation with the FRC. The chosen case study is a sudden-onset disaster, an earthquake. The FRC wanted to set up a PMS for the reasons explained previously: to monitor the crisis
response in real time, to have reports sent to the donors, to improve communication between the several stakeholders of the FRC during the response and to keep data for feedback on the experience.
5.1. Construction of crisis PMS for FRC application The method described above was implemented on the disaster response. Our study focused on the humani-tarian organisation’s response phase.
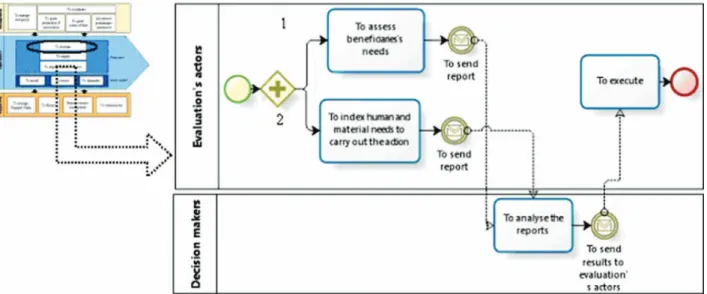
5.1.1. Step 1
In this paper, the emphasis is put on process evaluation (see details in Figure 6).
This process is only divided into four ‘off-the-shelf’ sub-processes that can be themselves divided into activities.
Process evaluation is essential in humanitarian interventions. It should not take too much time, as the response process would be slowed down. However, it must be carried out seriously because estimation
Figure 5. Comparison between crisis management with and without our method.
errors can subsequently have serious consequences and reduce the effectiveness of the response, in particular regarding the supply chain.
In this process, two kinds of evaluations must be differentiated into two sub-processes:
. the evaluation of needs (indexed 1 on Figure 6) consists in determining the human and material resources that are necessary in the place of the disaster and in which quantity;
. the determination of the suitable kind of response (indexed 2 on Figure 6): this assessment is made once accessibility to the site has been determined. It consists in defining and quantify-ing the usable means for procurement and movement to the location of the disaster. All the processes on the map have to be modelled and detailed in sub-processes. These sub-processes
were mapped following interviews with FRC experts and their validation.
5.1.2. Step 2
Step 2 enables the practitioners to integrate the specific state of the crisis by focussing on the most critical activities and find out what cannot be neglected. The purpose of Step 2 is to adopt a structured way to navigate through the predefined processes.
According to the method, once the processes are defined, a risk analysis is carried out (Step 2). In Table 2, only the results for the evaluation of needs process are detailed. The scale used for the calculation of the criticity is 3, 6 and 9. The threshold above which a risk is considered critical is 100. For example: if one considers that the studied risk is rather easily detectable, very serious and rare, the result obtained is 66 9 6 3, making it critical. Thus, an indicator
Table 2. Risks analysis for ‘evaluation of needs’.
Sub-process: evaluation of needs Risk analysis
Names Causes Consequences
Criticity D6 G 6 O Slow evaluation Bad organisation of estimation Waste of time 66 9 6 3 ¼ 162 Error on the assessment
of needs
Pessimistic estimation: too many means requested
Waste of means 66 9 6 3 ¼ 162 Optimistic estimation: not enough means
requested
Lack of means 96 9 6 3 ¼ 243 Qualification of actors Bad estimation of personnel’s
competences
Personnel does not have the requested competence
66 6 6 3 ¼ 108 Figure 6. Process evaluation (from Rongier et al. 2010).
has to be set up on the relevant process. This work is summarised on the left part of Table 2.
This identification of critical processes (Table 2) constitutes Step 2 of our method.
5.1.3. Step 3
Then, Step 3 consists in selecting dimensions to evaluate the risks identified previously.
Among the possible performance indicators that can be associated to a process, decision-makers have to consider which one can apply the best to each process. Step 3 enables him/her to choose among the dimen-sions of performance that have been aligned with the crisis problematic in the previous section (see Figure 4). Moreover, such an approach has the advantage to stress the necessity to understand how priorities must be assigned for each process. This leads the practi-tioners to understand if the considered process is, for instance, a matter of agility, relevance or efficiency.
The sub-process ‘evaluation of needs’ needs to be responsive: i.e. to provide good results as fast as possible. The stake of this process consists in providing responsively and with a maximum of accuracy, a picture of the needs on the field. Consequently, the agility dimension (see. Figure 4) undoubtedly appears as the primordial dimension of performance. Indeed, an approach based on efficiency is not valuable because there is no expensive means to optimise, and errors during this phase are considered very serious (graded 9 in Table 2).
This work is summarised in Table 3.
5.1.4. Step 4
Then, according to Step 4, an indicator is created for each risk to control it, according to the performance dimension that needs to be assessed. In this example, the KPI was defined according to the ECHO require-ments (which is the main donor in such a crisis operation) and according to the expertise of FRC emergency teams. Practically, they define four
complementary KPIs (see Table 4). The first one measures the responsiveness of the process (cycle time between the start event of the crisis and the start event of the appeal to donors and field teams). The second and third ones measure the difference between the items needed (according to the process of evaluation) and the items really ordered (according to the available funds and technical possibilities). These KPIs are considered both in total quantities of items and in terms of number of items (references missing). The last KPI defined relates to the capability of the actors (National Societies for the Red Cross Network) to provide the good services according to the evaluation of needs. This KPI is valuable on a 1–4 scale (Level 1 expresses the good adequacy between the actor and the missions he was asked, whereas Level 4 expresses a bad adequacy between the actor and the missions he was asked).
5.2. Use of the PMS embedded in a Web-based PMS In order to be used in a real context of crisis, we developed a Web-based prototype of our crisis PMS for the FRC application as a full support for running the method. In this section, the NGO’s needs are detailed and the requirements of the Web-based tool are listed. Then, the characteristics of the tool, i.e. browsing, description of pages and displays, are described.
5.2.1. The NGO’s needs
The NGO’s requirements were identified through several interviews and work sessions with several people from different units of the FRC (an emergency action unit manager who supervises the crisis response from the headquarters, a team leader who works on the field, a quality manager and a logistician). The interviews led to the following requirements for the PMS system:
. data on the crisis to enable decision-makers to identify problem areas, i.e. to help them control
Table 3. Selection of dimensions of performance. Sub-process: evaluation of needs
Risk Dimensions of performance Slow evaluation Agility
Error on the assessment of needs (pessimistic)
Agility Error on the assessment of
needs (optimistic)
Agility Qualification of actors Relevance
Table 4. Scorecard for the sub-process ‘evaluation of needs’.
Name Formulation Objectives Cycle time Days between the beginning
of crisis and appeal
5 days Coherence
between orders and needs
Number of items or means asked (order)/number of items or means requested (crisis area)
100%
Ref. asked (order)/ref.
requested (crisis area) 100% Relevance of the
choice of actors
Level of relevance 1
the response process and to make the supply of experience feedback and reports easier;
. to assess performance by activities or processes and
. to have an overview of the performance at the crisis level in order, for example, to write reports. The best-adapted solution to meet these needs is an Internet-based tool. But considering the current information systems of the FRC and the fact that reports are done by people having a Web access, we chose to develop our prototype on a Web-based technology. However, other interface technologies could be proposed complementary to our prototype in order to be compatible with all technologies (for instance mobile). Further research work should focus on this point.
The main aim of this tool is to support decision-makers to better manage the crisis. To do so, the tool developed must make it possible:
. to easily access processes, activities or indicators that need to be studied,
. to add, consult and store all the measurements of KPIs,
. to register comments and to exchange reporting files in order to compile the history of the various actions that are carried out,
. to analyse measurements in order to obtain a performance assessment,
. to easily generate reports containing the infor-mation about the response to the crisis,
. to show an overview of crises (different crises; processes and KPIs for a crisis, etc.),
. to make a graphical analysis of measurements and
. to improve communication and collaboration between stakeholders in the field and at headquarters.
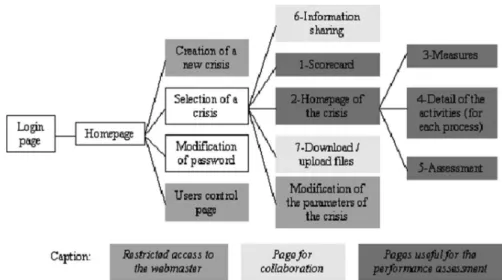
To summarise the general features of the tool: when a crisis occurs, an existing process map is uploaded or a new one is created using the generic map (Figure 3). Steps 2–4 of the method are carried out. The tool is then in service and the measurements for indicators can start. The site map is shown in Figure 7:
Three pages have a restricted access, while the others are fully accessible to all the users. Two are spe-cifically designed for collaboration: the first one allows the exchange of documents and facilitates the colla-boration between stakeholders (number 7 on Figure 6) and the other permits exchange and display of messages or comments (number 6). Then, five pages (numbers 1– 5) are dedicated to the performance assessment. They are detailed in the following paragraph.
5.2.2. Description of the main pages
The stakeholders can access various web pages from the homepage of crisis (number 2): scorecard (1); measurements (3), process (4) and assessment (5).
. Scorecard page: this page displays the results of all processes and thus of the total crisis response.
. Measurement page: this page is used to enter the measurements of each indicator of the selected process and to attach comments to the measure-ments. A one-week period measurement has been chosen by the FRC, i.e. stakeholders must enter theirs once a week. The values memorised can be
Figure 7. Site map.
modified. The tool can provide assistance detect-ing missdetect-ing values and takes them into account while displaying the percentage of captured values.
. Process page: this page gives the user access to the detail of the different tasks of a process. This record of the various activities constitutes the process under evaluation.
. Assessment page: the tool capitalises the data captured in the measurement page, makes an analysis and posts it on the assessment page. An extract of the database is shown in Figure 8, to explain the link among a process, an indicator and the
crisis. An indicator belongs to a process that belongs to a crisis. The users simply have to plot the data and complete the measurement. The calculations of the performance results in these pages will not be detailed in this paper. They are based on a multi-criteria aggregation.
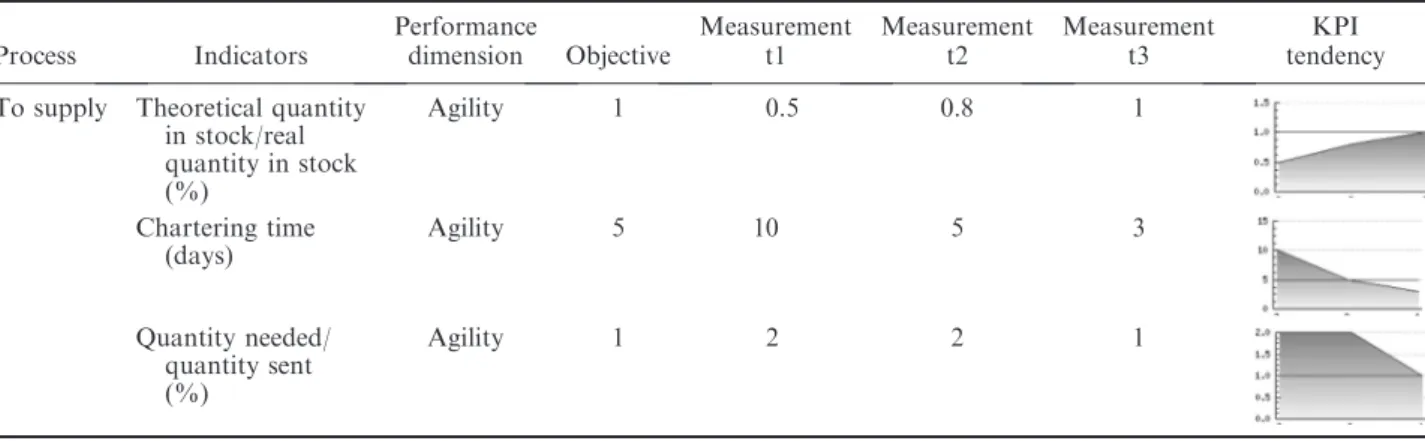
Examples of results are presented in Table 5. The comments written by the various users can be down-loaded. This kind of report is useful (1) to have an overview of the results of a process and detect where a problem is, (2) to show the donors the results and (3) to keep a record of the results at a given moment (t3). These three goals are crucial for the humanitarian sector, as confirmed by the FRC staff we interviewed.
Figure 8. Extract of the database.
Table 5. Example of report obtained with the developed tool for a process (from Galasso et al. 2011). Process Indicators Performance dimension Objective Measurement t1 Measurement t2 Measurement t3 KPI tendency To supply Theoretical quantity
in stock/real quantity in stock (%) Agility 1 0.5 0.8 1 Chartering time (days) Agility 5 10 5 3 Quantity needed/ quantity sent (%) Agility 1 2 2 1
As long as our tool meets their needs, it should be implemented in the short run.
6. Conclusion
In this paper, we have developed an original method to define a PMS dedicated to crisis management. The increase of disasters, emergency cases and abnormal situations implies the necessity to better control the response processes that are executed to resolve such crises. If the literature review shows that very few methods and information systems exist to support decision-making in such a situation, experience shows that most decisions are based on the sole experience of the stakeholders, showing the way to improvement.
A state-of-the-art review on crisis management and performance revealed the research statement that has to be reached and the requirements our method should include. Practically, our proposition emphasised four points: (1) characterisation of the crisis-response system, (2) selection of system components to evaluate in priority, (3) determination of performance dimen-sions to consider and (4) creation of indicators. The method has been tooled through a Web-based proto-type and applied to a humanitarian case study (FRC). Although the application case was not full-size, it clearly shows how our proposition can be implemented and used in crisis context. Field experts such as FRC emergency teams and Sigmah project leaders validated all our concepts, approaches and tools. This validation concerned both the applicability and relevancy for the decision-making process in emergency context. Never-theless, this validation cannot be considered as sufficient and a real implementation of our proposition should be considered as a priority in the future. Concretely, research works on this point are under progress with the Sigmah project team (including more than 10 organisations specialised in humanitarian crisis management). The Sigmah project consists in devel-oping a kind of ERP for crisis management, and the integration of our proposition (functionalities) in the 2.0 version of the software is under way.
Other research perspectives can be identified from this paper. Firstly, methods and tools to calculate and display the performance results on the PMS should be developed in order to adapt the different decision-making supports to the different stakeholders’ needs. Secondly, it might be interesting to check our proposition against industrial or commercial crisis cases. Although our theoretical propositions were studied on general crisis management and performance assessment concepts, we focused mainly on humani-tarian applications. Thirdly, even if the use of ontology was not the purpose of this paper, it could be a very interesting perspective to this research work.
Particularly, it might be interesting to use the information collected and structured through the crisis PMS as inputs for crisis ontology or by using crisis ontology.
References
Akyuz, G.A. and Erkan, T.E., 2010. Supply chain perfor-mance measurement: a literature review. International Journal of Production Research, 48 (17), 5137–5155. Alexander, 2002, in Coppola, D.P., 2007. Introduction to
international disaster management. Oxford: Butterworth-Heinemann.
Alfaro, J.J., et al., 2009. Business process interoperability and collaborative performance measurement. International Journal of Computer Integrated Manufacturing, 22 (9), 877–889.
Balcik, B., 2008. Relief chain planning and management: modeling and analyzing humanitarian logistic problems. Thesis (PhD). Washington University.
Beamon, B.M., 1999. Measuring supply chain performance. International Journal of Operations and Production Management, 19 (3), 275–292.
Berrah, L., 2002. L’indicateur de performance, concepts et applications. Toulouse: Ce´padue`s editions.
Bolstorff, P., 2002. How does SCOR measure up? Supply Chain Technology News. Available from: http://www. scelimited.com/wp-content/uploads/2012/02/HowDoes SCORMeasureUp.pdf [Accessed 14 June 2012]. Bourne, P. and Bourne, M., 2005. Views from around the world.
Measuring Business Excellence, 9 (3). Available from: http:// www.emeraldinsight.com/journals.htm?issn¼1368-3047& volume¼9&issue¼3&articleid¼1520355&show¼abstract [Accessed 14 June 2012].
Bourne, M., et al., 2003. Implementing performance mea-surement systems literature review. International Journal of Business Performance Management, 5 (1), 1–24. Chan, F.T.S., Chan, H.K., and Qi, H.J., 2006. A review of
performance measurement systems for supply chain management. International Journal of Business Perfor-mance Management, 8 (2–3), 110–131.
Charles, A. and Lauras, M., 2011. An enterprise modelling approach for better optimisation modelling: application to the humanitarian relief chain coordination problem. OR Spectrum, 33 (3), 815–841.
Chow, G., Heaver, T.D., and Henriksson, L.E., 1994. Logistics performance: definition and measurement. International Journal of Physical Distribution & Logistics Management, (24), 17–28.
Cokins, G. 2001. Activity-based cost management: an execu-tive’s guide. New York: John Wiley & Sons.
Cross, K.F. and Lynch, R.L., 1989. The SMART way to define and sustain success. National Productivity Review, 8, 23–33.
Dautun, C., 2007. Contribution a` l’e´tude des crises de grande ampleur: connaissance et aide a` la de´cision pour la se´curite´ civile. Thesis (PhD). Saint-Etienne University.
Davidson, A.L., 2006. Key performance indicators in humanitar-ian logistics. Thesis Massachusetts Institute of Technology. Durieux-Paris, S., Genin, P., and Thierry, C., 2007. Docu-ment de synthe`se du projet. GdR Macs, Prise de de´cision dans la chaıˆne logistique en monde incertain.
Faraotti, A., et al., 2009. Information management for crisis response in WORKPAD. In: 6th international ISCRAM conference, Gothenburg.
Folan, P. and Browne, J., 2005. A review of performance measurement: towards performance management. Compu-ters in Industry, 56 (7), 663–680.
Galasso, F., et al., 2011. Disaster management control: decision support trough performance assessment. In: Proceedings of IFAC world congress, Milano, Italy. Ghalayini, A.M., Noble J.S., and Crowe, T.J., 1997. An
integrated dynamic performance measurement system for improving manufacturing competitiveness. Interna-tional Journal of Production Economics, 48 (1–2), 44– 45.
Gourc, D., 2006. Vers un mode`le ge´ne´ral du risque pour le pilotage et la conduite des activite´s de biens et de services. France: HDR, Toulouse University.
Gunasekaran, A. and Kobu B., 2007. Performance measures and metrics in logistics and supply chain management: a review of recent literature (1995–2004) for research and applications. International Journal of Production Re-search, (45), 2819–2840.
Humez, V., 2008. Proposition d’un outil d’aide a` la de´cision pour la gestion des commandes en cas de pe´nurie: une approche par la performance. Thesis (PhD). Toulouse University.
Iannella, R., Robinson, K., and Rinta-Koski, O.-P., 2007. Towards a framework for crisis information management systems (CIMS). In: Proceedings of the 14th annual conference of the International Emergency Management Society (TIEMS), 5–8 June Trogir, Croatia.
Jacques, J.M. and Gatot, L., 1996. De l’incident a` la catastrophe: un mode`le organisationnel. Paris: Elsevier. Kaplan, R.S. and Norton, D.P., 1996. The Balanced
Scorecard: translating strategy into action. Boston: Harvard Business School Press.
Kleijnen, J.P.C. and Smits, M.T., 2003. Performance in supply chain management. Journal of the Operational Research Society, (54), 507–514.
Kovacs, G. and Spens, K., 2007. Humanitarian logistics in disaster relief operations. International Journal of Physi-cal Distribution & Logistics Management, 37 (2), 99–114. Kueng, P., 2000. Process performance measurement system: a tool to support process-based organizations. Total Quality Management, 11 (1), 67–85.
Lohman, C., Fortuin, L., and Wouters, M., 2004. Designing a performance measurement system: a case study. European Journal of Operation Research, (156), 267–286.
Lorino, P., 2003. Me´thodes et pratiques de la performance. Paris: Editions d’Organisation.
Marcon, E., Se´ne´chal, O., and Burlat, P., 2003. Evaluation des performances des syste`mes de production. In: Concepts pour la performance des syste`mes de production. C. Herme`s.
Martin, P.R. and Patterson, J.W., 2009. On measuring company performance within a supply chain. Interna-tional Journal of Production Research, 47 (9), 2449–2460. Mollard, D., 2006. Syste`mes de´cisionnels et pilotage de la
performance. Paris: Lavoisier.
Mukhopadhyay, A.K., 2005. Crisis and disaster management turbulence and aftermath. New Delhi: New Age International.
Neely, A.D., et al., 1996. Performance measurement system design: should process based approach be adopted? International Journal of Production Economics, 46–47, 423–431.
Porter, M., 1985. Competitive advantage. New York: The Free Press
Rongier, C., et al., 2010. Towards a performance measure-ment system to control disaster response. In: Proceedings of PRO-VE’10. 11th IFIP working conference on virtual enterprises, Saint-Etienne, France.
Rosenthal, U. and Charles, P., 1989. Coping with crises: the management of disasters, riots and terrorism. Springfield: CC Thomas.
SCC, Supply Chain Council, 2003. Supply chain operations reference-models – SCOR version 6.0. Cypress: Supply Chain Council.
Schulz, S. and Heigh, I., 2009. Logistics performance management in action within a humanitarian organiza-tion. Management Research News, 32 (11), 1038–1049. Tang, C.S., 2006. Perspectives in supply chain risk
manage-ment. International Journal of Production Economics, 103, 451–488.
URD, 2009. Quality COMPAS companion book, V9.0.6. Plaisians: Urgence Re´habilitation De´veloppement Edi-tion, 60 pp.
Vitale, M., Mavrinac S.C., and Hauser, M., 1994. New process/financial scorecard: a strategic performance measurement system. Planning Review, 22 (4), 12–16. WenJun, W., CunXiang, D., and Peng, Y., 2009. Ontology
modelling of emergency plan systems. In: 6th interna-tional conference on fuzzy systems and knowledge discovery, China.